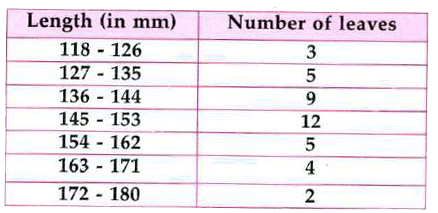
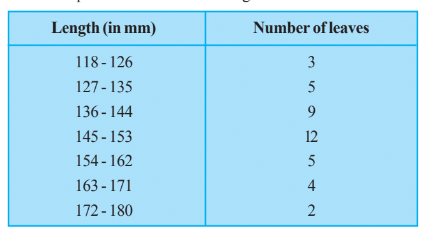
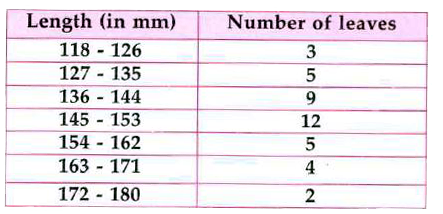
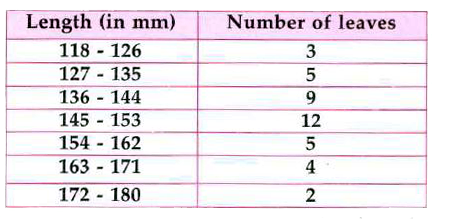
The lengths of 62 leaves of a plant are measured in millimetres and the data is represented in the following table:

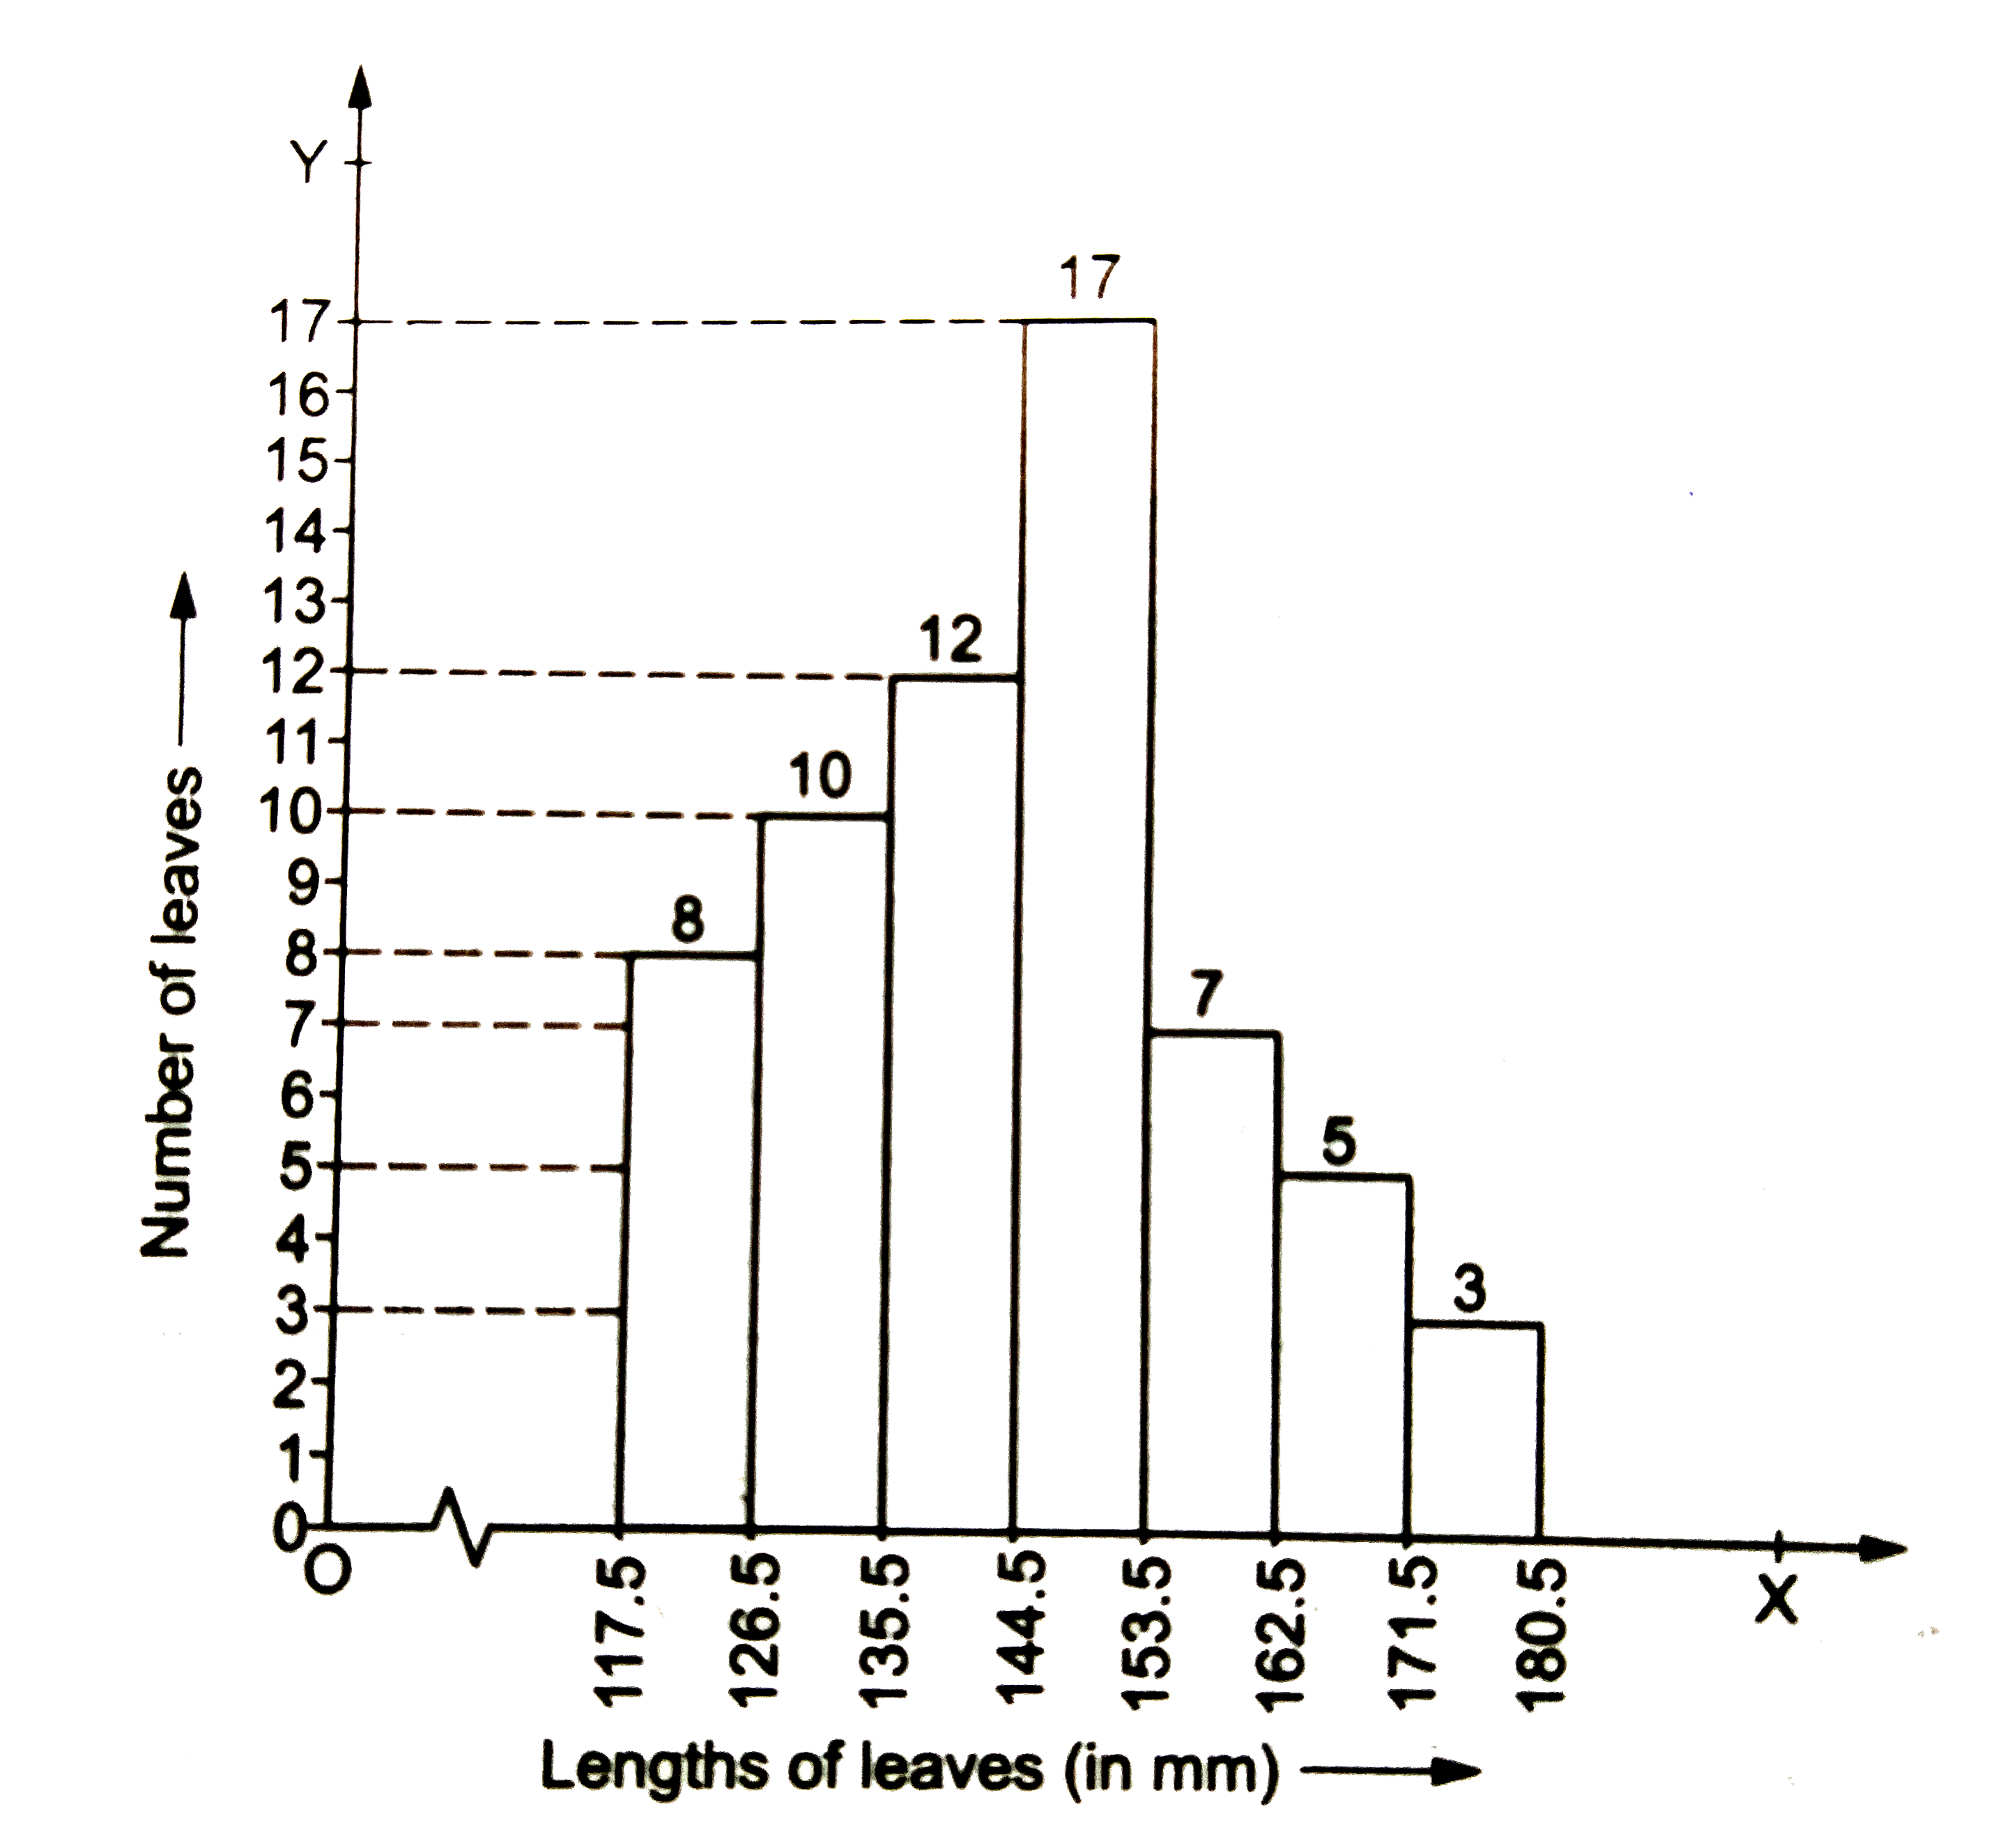
Draw a histogram to represent the above given data.
The given frequency distribution is in inclusive form. So, we convert it into an exclusive form, as shown below.
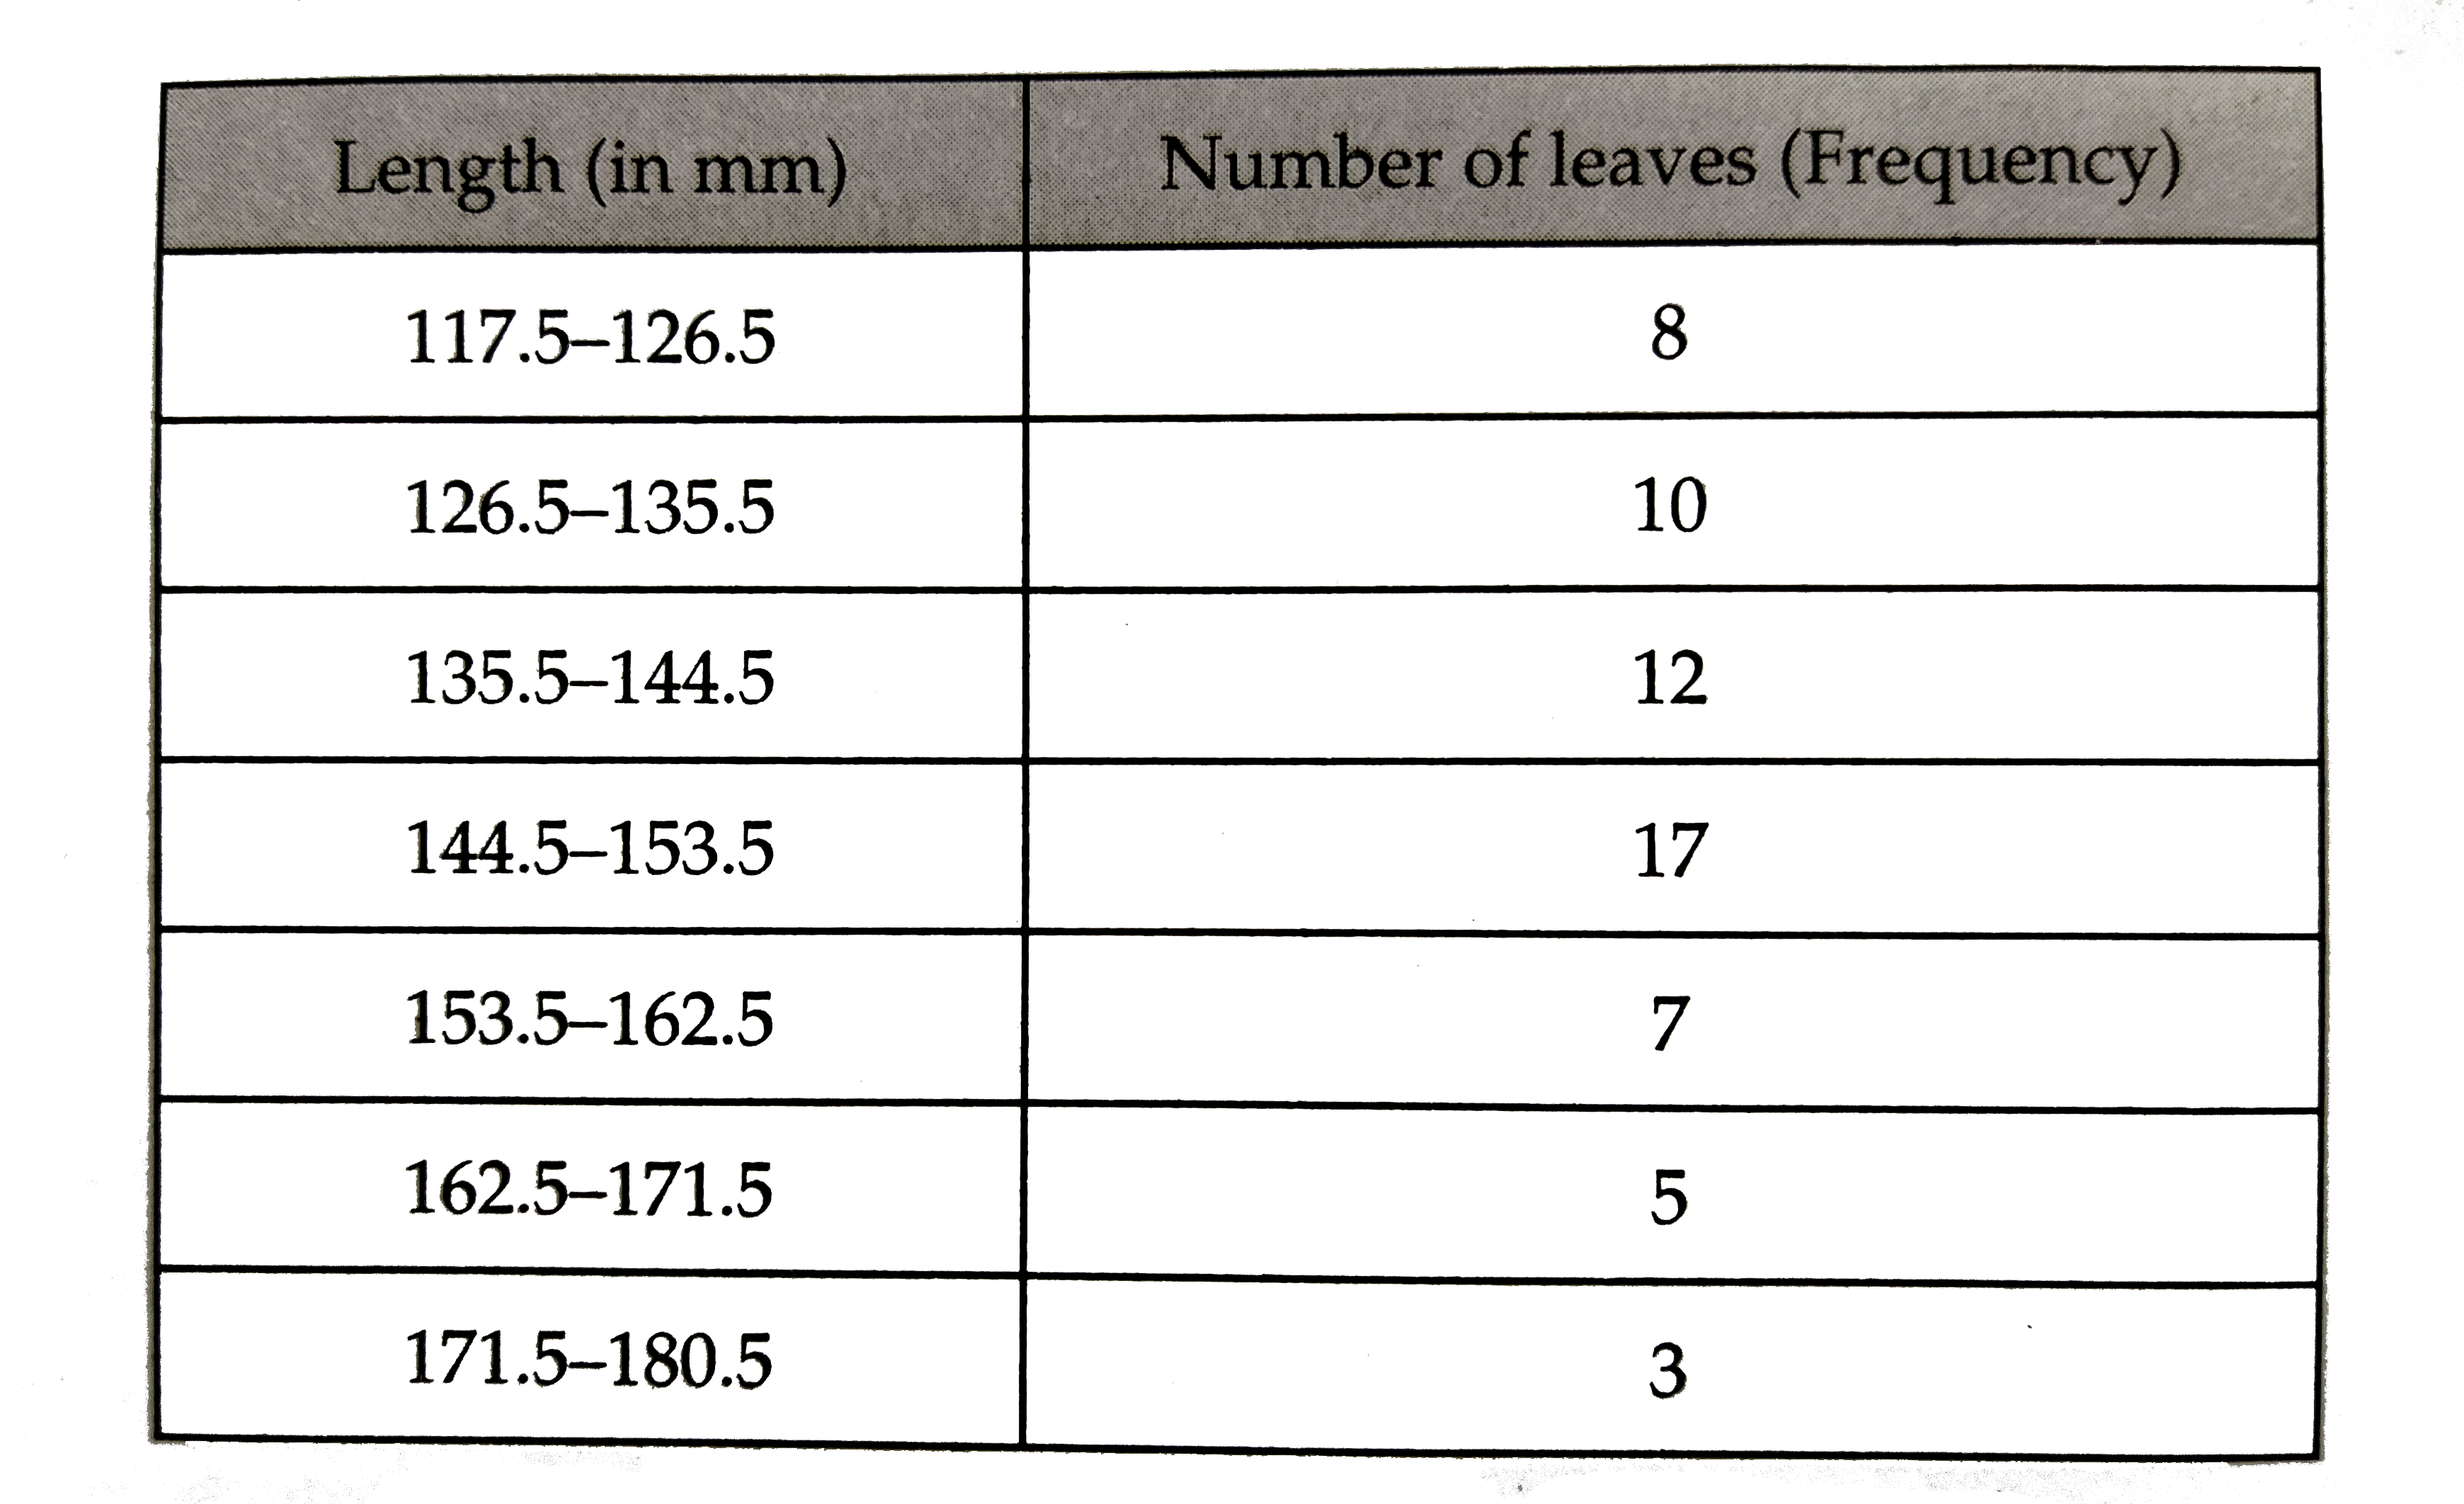
We represent the class intervals along the x-axis, using a suitable scale and mark frequencies along the y-axis, using another suitable scale. Since we do not start the length from 0, so we use a kink  in the beginning of the x-axis, as shown below. Now, we obtain the required histogram, as shown below.
Topper's Solved these Questions
- BOOK - RS AGGARWALCHAPTER - BAR GRAPH, HISTOGRAM AND FREQUENCY POLYGONEXERCISE - EXERCISE 17A12videos
BAR GRAPH, HISTOGRAM AND FREQUENCY POLYGON
- BOOK - RS AGGARWALCHAPTER - BAR GRAPH, HISTOGRAM AND FREQUENCY POLYGONEXERCISE - EXERCISE 17B16videos
BAR GRAPH, HISTOGRAM AND FREQUENCY POLYGON
- BOOK - RS AGGARWALCHAPTER - BAR GRAPH, HISTOGRAM AND FREQUENCY POLYGONEXERCISE - EXERCISE 17B16videos
BAR GRAPH, HISTOGRAM AND FREQUENCY POLYGON
- BOOK - RS AGGARWALCHAPTER - AREAS OF TRIANGLES AND QUADRILATERALSEXERCISE - Multiple Choice Questions (Mcq)16videos
AREAS OF TRIANGLES AND QUADRILATERALS
- BOOK - RS AGGARWALCHAPTER - CIRCLES EXERCISE - MULTIPLE CHOICE QUESTION(MCQ)37videos
CIRCLES
Similar Questions
The lengths of 62 levels of a plant are measured in millimetres and the data is represented in the following table
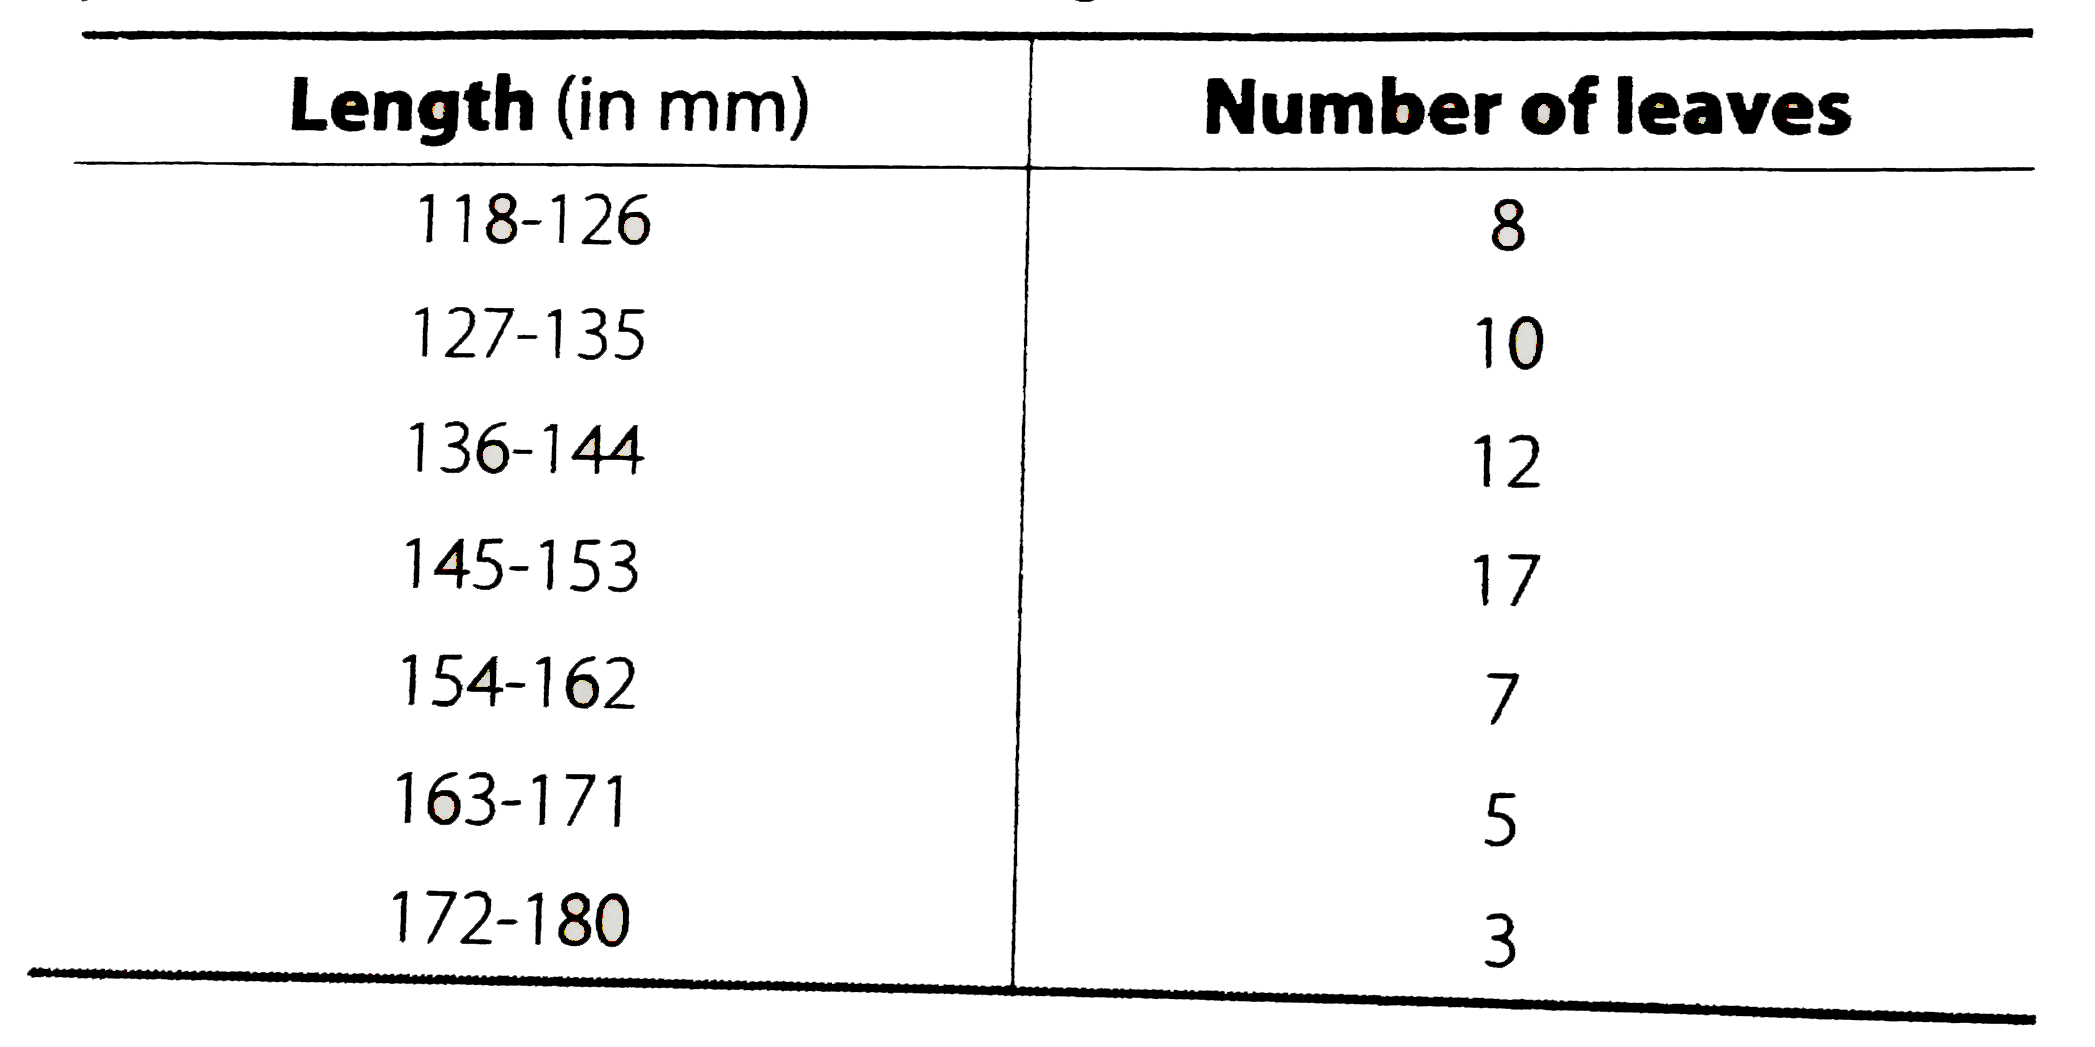
Draw a histrogram to represent the data above.View SolutionThe length of 40 leaves of a plant are measured correct to one millimetre, and the obtained data is represented in the following table:
Draw a histogram to represent the given data. [Hint: First make the class intervals continuous]View SolutionThe length of 40 leaves of a plant measured correct to one millimetre and the obtained data is represented in the following table:

(i) Draw a histogram to represent the given data.
(ii) Is there any other suitable graphical representation for the same data?
(iii) Is it correct to conclude that the maximum number of leaves 153 mm long and why?View SolutionThe length of 40 leaves of a plant are measured correct to one millimeter, and the obtained data is represented in the following table:
(i) Draw a histogram to represent the given data.
(ii) Is there any other suitable graphical representation for the same data?
(iii) Is it correct to conclude that the maximum number of leaves are 153 mm long?Why?View SolutionDraw a histogram to represent the following data.
 View Solution
Draw the histogram to represent the following data.
 View Solution
Draw a histogram to represent the following:
 View Solution
The length of 40 leaves of a plant are measured correct to one millimetre, and the obtained data is represented in the following table:
Is there any other suitable graphical representation for the same data?View SolutionThe length of 40 leaves of a plant are measured correct to nearest millimetres. The data obtained is as follows :

Draw histogram to represent the given data.View SolutionThe length of 40 leaves of a plant are measured correct to one millimetre, and the obtained data is represented in the following table:
Is it correct to conclude that the maximum number of leaves are 153 mm long? Why?View Solution

