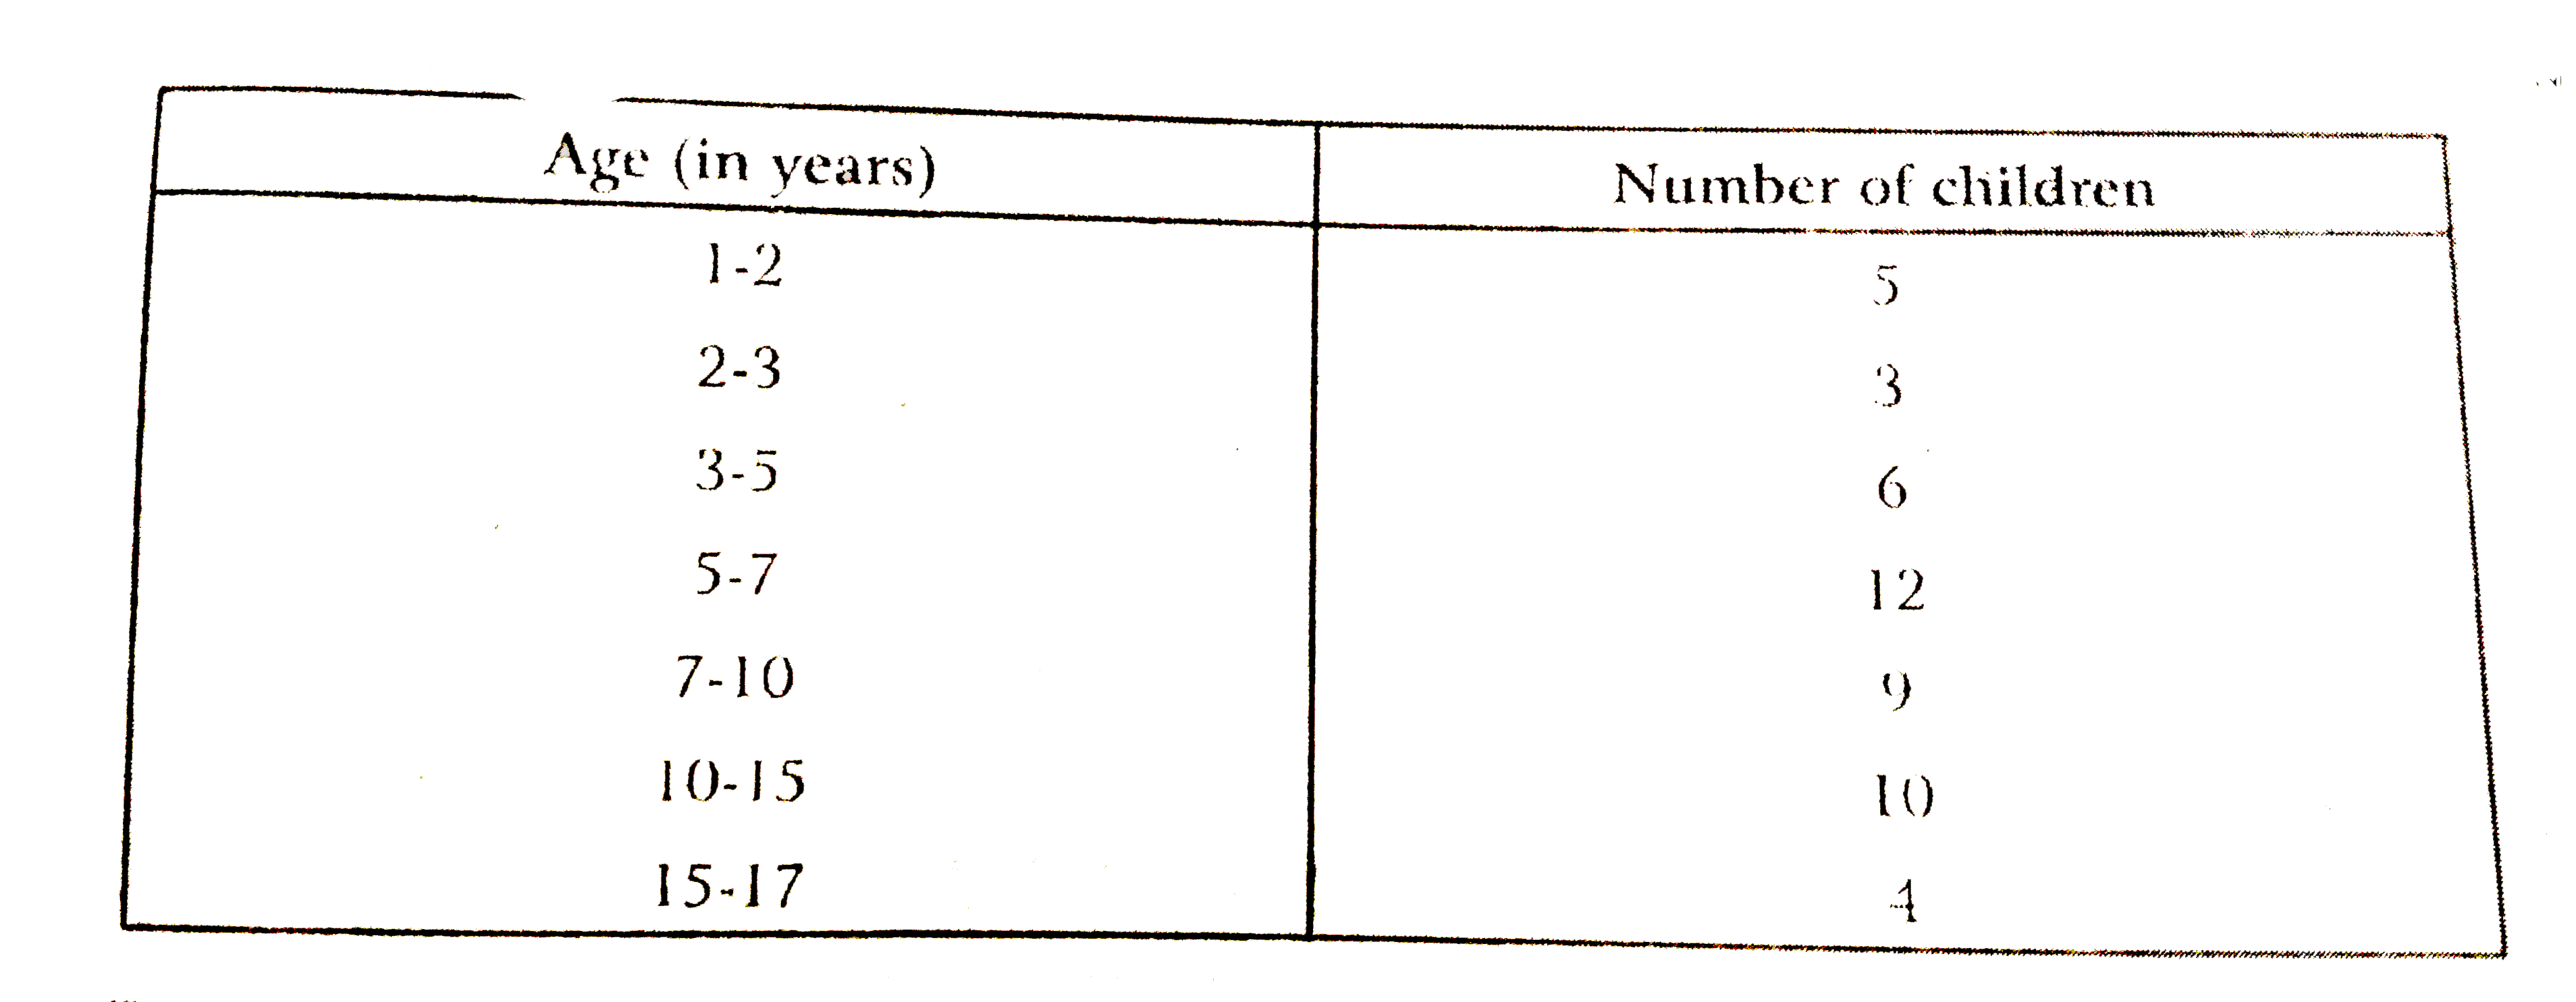
A random survey of the number of children of various age groups playing in a park was found as follows:

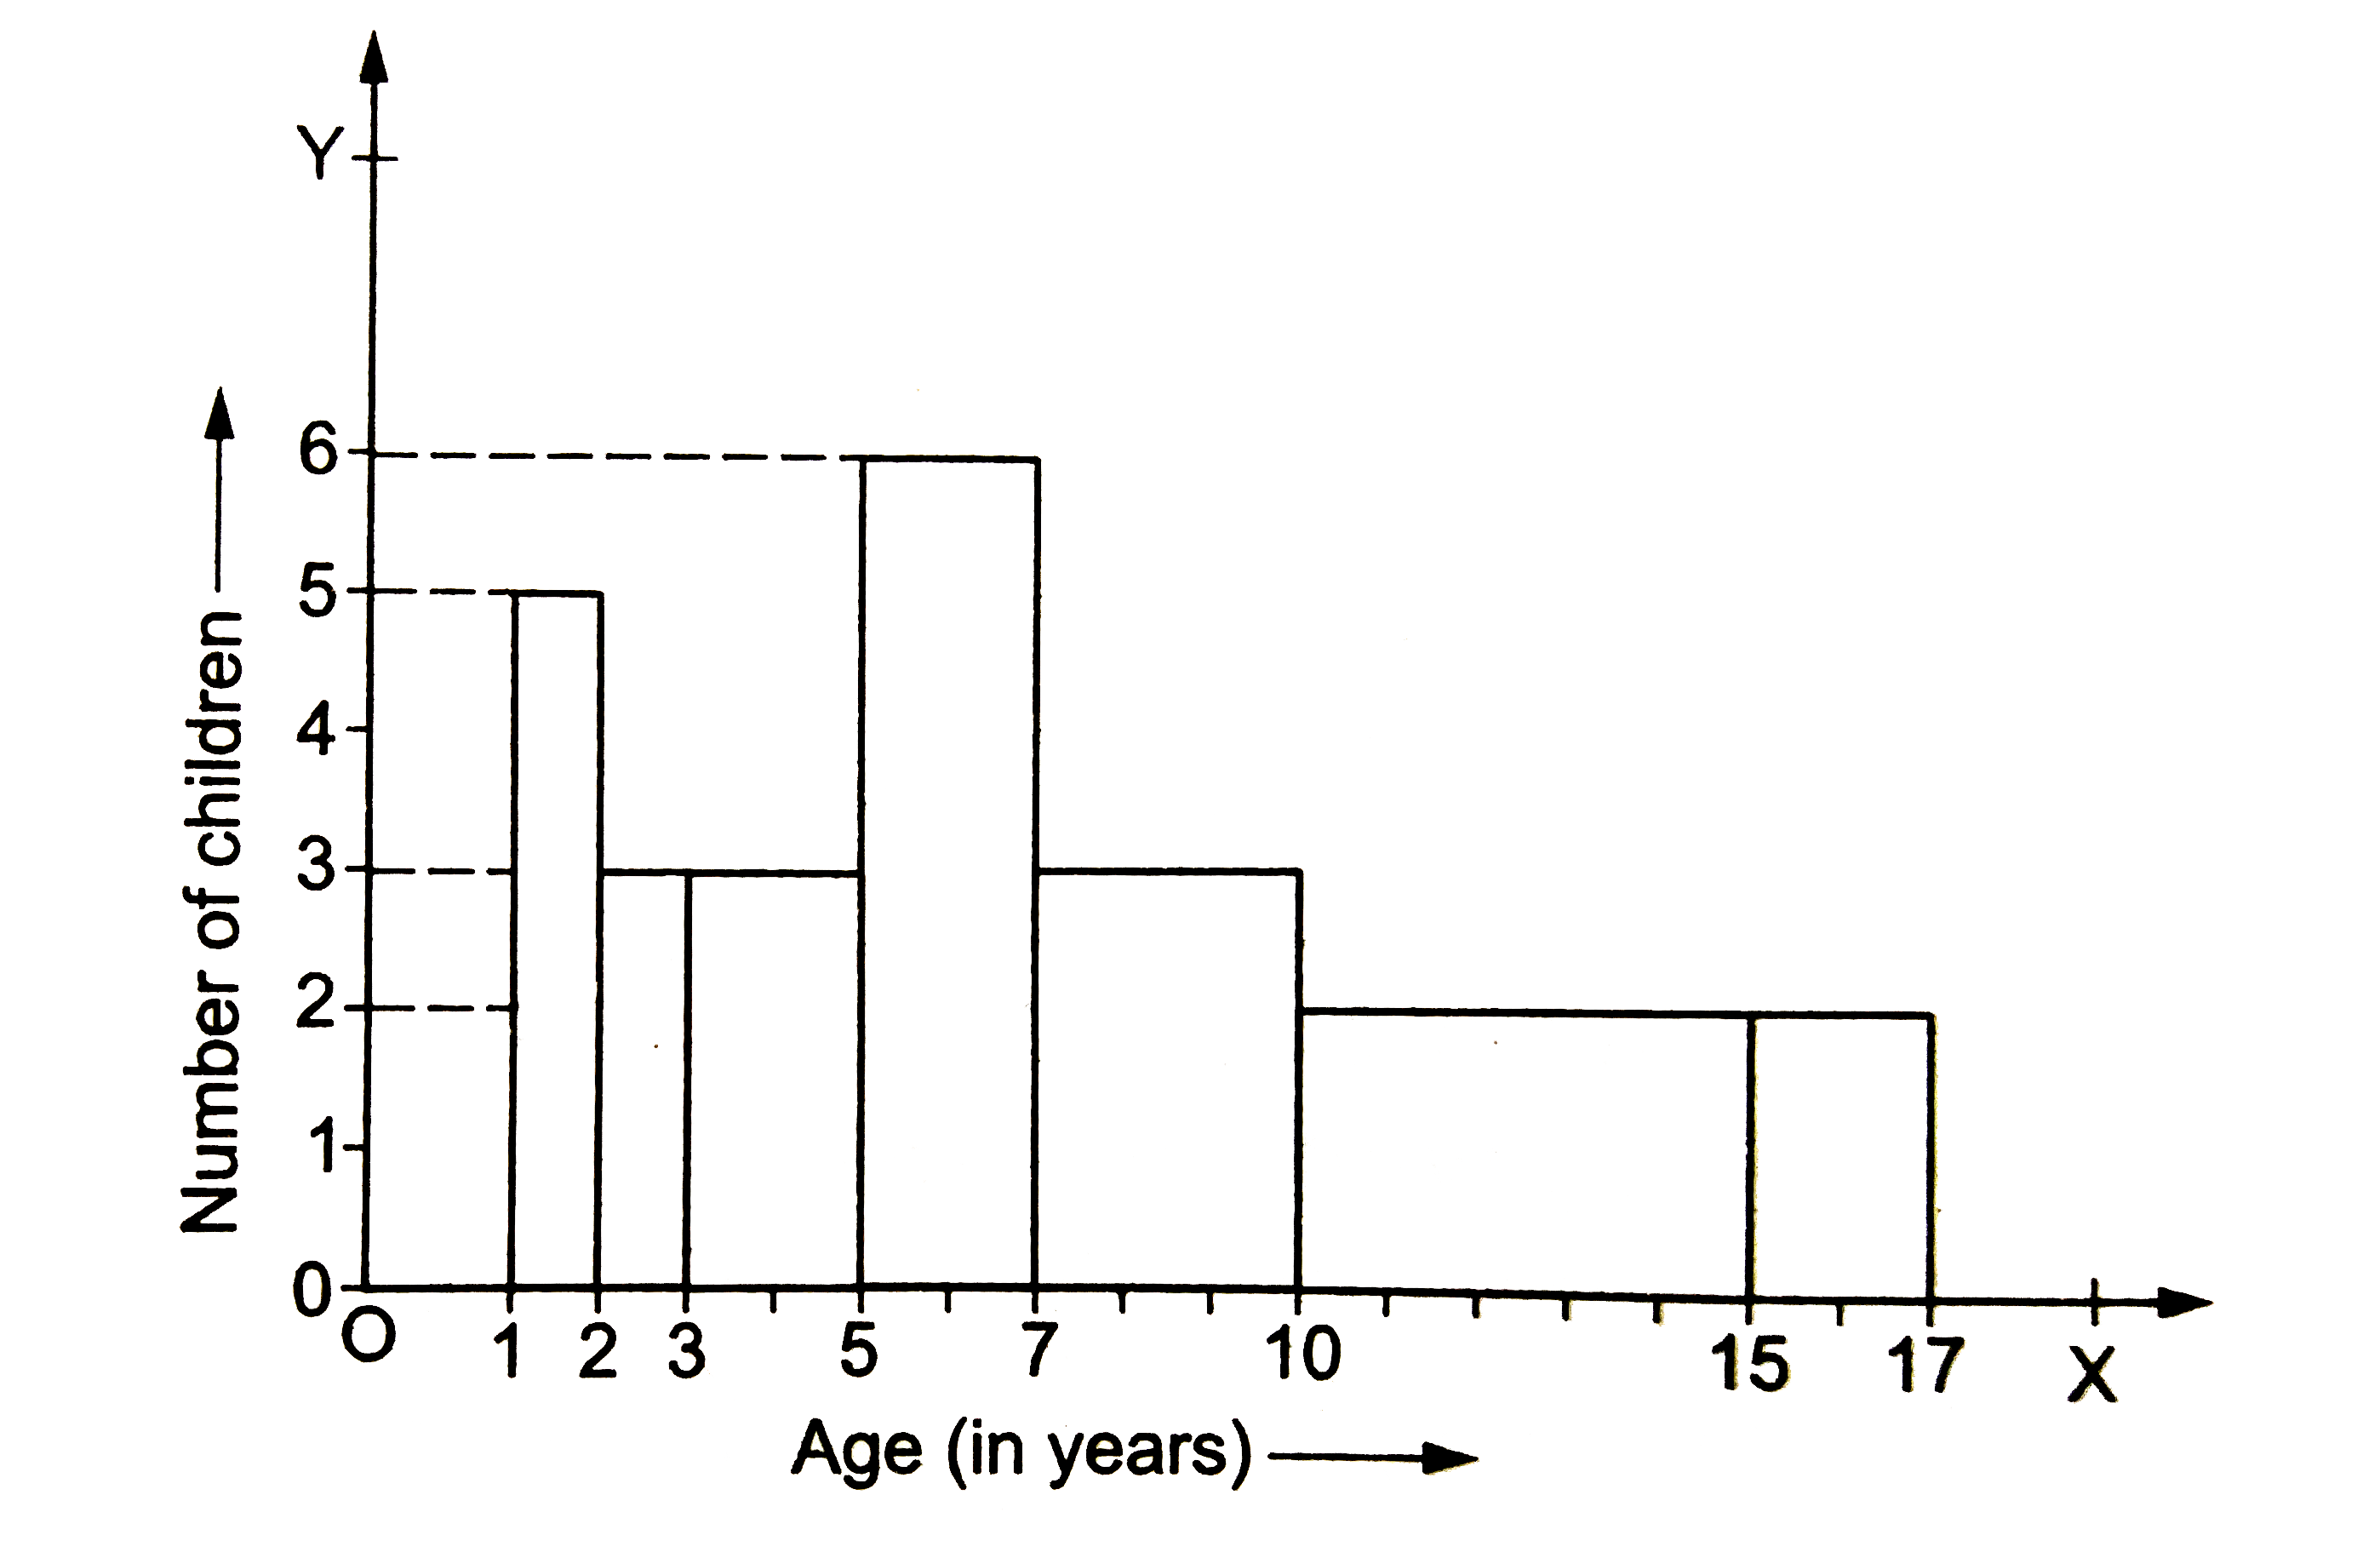
Draw a histogram to represent the above given data.
In the given frequency distribution, the class intervals are not of equal width. So, we would make modifications in the heights of the rectangles in the histogram in such a way that the areas of the rectangles are proportional to the frequencies.
Here, minimum class size
height of the rectangle for a given class interval
For example, the height of the rectangle for is
The height of the rectangle for 7-10 is , etc.
Thus, we have
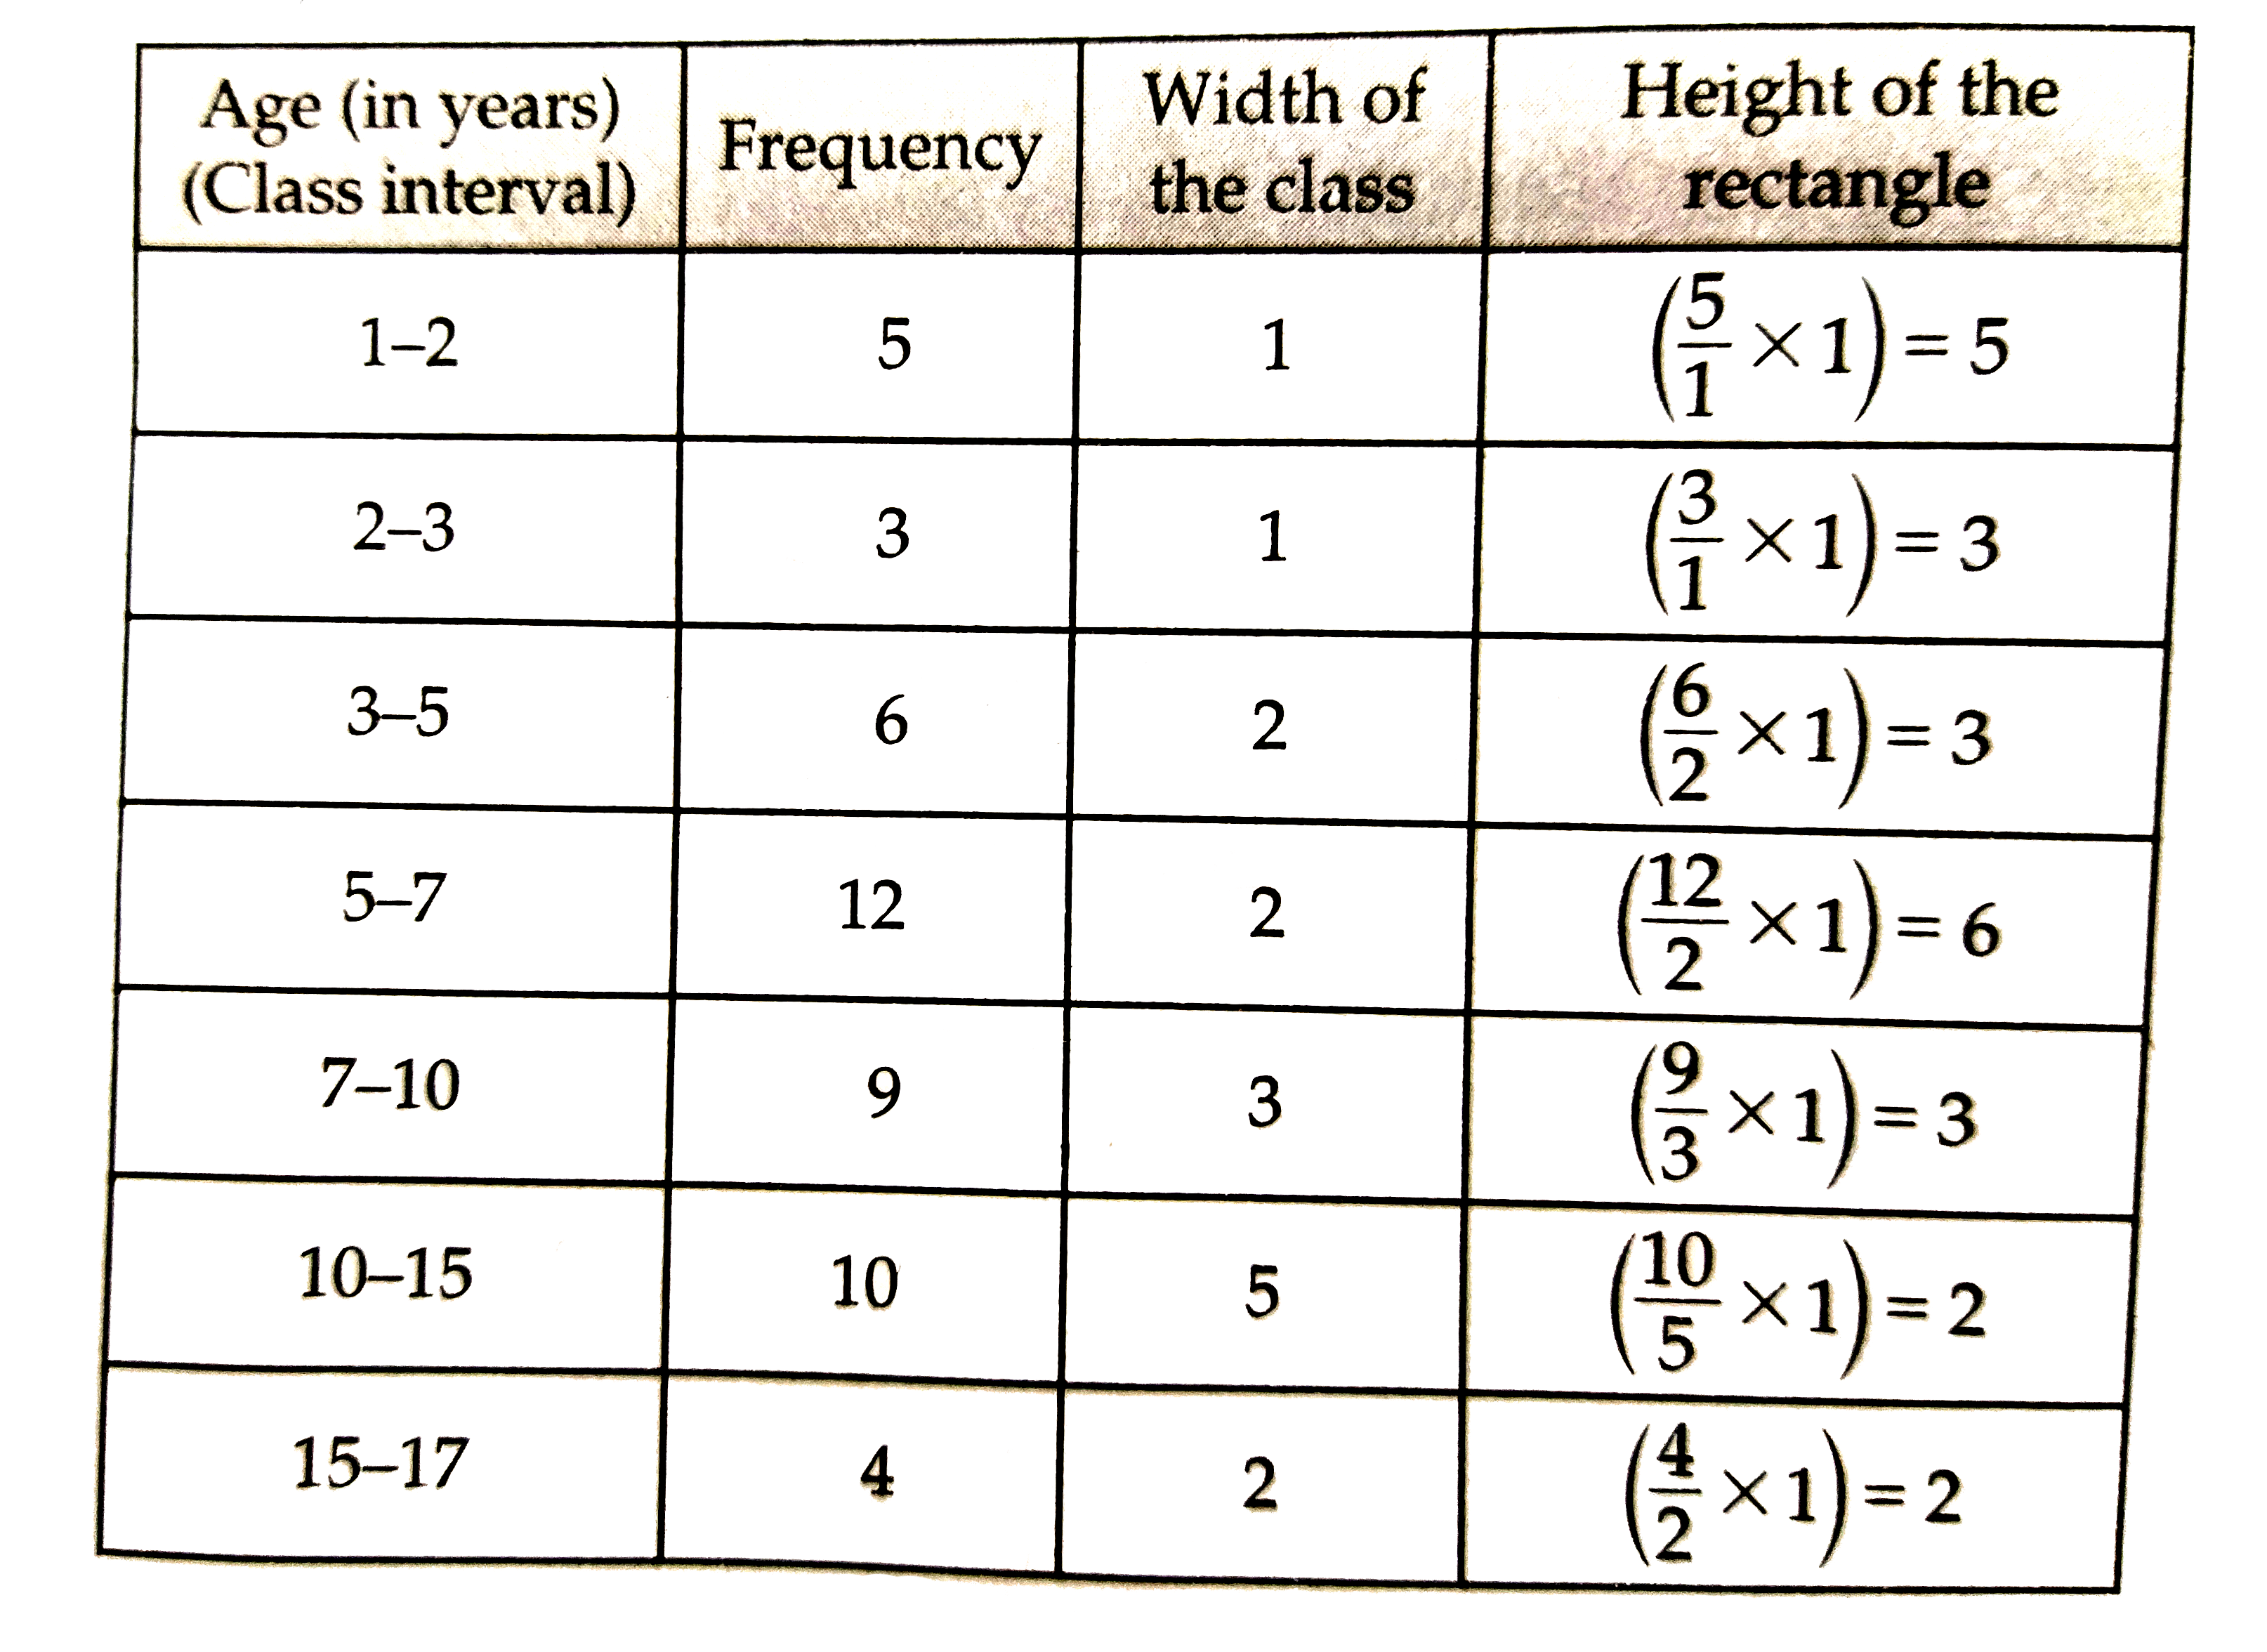
Now, we draw rectangles with given class intervals along the -axis on a suitable scale and their corresponding heights along the -axis on another suitable scale. Thus, we obtain the histogram of the given data, as shown below.
Topper's Solved these Questions
- BOOK - RS AGGARWALCHAPTER - BAR GRAPH, HISTOGRAM AND FREQUENCY POLYGONEXERCISE - EXERCISE 17A12videos
BAR GRAPH, HISTOGRAM AND FREQUENCY POLYGON
- BOOK - RS AGGARWALCHAPTER - BAR GRAPH, HISTOGRAM AND FREQUENCY POLYGONEXERCISE - EXERCISE 17B16videos
BAR GRAPH, HISTOGRAM AND FREQUENCY POLYGON
- BOOK - RS AGGARWALCHAPTER - BAR GRAPH, HISTOGRAM AND FREQUENCY POLYGONEXERCISE - EXERCISE 17B16videos
BAR GRAPH, HISTOGRAM AND FREQUENCY POLYGON
- BOOK - RS AGGARWALCHAPTER - AREAS OF TRIANGLES AND QUADRILATERALSEXERCISE - Multiple Choice Questions (Mcq)16videos
AREAS OF TRIANGLES AND QUADRILATERALS
- BOOK - RS AGGARWALCHAPTER - CIRCLES EXERCISE - MULTIPLE CHOICE QUESTION(MCQ)37videos
CIRCLES
Similar Questions
A random survey of the number of children of various age groups playing in a park was found as following Draw a histogram to represent
View SolutionA random survey of the number of children of various are groups playing in park was found as follows :
Draw a histogram to represent the data above.View SolutionDraw a histogram to represent the following data.
 View Solution
Draw the histogram to represent the following data.
 View Solution
Number of mobile phone users in various age groups in a city is listed below:
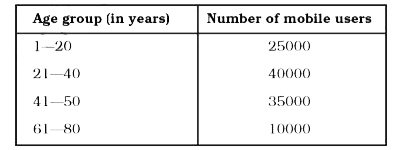
Draw a bar graph to represent the above information.View Solution100 surnames were randomly picked up for a test and fequency distribution of the number of letters in the English alphabet in the surnames was found as follows :
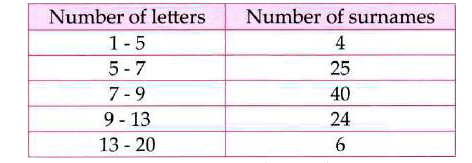
Draw a histogram to depict the given informationView SolutionIn a class of 40 students, the marks obtained (out of 50) are as given below:

Draw a histogram to represent the given data.View SolutionThe tatste of 500 people of a sociaety for different type of food was recorded as follows :

Draw a pie diagram to represent the above data.View SolutionThe given table presents the number of illiterate males in the age group (10-34) in a town.

Draw a histogram to represent the above data.View SolutionIn a botanical garden, the number of different types of plants are found as follows:
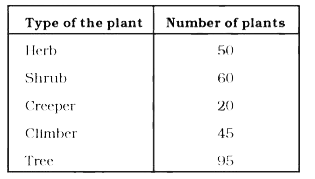
Draw a bar graph to represent the above information and answer the following question:
Which type of plant is maximum in number in the garden?View Solution

