The daily pocket expenses of 150 students in a school are given below:

Construct a frequency polygon representing the above data.
We take two imagined classes, namely 40−50 and 120−130 , each with frequency 0.
Now, we have the following frequency table:
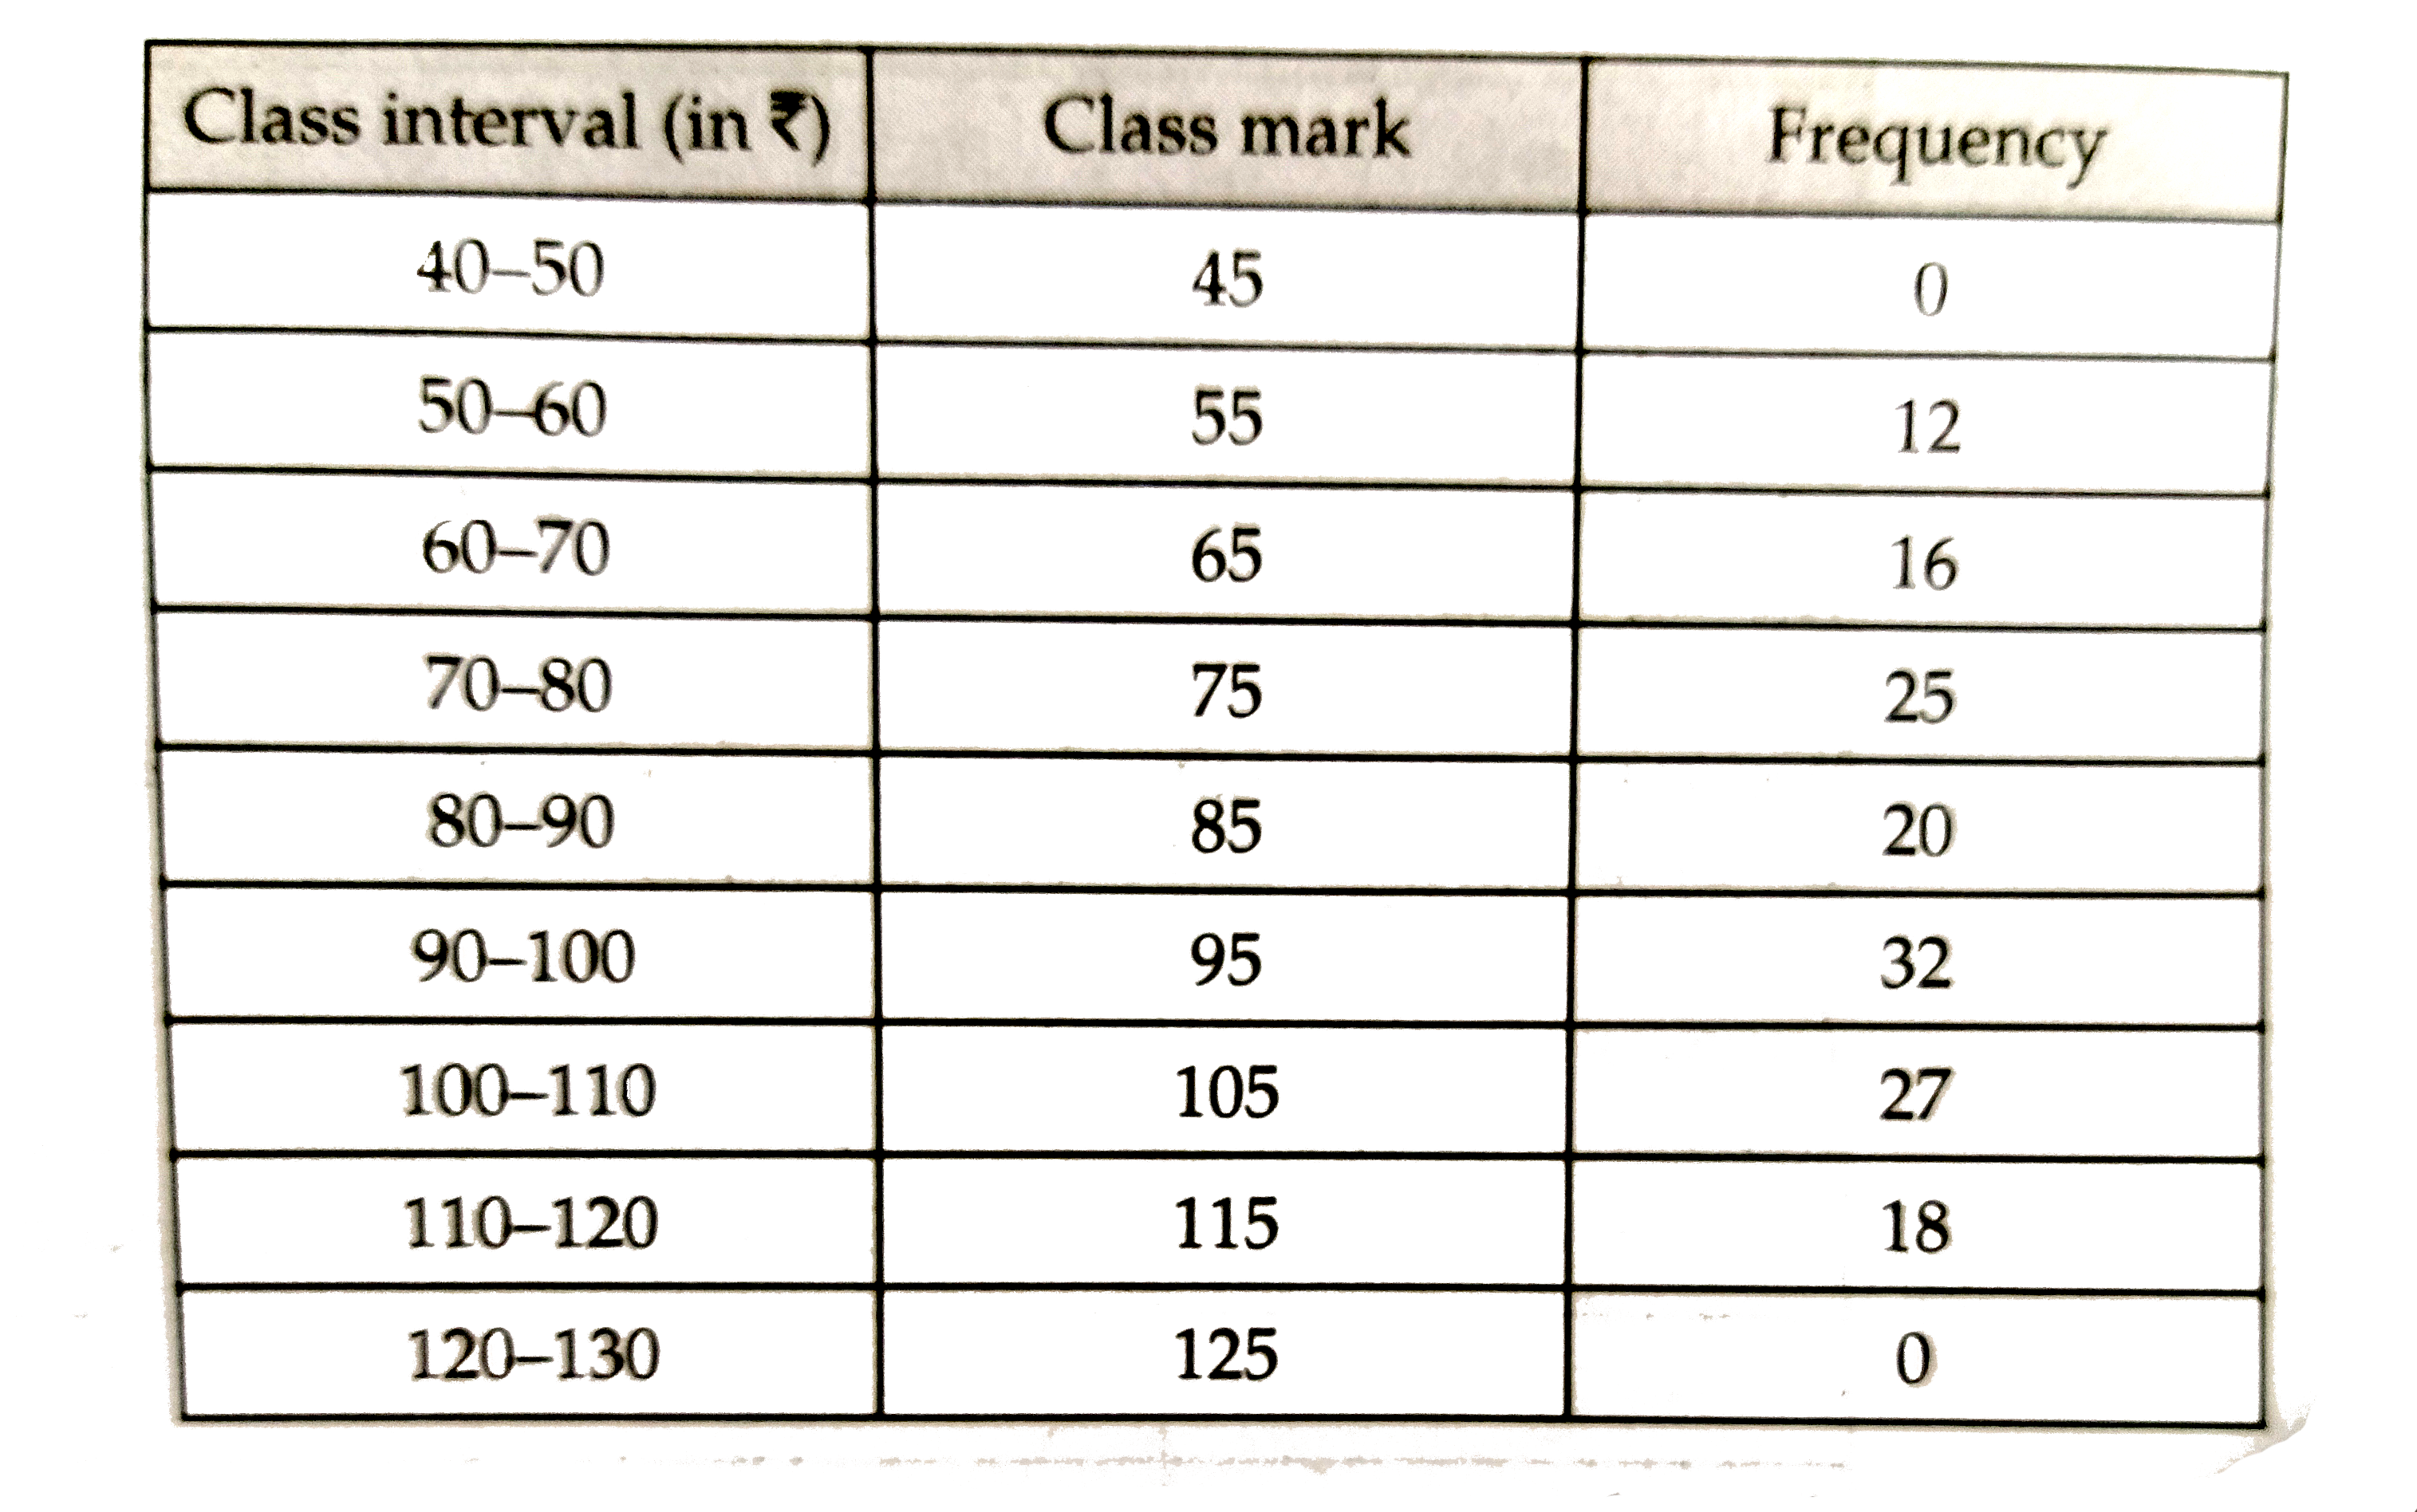
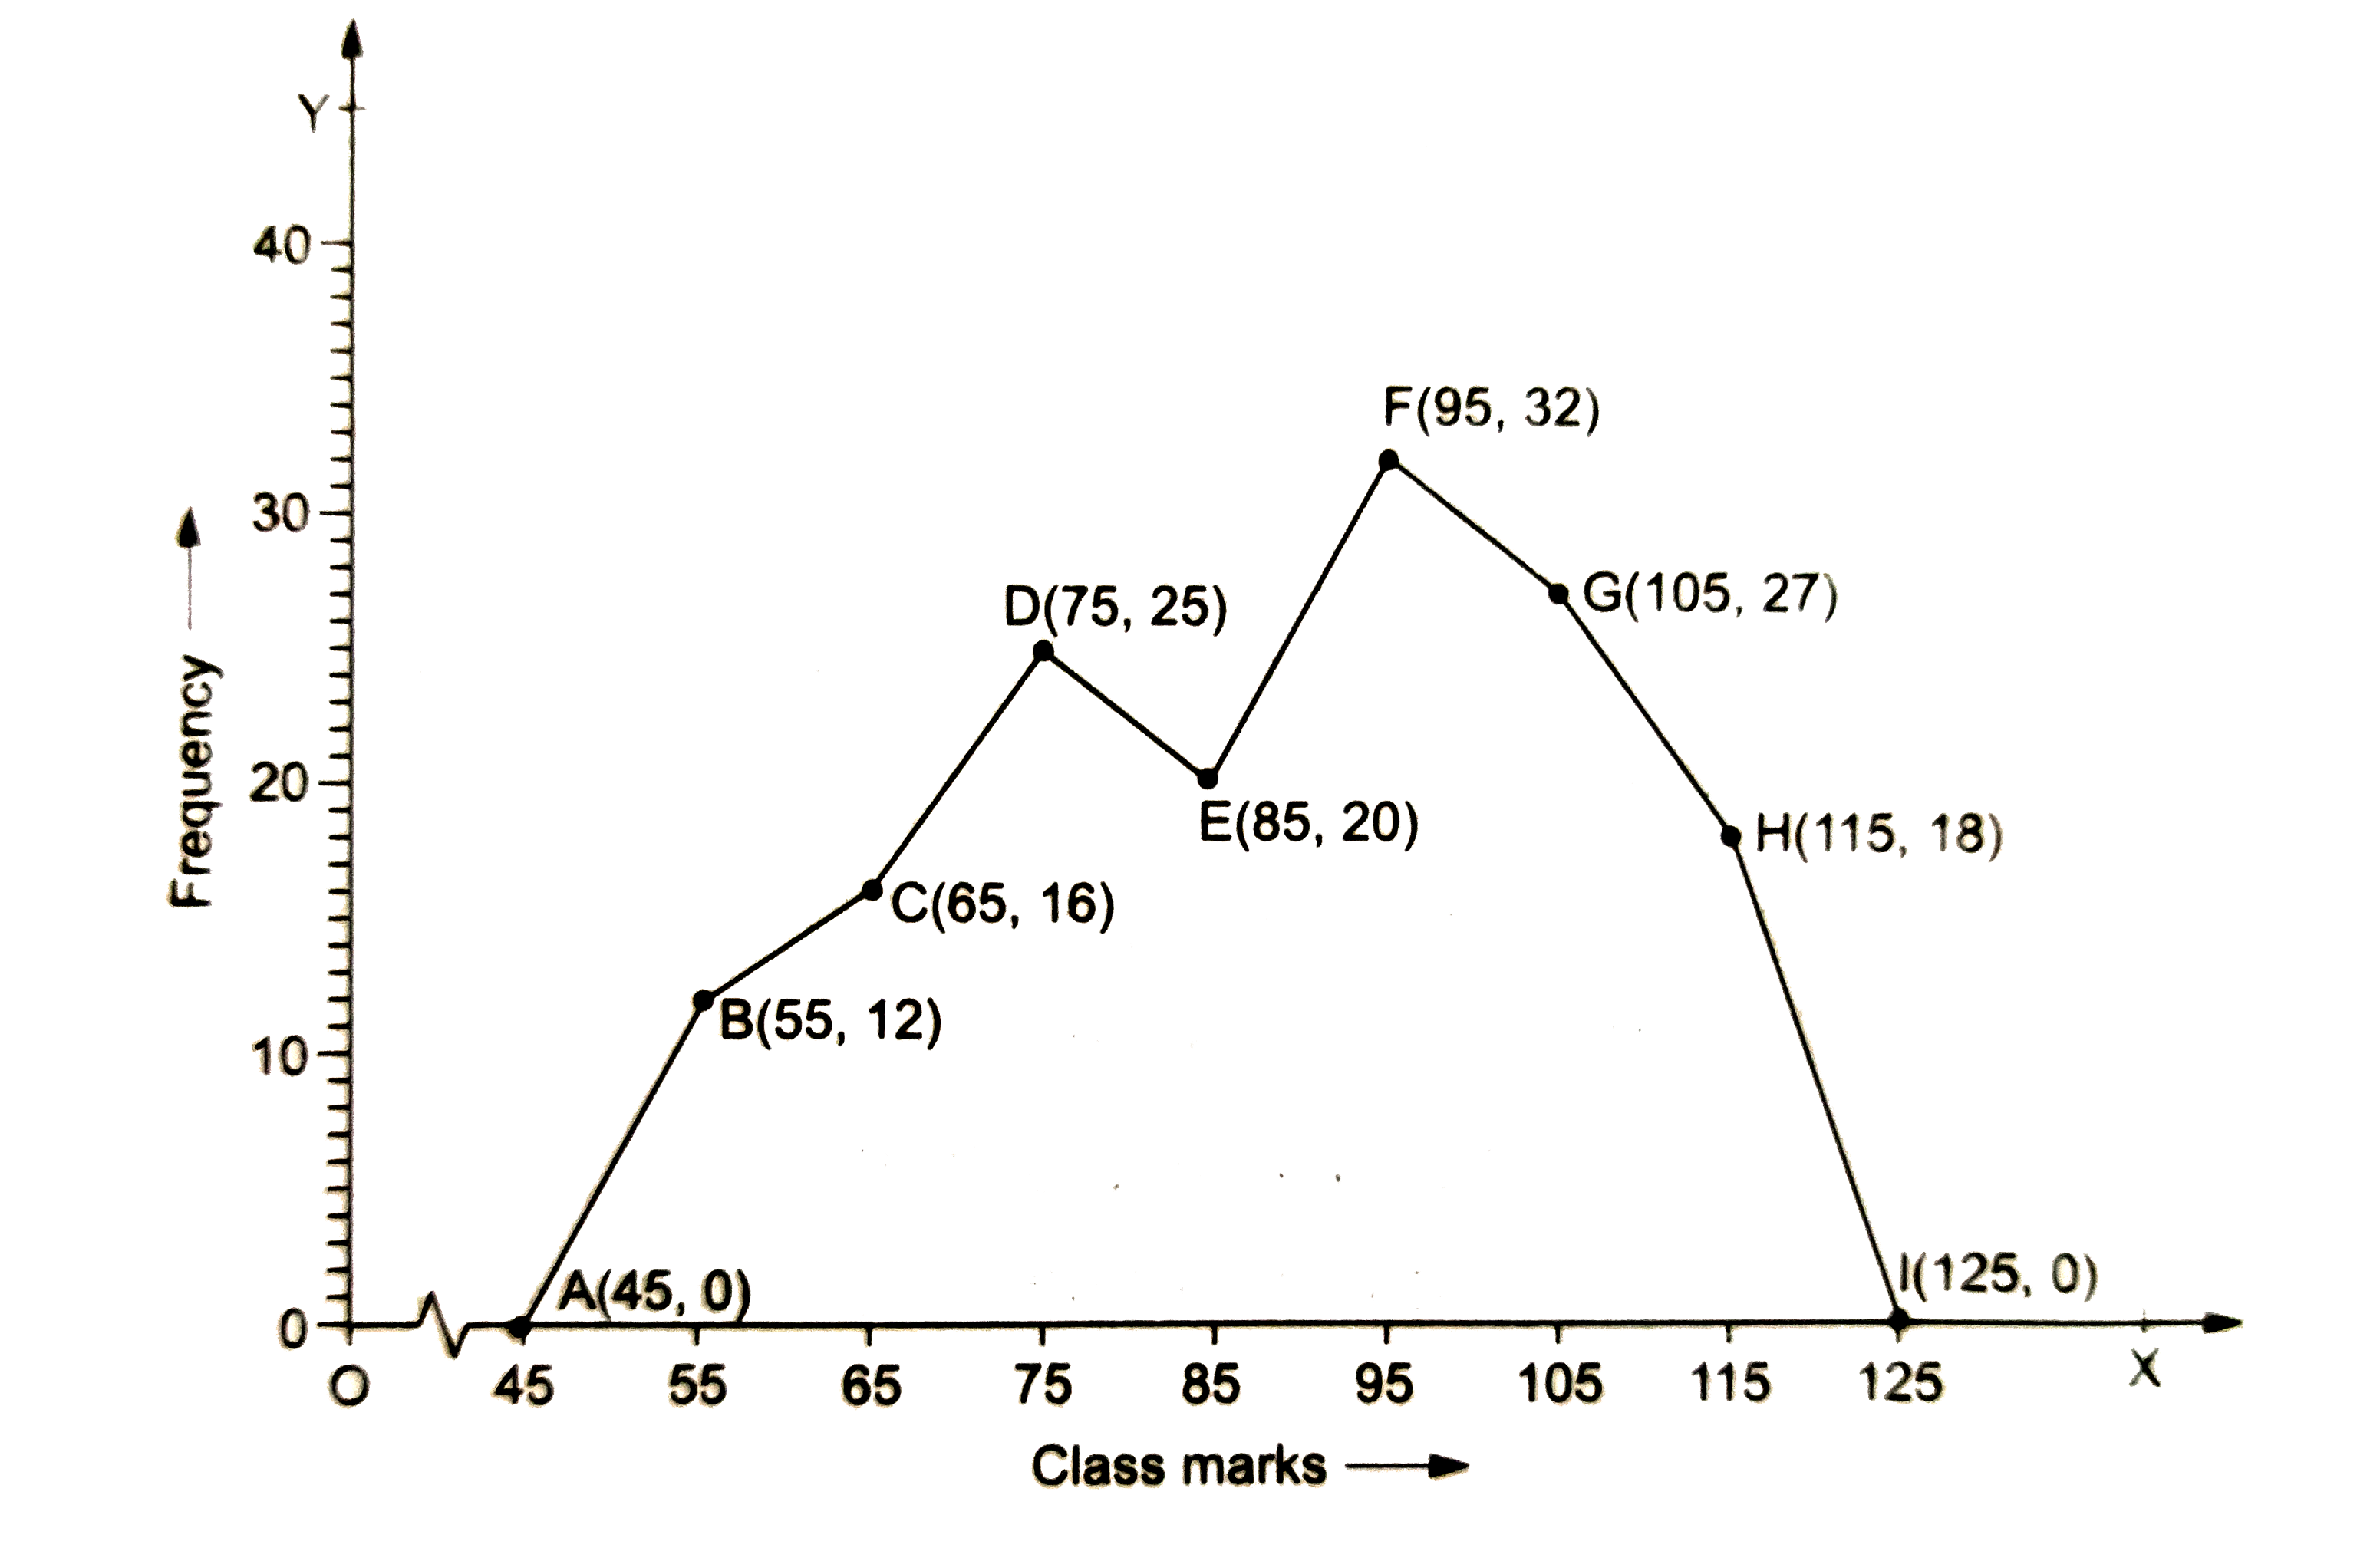
Taking suitable scale along the x-axis and another along the y-axis, we plot the following points:
A(45,0),B(55,12),C(65,16),D(75,25),E(85,20),F(95,32),G(105,27),H(115,18) and I(125,0).
Join these points successively in pairs to get the required frequency polygon ABCDEFGHI, as shown below.
Topper's Solved these Questions
- BOOK - RS AGGARWALCHAPTER - BAR GRAPH, HISTOGRAM AND FREQUENCY POLYGONEXERCISE - EXERCISE 17A12videos
BAR GRAPH, HISTOGRAM AND FREQUENCY POLYGON
- BOOK - RS AGGARWALCHAPTER - BAR GRAPH, HISTOGRAM AND FREQUENCY POLYGONEXERCISE - EXERCISE 17B16videos
BAR GRAPH, HISTOGRAM AND FREQUENCY POLYGON
- BOOK - RS AGGARWALCHAPTER - BAR GRAPH, HISTOGRAM AND FREQUENCY POLYGONEXERCISE - EXERCISE 17B16videos
BAR GRAPH, HISTOGRAM AND FREQUENCY POLYGON
- BOOK - RS AGGARWALCHAPTER - AREAS OF TRIANGLES AND QUADRILATERALSEXERCISE - Multiple Choice Questions (Mcq)16videos
AREAS OF TRIANGLES AND QUADRILATERALS
- BOOK - RS AGGARWALCHAPTER - CIRCLES EXERCISE - MULTIPLE CHOICE QUESTION(MCQ)37videos
CIRCLES
Similar Questions
The daily pocket expenses of 206 students in a school are given below.

Construct a frequency polygon representing the above data.View SolutionThe daily pocket expenses of 206 students in a school are given below.

Construct a frequency polygon representing the above data.View SolutionDraw a frequency polygon to represent the following data.
 View Solution
Draw the frequency polygon to represent the following data.
 View Solution
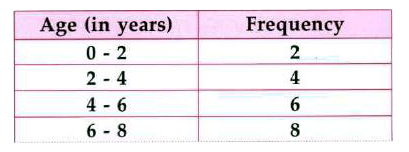
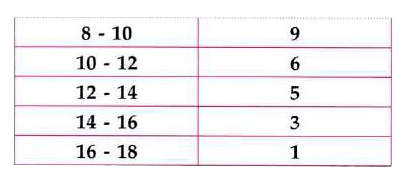
Construct a frequency polygon for the following data.
 View Solution
Construct the frequency polygon for the following data:
 View Solution
70 students from a locality use different modes of transport to go to school as given below:
 Draw the bar graph representing the above data.View Solution
70 students from a locality use different modes of transport to go to school as given below:

Draw the bar graph representing the above data.View SolutionMake a frequency polygon and histogram using the given data :
 View Solution
The weights of 20 students in a class are given below.
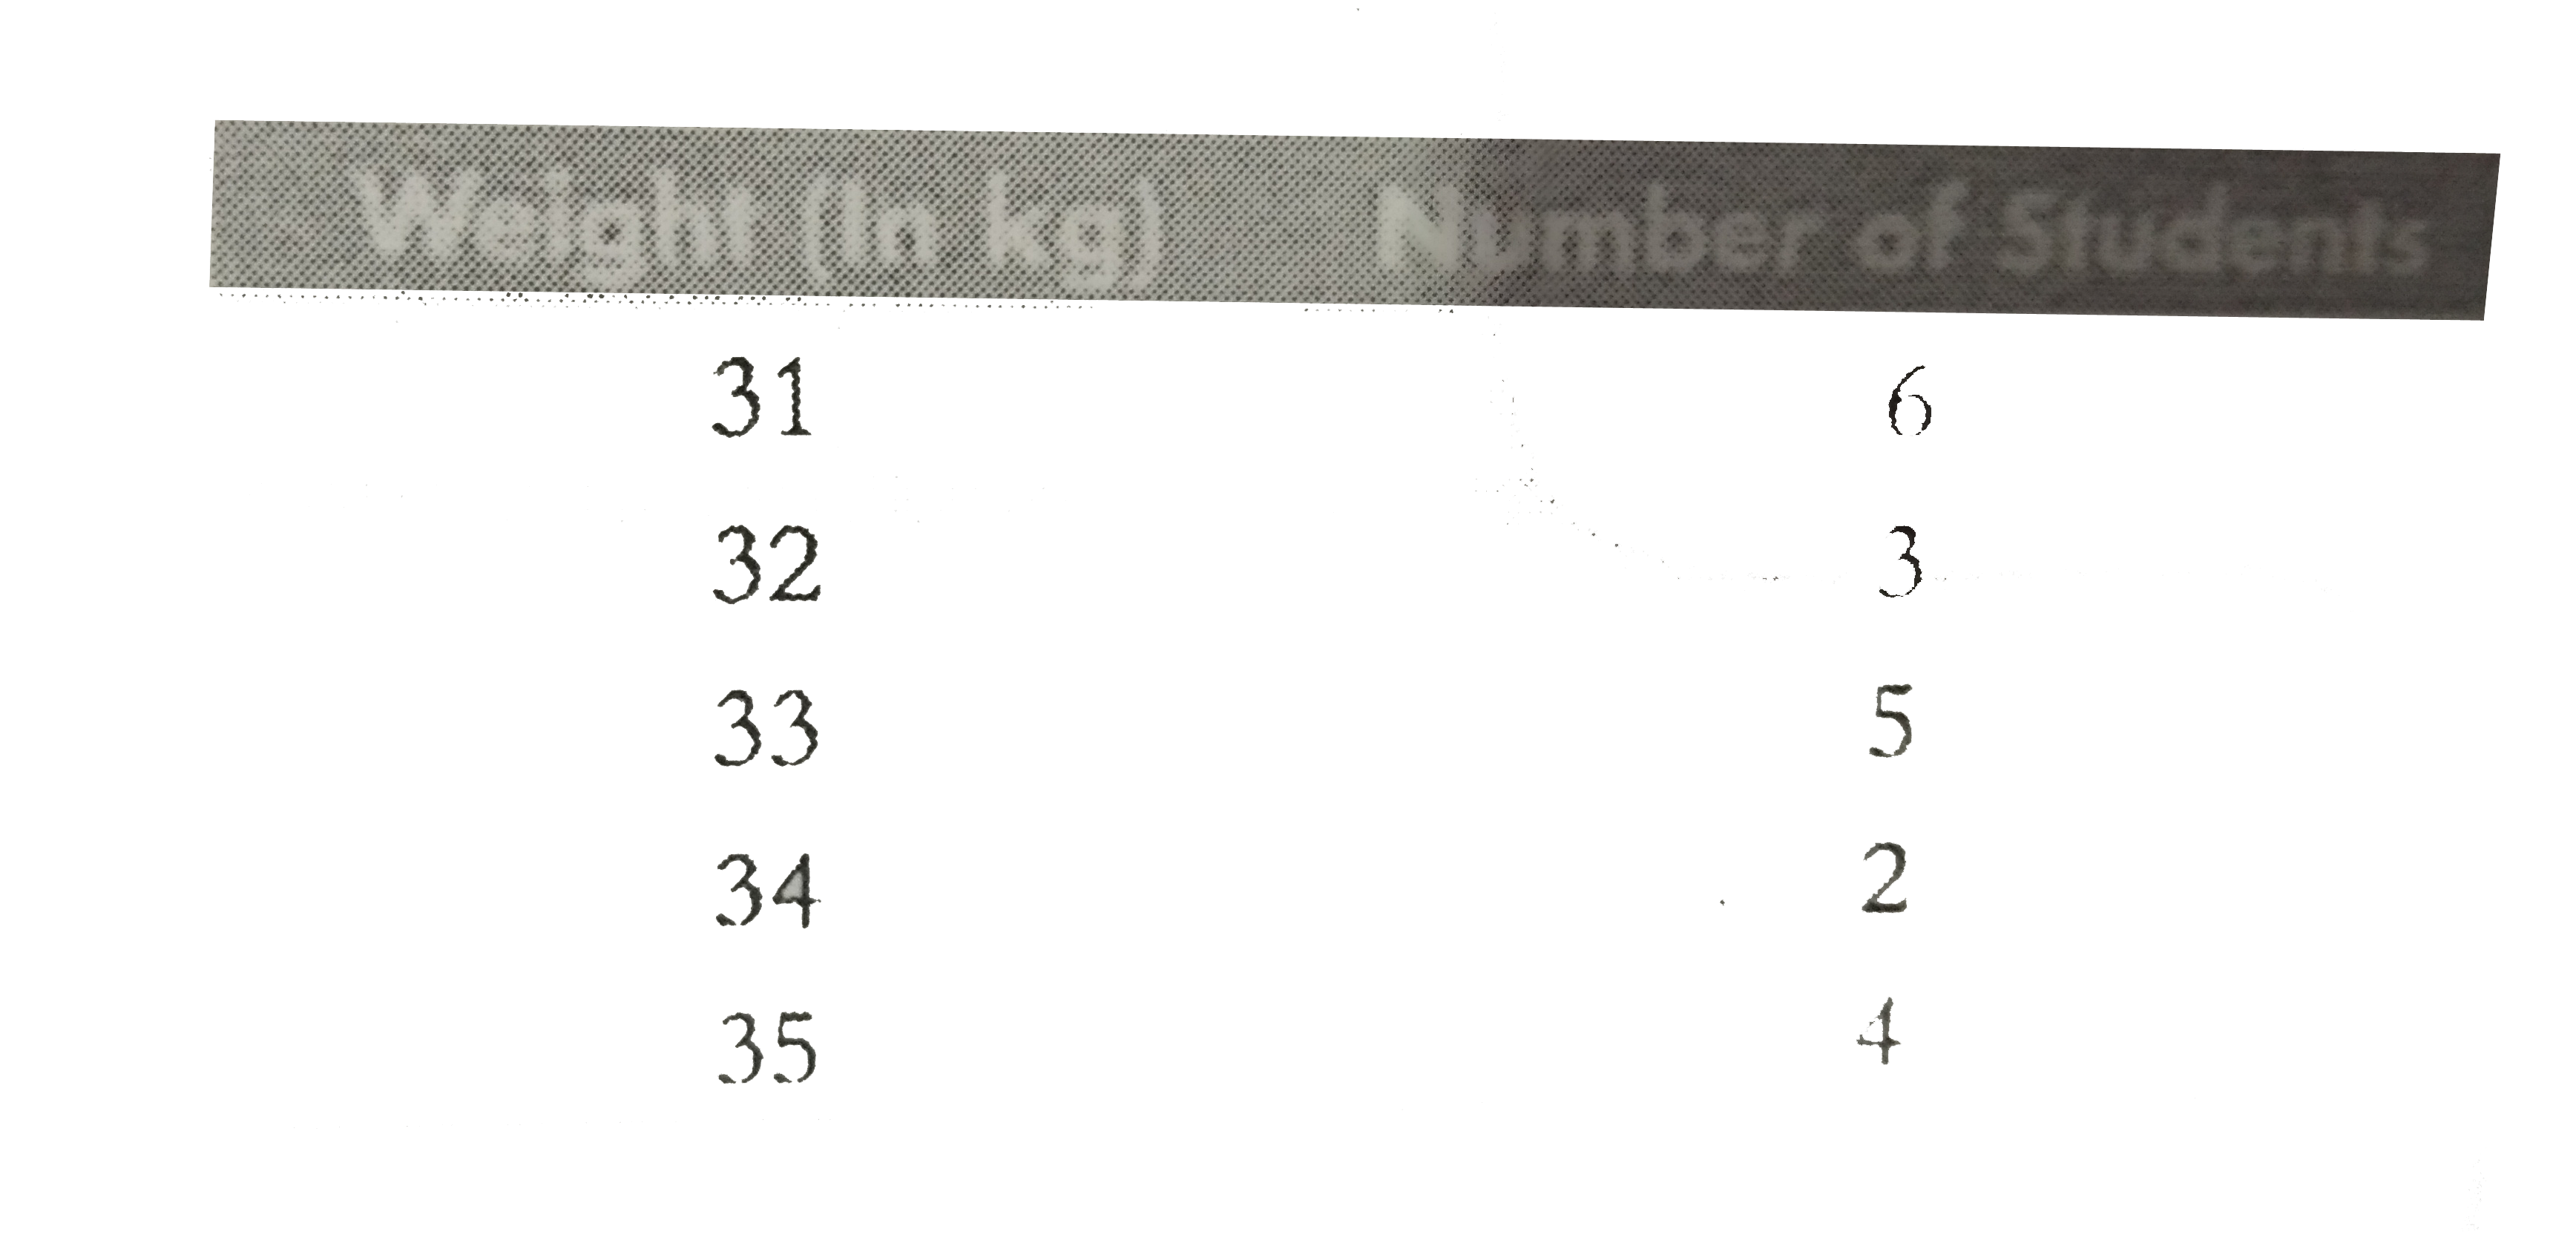
Find the median of the above frequency distribution .View Solution

