Example from RS AGGARWAL MATHS (HINGLISH) LINE GRAPHS AND LINEAR GRAPHS for Class 8
| Class 8 | MATHS |
| Chapter | LINE GRAPHS AND LINEAR GRAPHS |
| RS AGGARWAL MATHS (HINGLISH) | Example |
| Medium | English |
| Academic Year | 2023-2024 |
Question 1
The following table gives the growth chart of a child.

Draw a line graph for the above data and answer the questions that follow :
(i) What was the height of the child at the age of 5 years ?
(ii) How much taller was the child at the age of 10 than at the age of 6 ?
(iii) Between which two consecutive periods did the child grow faster ?View SolutionQuestion 2
The table given below shows the data collected for Tanvy's walking on a road.

Draw a line graph for the given data using a suitable scale and answer the questions given below :
(i) In what time periods did Tanvy make the most progress ?
(ii) What is the ratio of the total distance covered in 15 minutes to that covered in 25 minutes ?
(iii) What is the percentage increase in distance covered in 15 minutes as compared to that in 10 minutes ?View SolutionQuestion 3
The table given below shows the population (in thousands) of men and women in a village in different years.

Draw two line graphs for the above data, using a suitable scale and answer the questions given below :
(i) Find the ratio of the male population and female population in the year 2013.
(ii) Find the ratio of the total population of the village in 2015 to that in 2017.
(iii) Find the percentage increase in the population of women in 2017 as compared to that in 2014
(iv) Between which two years in the increase % in the number of men maximum?View SolutionQuestion 4
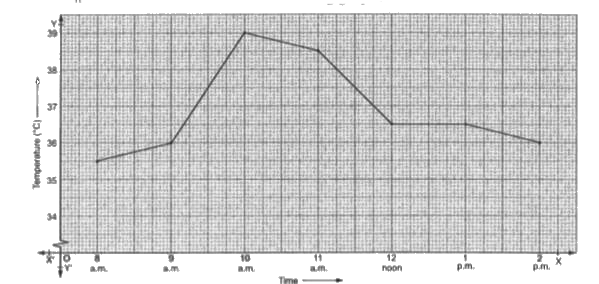
When Reenu fell sick, her doctor maintained a record of her body temperature taken every hour, as shown in the following graph.

Read the graph carefully and answer the questions given below :
(i) What was the patient's temperature at 12 noon ?
(ii) When was the patient's temperature 38.5∘C ?
(iii) What was the patient's temperature at 12.30 p.m. ? Why ?
(iv) During which period of time did the patient's temperature show an upward trend ?
(v) The patient's temperature was the same two times during the given period. What were these two times ? View SolutionQuestion 5
The graph given below shows the journey of a man who started from his home and returned at the end of the day. Study the graph carefully and answer the questions that follow.

(i) At what time did the man start from his home ?
(ii) How much distance did he cover in the first four hours of his journey ?
(iii) What was he doing from 3 p.m. to 5 p.m. ?
(iv) What was the total distance travelled by him during the day ?
(v) How much distance did he travel in the first 8 hours of his journey ?
(vi) By what time could he cover 16 km of his journey ?
(vii) At what time did he return home ?
(viii) Calculate the average speed of the man from (a) A to B and (b) B to C . View SolutionQuestion 6
The double line graph given below gives the actual and expected sales of cars of a company for six months. Study the graph and answer the questions that follow :

(i) In which month was the actual sale same as the expected sale ?
(ii) For which month was the difference between the actual and expected sales the maximum ?
(iii) For which month was the difference in actual and expected sales the least ?
(iv) What was the total sales of cars in the months of January. February and March ?
(v) What is the average sales of cars in the last 3 months ?
(vi) Find the ratio of sales in the first 3 months to that in the last 3 month? View SolutionQuestion 7
The double line graph given below shows the marks obtained out of 10 by Madhu in two different tests. Study the graph and answer the questions that follow :

(i) What information is represented by the axes ?
(ii) In which subject did she score the highest in Test I ?
(iii) In which subject did she score the least in Test II ?
(iv) What are the marks scored by her in social science in Test II ?
(v) In which test was the performance better ?
(vi) In which subject and which test did she score full marks ?View SolutionQuestion 8
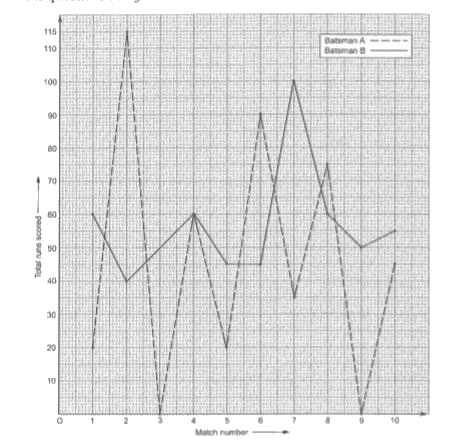
The given graph represents the total runs scored by two batsmen A and B durin each of the ten different matches in the year 2017. Study the graph and answer the questions that follow :

(i) What information is given on the two axes in the given graph ?
(ii) In which two matches did batsman B score the same number of runs ?
(iii) Were the runds scored by the two batsmen same in any of the matches ? If so , in which match?
(iv) Among the two batsmen, who is steadier ? How do you judge it ?View Solution

