The table given below shows the data collected for Tanvy's walking on a road.

Draw a line graph for the given data using a suitable scale and answer the questions given below :
(i) In what time periods did Tanvy make the most progress ?
(ii) What is the ratio of the total distance covered in 15 minutes to that covered in 25 minutes ?
(iii) What is the percentage increase in distance covered in 15 minutes as compared to that in 10 minutes ?
Step by step video & image solution for The table given below shows the data collected for Tanvy's walking on a road. Draw a line graph for the given data using a suitable scale and answer the questions given below : (i) In what time periods did Tanvy make the most progress ? (ii) What is the ratio of the total distance covered in 15 minutes to that covered in 25 minutes ? (iii) What is the percentage increase in distance covered in 15 minutes as compared to that in 10 minutes ? by Maths experts to help you in doubts & scoring excellent marks in Class 8 exams.
Updated on:21/07/2023Topper's Solved these Questions
- LINE GRAPHS AND LINEAR GRAPHSBOOK - RS AGGARWALCHAPTER - LINE GRAPHS AND LINEAR GRAPHSEXERCISE - Exercise 23
25 Videos
- INTRODUCTION TO COORDINATE GEOMETRYBOOK - RS AGGARWALCHAPTER - INTRODUCTION TO COORDINATE GEOMETRYEXERCISE - EXERCISE B (OBJECTIVE QUESTIONS)
7 Videos
- LINEAR EQUATIONSBOOK - RS AGGARWALCHAPTER - LINEAR EQUATIONSEXERCISE - TEST PAPER-8 (D) (Write .T. for true and .F. for false for each of the following:)
1 Videos
Similar Questions
Knowledge Check
If a distance of 50m is covered in 1 minute, that 90m in 2 minutes and 130m in 3 minutes find the distance covered in 15 minutes.
A610mB750mC1000mD650mRefer the following data table and answer the question.

What is the ratio of boys to girls?A26:37B39:28C28:39D37:26
Draw a pictograph to represent the data given below :

View SolutionStudy the following table carefully to answer the questions given below.

What is the difference A' s and C's total marks in the exam ?
View SolutionGiven below is the data of school going students (boys and girls):

Draw the bar graph to represent the above data.
View SolutionDraw a Lorenz curve of the data given below:

View SolutionA truck covers a distance of 550 metres in 1 minute whereas a bus covers a distance of 33 km in 45 minutes. What is the ratio of their speeds.
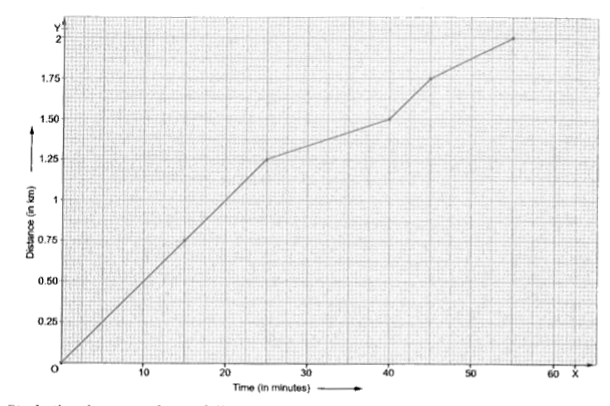
View SolutionThe following is the distance -time graph of Amit's walking.

Study the above graph carefully and answer the questions given below :
(i) When does Amit make the least progress ? Explain your answer.
(ii) Find his average speed in km/hr.
View Solution


