The parabola is a graph of speed v as a function of time t for an object. Which of the following graphs best represents the magnitude F of the net force exerted on the object as a function of time t?
Correct option As v is proportional to t2 and a is proportional to ∆v/t this means a should be proportional to t
Related Solutions
The graph shown the variation with times t of the velocity v of an object . Which one of the following graphs best represents the variation of acceleration a of the object with time t ?
View SolutionThe graph shown the variation with times t of the velocity v of an object . Which one of the following graphs best represents the variation of acceleration a of the object with time t ?
View SolutionThe graph shown the variation with times t of the velocity v of an object . Which one of the following graphs best represents the variation of acceleration a of the object with time t ?
View SolutionWhich of the following graphs represents the speed v of a projectile as a function of time?
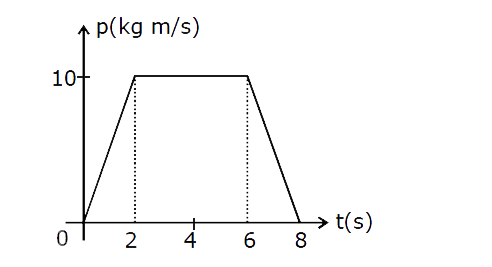
View SolutionThe momentum p of an object varies with time (t) as shown in figure. The corresponding force (F)- time (t) graph is -

View SolutionThe momentum p of an object varies with time (t) as shown in figure. The corresponding force (F)- time (t) graph is -
View SolutionWhich of the following statement is correct ?
View Solutionनिम्नांकित वेग (v)-समय (t) के बीच कौन सा ग्राफ एक गतिशील वस्तु की वास्तविक स्थिति को प्रदर्शित करता है:
View Solutiont_(1) The work done in t time on an object of mass m accelerated by v speed from time to time is given by the following as a function of time t:
View SolutionIf graph is parallel to time axis, then object is …... .
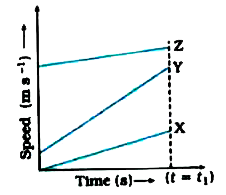
View SolutionThe speed-time graphs for three objects X, Y and Z are represented on the same graph paper. Which object would cover the highest distance in given interval of time (t)?

View SolutionThe speed-time graphs for three objects X, Y and Z are represented on the same graph paper. Which object would cover the highest distance in given interval of time (t)?
View SolutionRepresent the following v - t graph on a a - t graph.
View SolutionRepresent the following a-t graph on a v-t graph.
View SolutionA graph of velocity versus time (v - t) for an object performing motion with uniform acceleration is shown What would be the velocity of the object at time t= 0?
View SolutionA graph of velocity versus time (v - t) for an object performing motion with uniform acceleration is shown What would be the velocity of the object at time t= 0?
View SolutionWhich of the following speed - time (v - t) graphs is physically not possible?
View SolutionWhich of the following cannot be speed (v) - time (t) graph?
View SolutionWhich of the following speed - time (v - t) graphs is physically not possible?
View SolutionThe distance of an object falling is a function of time t and can be expressed as s(t) = Graph the function and determine if it is one-to-one.
View Solution