A bar chart is drawnusing pyplot to represent sales data of various models of cars for a month. Write appropriate statements in Python to provide labels Month - June and Sale done to x and y axis respectively.
import matplotlib.pyplot as pltimport numpy as npmodel=‘i20’ ’Grandi10’ ’Creta’ ’Eon’ ’Verna’ ’Tucson’ ’Elantra’ y_pos=np.arangelenmodelsale=[12369 12174 9390 4663 4077 3712 200 150] plt.bary_pos sale align=’center’ alpha=0.5 plt.xticksy_pos model plt.xlabel‘Month-June’plt.ylabel‘Sale done’plt.title‘Sales Bar Graph’plt.show
Related Solutions
The given bar graph represents the sale of cars in five different states in a month. Which state sold maximum number of cars ?
View SolutionThe given bar graph represents the sale of cars in five different states in a month. Which state sold 5000 cars ?
View SolutionThe line chart given blow represents the sales (in 00) of trousers ans shirts for five months.
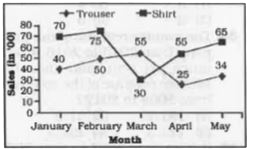
Total sale of shirts for five months is how much per cent more than the total sale of trousers for five months?View SolutionThe given graph shows the sale of story books in a bookshop for the first 6 months.
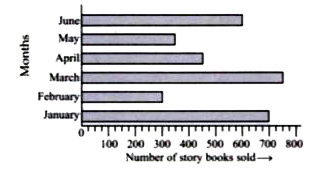
In which month, the sale of story books was of the sale of books in June ?View SolutionStudy the double bar graph shown below and answer the questions that follow:
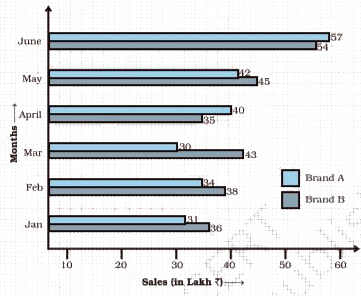
(a) What information is represented by the above double bar graph?
(b) In which month sales of Brand A decreased as compared to the previous month?
(c) What is the difference in sales of both the Brands for the month of June?
(d) Find the average sales of Brand B for the six months.
(e) List all months for which the sales of Brand B was less than that of Brand A.
(f) Find the ratio of sales of Brand A as compared to Brand B for the month of January.View SolutionThe line chart given blow represents the sales (in 00) of trousers ans shirts for five months.
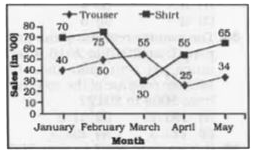
What is the difference between sales of shirts for months January and April?View SolutionThe line chart given below represents the sales (in 00) of trousers and shirts for five months .
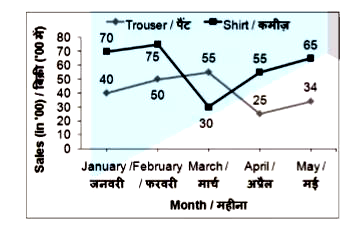
What is the difference between sales of shirts for months January and March?View SolutionThe following chart shows the sales ( in thousands ) of pens , pencils and books in month 1, month2 and months 3 . Answer the question based on the chart . Which product has the highest percentage of sales, and in which month (among all months) ?
View SolutionThe line chart given below represents the sales (in 00) of trousers and shirts for five months. In January sale of is what trousers percent of sale of Shirts ?
View SolutionThe line chart given blow represents the sales (in 00) of trousers ans shirts for five months.
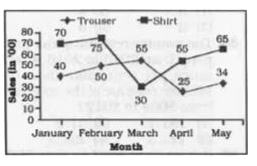
In March sale of trousers is what per cent of sale of shirts?View SolutionThe graph given below gives the actual and expected sales of cars of a company for 6 months. Study the graph and answer the questions that follow.
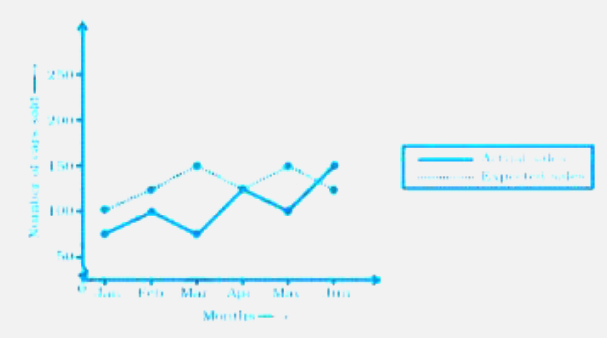
(a) In which month was the actual sales same as the expected sales?
(b) For which month(s) was (were) the difference in actual and expected sales the maximum?
(c) For which month(s) was (were) the difference in actual and expected sales the least?
(d) What was the total sales of cars in the months–Jan, Feb. and March?
(e) What is the average sales of cars in the last three months?
(f) Find the ratio of sales in the first three months to the last three months.View SolutionThe given bar graph represents the sale of cars in five different states in a month. What is the difference between the numbre of cars sold in Mumbai and Punjab ?
View SolutionThe given bar chart shows the details of cycle sales by a company between january and May for years 2017 and 2018
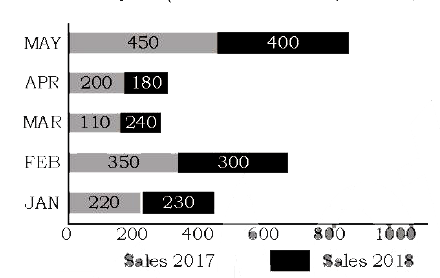
In the given bar chart, which month sales show the maximum decrease in 2018 as compared to 2017View SolutionThe given bar chart shows the details of cycle sales by a company between january and May for years 2017 and 2018
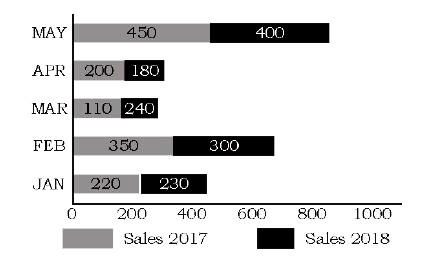
In the given bar chart, which month sales show the maximum decrease in 2018?View SolutionThe given bar chart shows the details of cycle sales by the company between January and May 2017 and 2018. In the given bar-chart, which month has maximum decrease in sales in 2018 as compared to 2017?
View SolutionThe average sales and standard deviation of sales for four months for a company are as follows:

During which month are the sales most consistent?View SolutionThe sales of months in a shop is 6435, 6927, 6855, 7230 and 6562. Find the sale of month so that the average sale of months is 6500
View SolutionThe line chart given below represents the sales ( in 00) of trousers and shirts for five months . What is the percentage decrease in the sales of the trousers from February to March?
View SolutionThe line chart given blow represents the sales (in 00) of trousers ans shirts for five months.
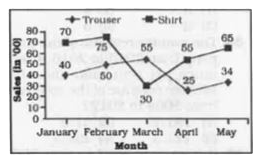
What is the percentage increase in the sales of the trousers from January to February?View SolutionIn the given bar chart, which month sale shows the maximum increase in 2018 as against 2017
View Solution
