दिए गए बार चार्ट में जनवरी और मई के बीच 2017 और 2018 के बीच कम्पनी द्वारा साइकिल बिक्री का विवरण दिखाया गया है।
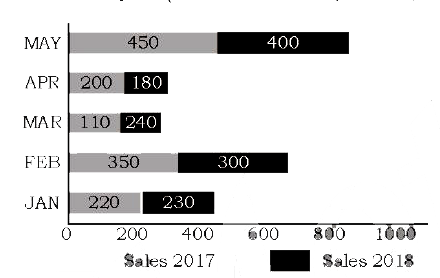
दिए गए बार-चार्ट में, 2017 की तुलना में 2018 में किस महीने की बिक्री में अधिकतम कमी आई है ?
मई
फरवरी
अप्रैल
जनवरी
The correct Answer is:B
Step by step video, text & image solution for दिए गए बार चार्ट में जनवरी और मई के बीच 2017 और 2018 के बीच कम्पनी द्वारा साइकिल बिक्री का विवरण दिखाया गया है। दिए गए बार-चार्ट में, 2017 की तुलना में 2018 में किस महीने की बिक्री में अधिकतम कमी आई है ? by Maths experts to help you in doubts & scoring excellent marks in Class 14 exams.
Updated on:21/07/2023Topper's Solved these Questions
Similar Questions
यदि A:B=2:3 और B:C=3:7, तो A+B:B+C:C+A क्या होगा?
View SolutionP और Q की वर्तमान आयु के बीच का क्रमशः अनुपात 3 : 4 है। चार वर्ष बाद Q, P से पाँच वर्ष बड़ा होगा।P की वर्तमान आयु कितनी है?
View SolutionThe following line diagram represents the yearly sales figure of a company in the years 2001-2010. Examine the diagram and answer the question. निम्नलिखित रेखा आरेख किसी कंपनी की वर्ष 2007-2010 के दौरान वार्षिक बिक्री के आंकड़ों को दर्शाता है। आरेख का अध्ययन करें और नीचे दिए गए प्रश्नों के उत्तर दें- By what percent did the sales in 2008 decrease in comparison to the sales in 2006? वर्ष 2006 में बिक्री की तुलना में वर्ष 2008 में बिक्रो में कितने प्रतिशत की कमी आई?
View SolutionThe given bar chart shows the details of cycle sales by a company between January and May for years 2017 and 2018.
दिया गया दंड आरेख वर्ष 2017 एवं 2018 में एक कंपनी के द्वारा जनवरी से लेकर मई तक साइकिल बिक्री की जानकारी देता है |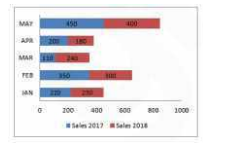 In the given bar-chart, which month sales show the maximum decrease in 2018 as compared to 2017?
दिए गए दंड आरेख में, किस माह की बिक्री 2017 की तुलना में 2018 में अधिकतम कमी को दर्शाती है ?
View SolutionThe given bar chart shows the details of cycle sales by a company between January and May for years 2017 and 2018.
दिया गया दंड आरेख वर्ष 2017 एवं 2018 में एक कंपनी के द्वारा जनवरी से लेकर मई तक साइकिल बिक्री की जानकारी देता है |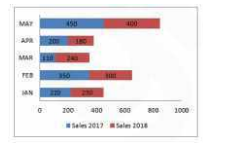 In the given bar-chart, which month sale shows the maximum increase in 2018 as against 2017?
/ दिए गए दंड आरेख के नुसार किस महीने की बिक्री 2017 की तुलना में 2018 में अधिकतम वृद्धि दर्शाती है ?
View SolutionThe given bar graph shows the sale of books (in thousands) in four metropolitan branches of a company for the year 2014 and 2015. दिया गया बार ग्राफ वर्ष 2014 और 2015 के लिए किसी कंपनी की चार महानगरीय शाखाओं में पुस्तकों की (हज़ारो में ) बिक्री को दर्शाता है | In the given bar graph, compared to 2014, which of the branch saw maximum increase in sales (in%) in 2015? दिए गए बार ग्राफ में, 2014 की तुलना में 2015में कौन सी शाखा की बिक्री में अधिकतम वृद्धि (% में ) हुई ?
View SolutionThe bar graph given below shows the wheat production (in tonnes) of a large farm during the year 2011-2018. In how many years was wheat production higher than the average production of the period? नीचे दिए गए दंड आरेख में वर्ष 2011-2018 के दौरान किसी बड़े फार्म के गेहूं उत्पादन (टन में) को दर्शाया गया है | अवधि के औसत उत्पादन की तुलना में दिए गए कितने वर्षो में गेहूं उत्पादन अधिक था ?
View SolutionThe given Bar Graph presents the number of different types of vehicles exported by a company in 2017 and 2018.The average export of vehicles in 2018 is what percent more than the export of vehicle A in 2017?
दिया गया दंड आरेख एक कंपनी के द्वारा 2017 और 2018 में निर्यात किये गए अलग-अलग प्रकार के वाहनों की संख्या को दर्शाता है |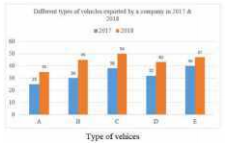
2018 में वाहनों का औसत निर्यात 2017 में वाहन A के निर्यात से कितना प्रतिशत अधिक है ?
View SolutionThe given Bar Graph presents the number of different types of vehicles exported by a company in 2017 and 2018.The increase in the exports in 2018 as compared to that in 2017 is closest to 32% in case of vehicles of type:
दिया गया दंड आरेख एक कंपनी के द्वारा 2017 और 2018 में निर्यात किये गए अलग-अलग प्रकार के वाहनों की संख्या को दर्शाता है |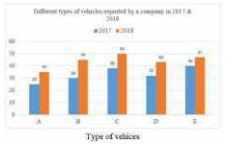
किस प्रकार के वाहनों के मामले में 2017 की तुलना में 2018 में निर्यात में हुई वृद्धि 32% के लगभग है :
View SolutionStudy the given chart and answer the following questions:
दिए गए चार्ट का अध्ययन करें और निम्नलिखित प्रश्नों के उत्तर दें: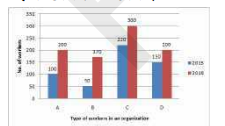 The percentage increase in the number of workers in 2018 is maximum as compared to that is
2015 in case of workers of type:
2018 में श्रमिकों की संख्या में प्रतिशत वृद्धि 2015 की तुलना में अधिकतम है, जो कि किस प्रकार के श्रमिकों के मामले में है?
View SolutionStudy the chart and answer the questions:
In which of the given years is the percentage increase in the number of hotels in comparison to the previous year, is the maximum?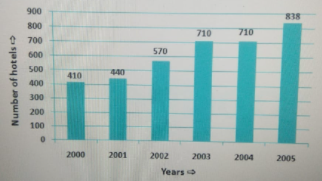
चार्ट का अध्ययन करें और प्रश्नों का उत्तर दें:पिछले वर्ष की तुलना में होटलों की संख्या में किस वर्ष में अधिकतम प्रतिशत वृद्धि हुई है?
View SolutionThe following bar graph shows the sales (in thousands) of motor bikes by the factories, F1, F2, F3 and F4 is 2017, 2018 and 2019.
निम्नलिखित दंड आरेख कारखानों, F1, F2, F3 और F4 द्वारा 2017, 2018 और 2019 में मोटर बाइक की बिक्री (हजारों में) को दर्शाता है।
Which factory had the highest sales across all the years?
सभी वर्षों में किस कारखाने की बिक्री सबसे अधिक थी?
View SolutionThe given Bar Graph presents the sale (in 1000kg) of a particular brand of tea by three outlets, A, B and C during the months of Jan, Feb, Mar and Apr, 2018.
दिया गया दंड आरेख (बार ग्राफ) तीन विक्रय केंद्रों A, B और C के दवारा चाय के किसी खास ब्रांड की जनवरी , फरवरी ,मार्च और अप्रैल ,2018 के दौरान (1000 kg में ) बिक्री को दर्शाता है |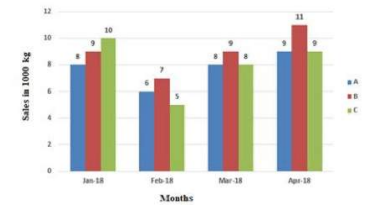 What is the ratio of the rate of growth in sales from B to the rate of growth in sales from C in Mar 2018 with reference to its previous month?
पिछले महीने की तुलना में ,मार्च 2018 में B की बिक्री वृद्धि-दर तथा C की बिक्री वृद्धि-दर का क्या अनुपात है ?
View Solutionउस शब्द-युग्म का चयन करें, जिस में शब्दों के बीच वही संबंध है, जो संबंध दिए गए शब्द-युग्म के शब्दों के बीच है।
तीव्र : धीमा
View Solutionनीचे दिए गए आयनो के युग्म में से किस युग्म के लिए पहला आयन दूसरे की तुलना में अधिक स्थायी है?
View Solutionनिम्नलिखित में से कौनसा दिए गए यौगिकों में सक्रियता के सही क्रम का निरूपण करता है?
View Solution
