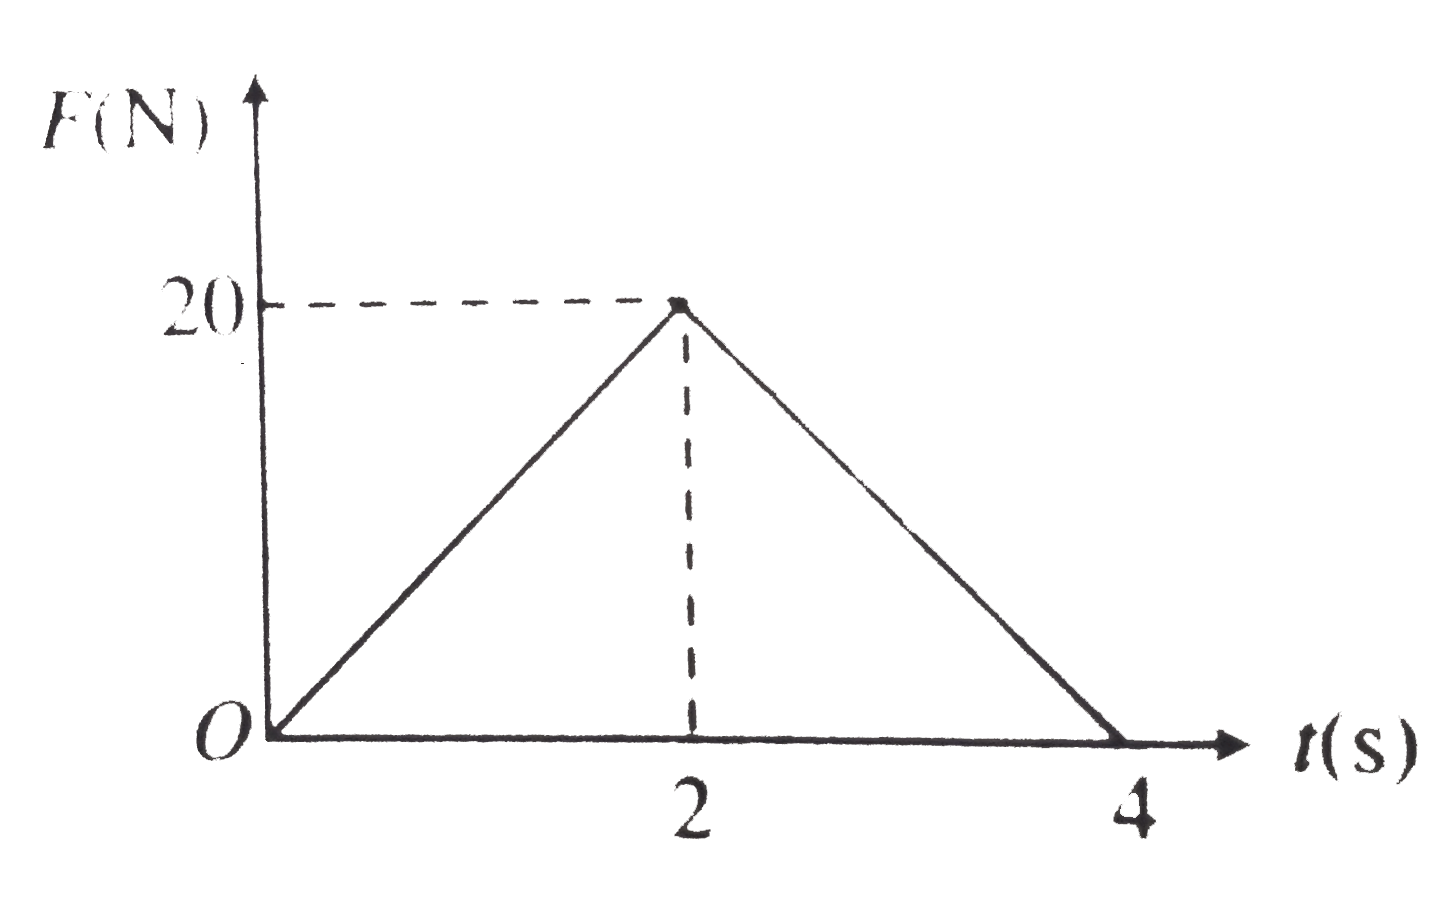
Figure shows the variation of force acting on a boby with time. Assume the body to start from rest, the variation of its momentum with time is best represented by which plot?


The correct Answer is:C
From 0 to 2 s: at any time t, F=10t
⇒a=F/m=10t/m
⇒∫v0dv=∫v010tmdt⇒v=5t2m
Momentum : P=mv=5t2
At t=2s,P=5(2)2=20kgms−1,v=20/m
from 2 to 4 s: F=40−10t
∫v20/mdv=∫t240−10tmdt⇒v=1m[40t−40−5t2]
P=mv=40t−40−5t2.
Topper's Solved these Questions
- BOOK - CENGAGE PHYSICSCHAPTER - NEWTON'S LAWS OF MOTION 1EXERCISE - Multiple Correct11videos
NEWTON'S LAWS OF MOTION 1
- BOOK - CENGAGE PHYSICSCHAPTER - NEWTON'S LAWS OF MOTION 1EXERCISE - Assertion-reasoning15videos
NEWTON'S LAWS OF MOTION 1
- BOOK - CENGAGE PHYSICSCHAPTER - NEWTON'S LAWS OF MOTION 1EXERCISE - Subjective15videos
NEWTON'S LAWS OF MOTION 1
- BOOK - CENGAGE PHYSICSCHAPTER - MISCELLANEOUS VOLUME 2EXERCISE - INTEGER_TYPE10videos
MISCELLANEOUS VOLUME 2
- BOOK - CENGAGE PHYSICSCHAPTER - NEWTON'S LAWS OF MOTION 2EXERCISE - Integer type1videos
NEWTON'S LAWS OF MOTION 2
Similar Questions
Knowledge Check
- Question 1 - Select One
A force of 10 N acts on a body of mass 0.5 kg for 0.25s starting from rest.What is its momentum now?
A0.25N/sB2.5N/sC0.5N/sD0.75N/s - Question 2 - Select One
For a body moving with uniform acceleration along straight line, the variation of its velocity (v) with position (x) is best represented by
A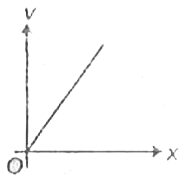 B
B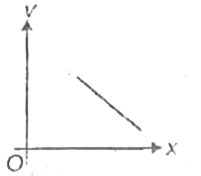 C
C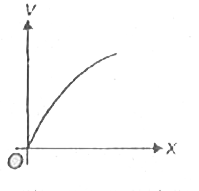 D
D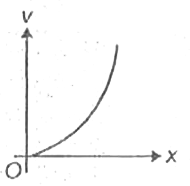
- Question 3 - Select One
The variation of temperature of a liquid with time is represented correctly by (figure)
A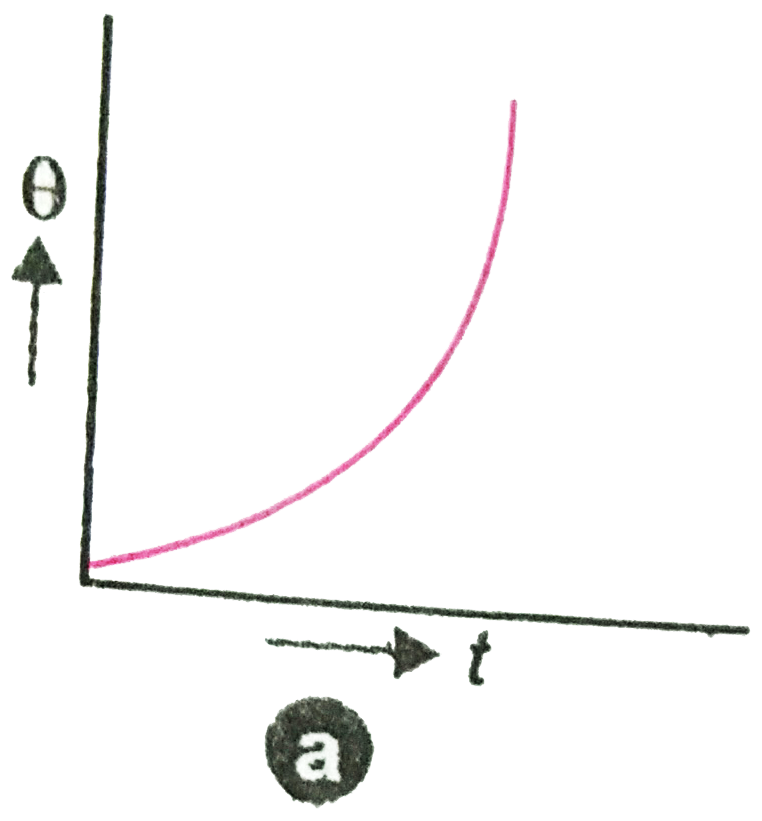 B
B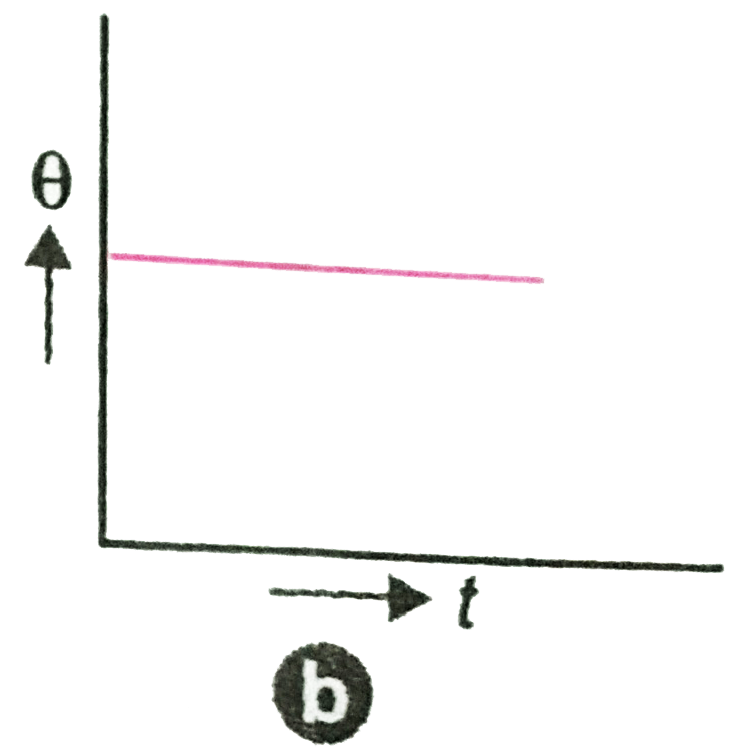 C
C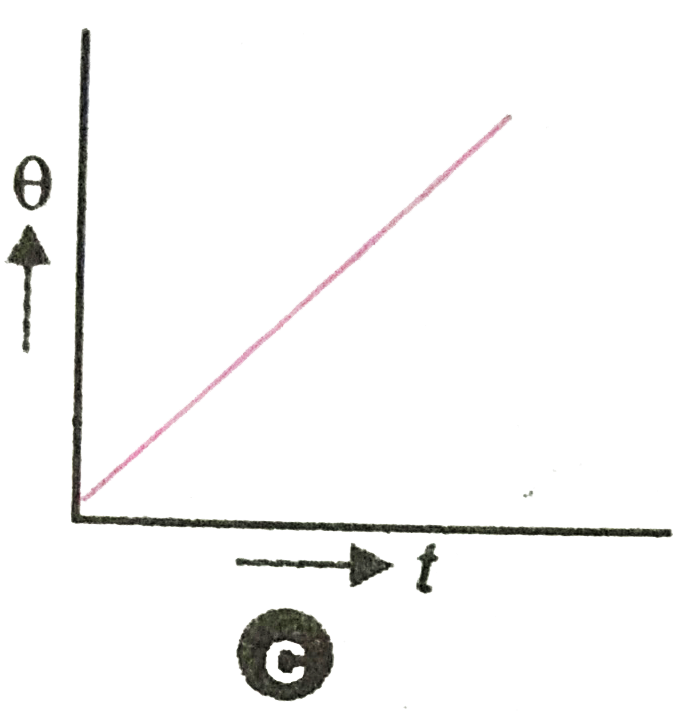 D
D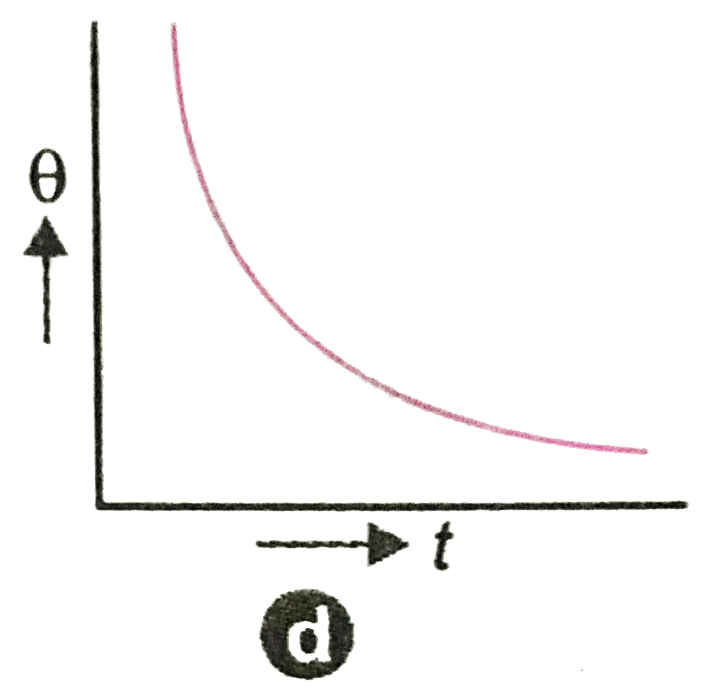
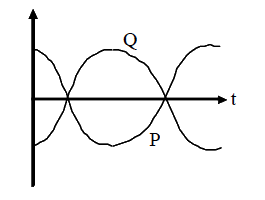
Figure shows the variation of voltage with time for an ac I=I0sinωt flowing through a circuit -
 View Solution
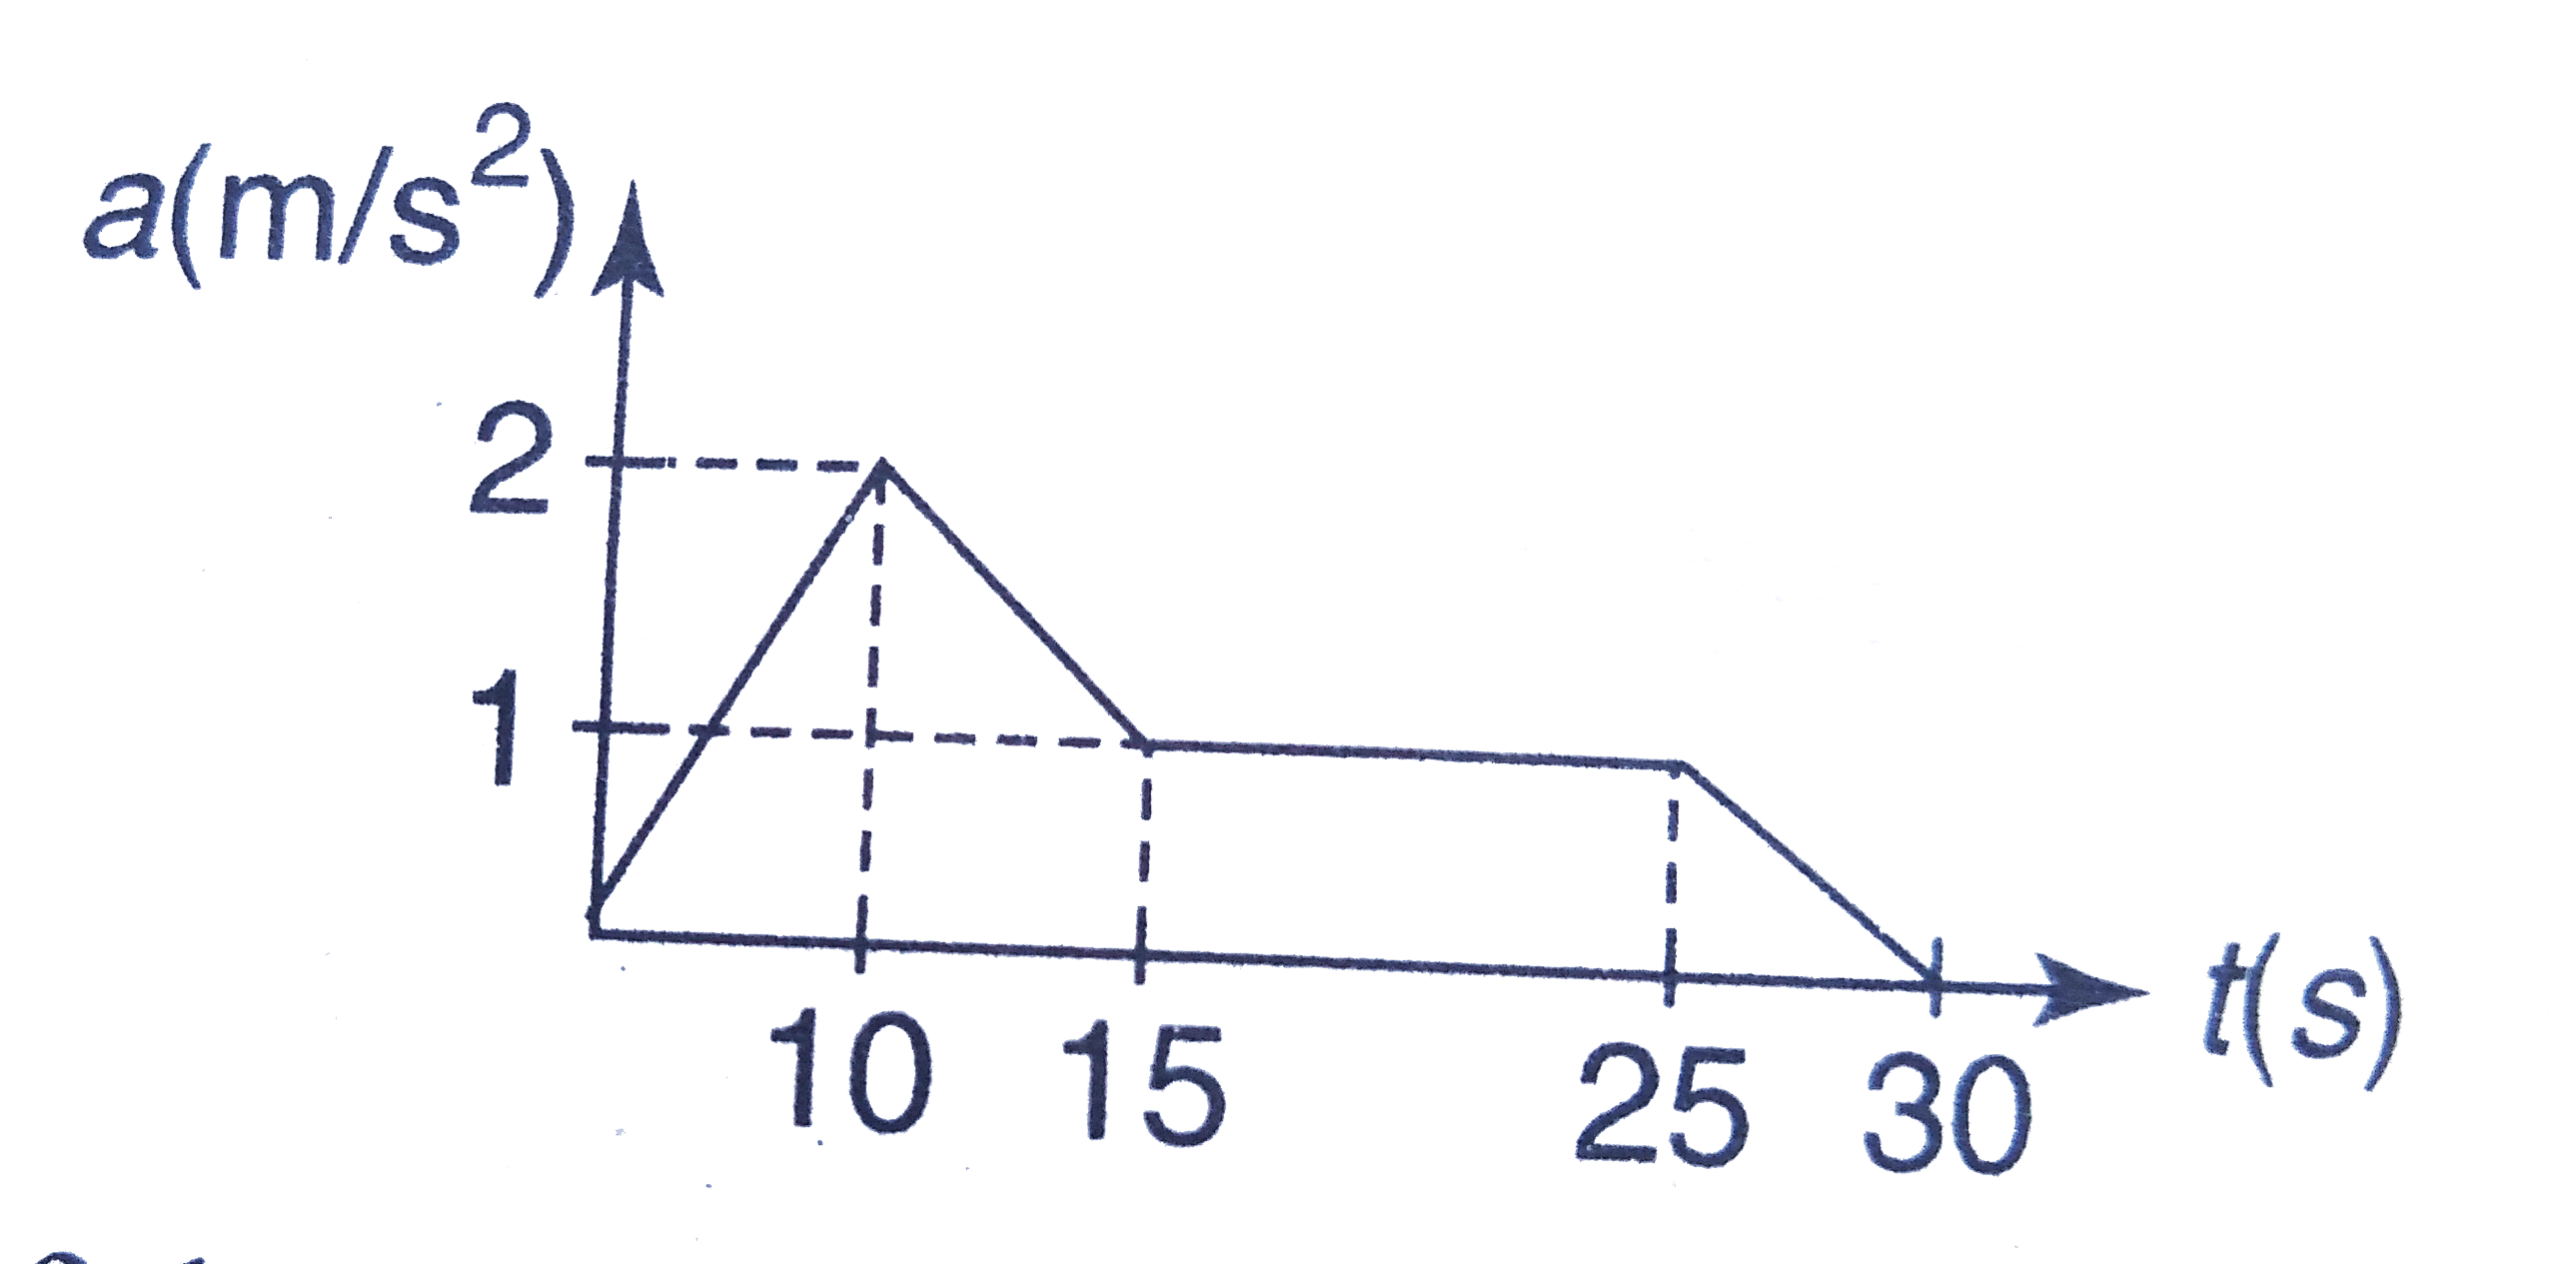
In figure shown, the graph shows the variation of acceleration of body with time t. The velcocity of the body at t=0 is zero. The velocity of the body at t=30s is.
 View Solution
A body starting from rest moves along a straight line with a constant acceleration. The variation of speed (v) with distance (s) is represented by the graph
View SolutionA body starting from rest moves along a straight line with a constant acceleration. The variation of speed (v) with distance (s) is represented by the graph
View SolutionThe variation of induced emf (F) with time (t) in a coil if a short bar magnet is moved along its axis with a constant velocity is best represent as
 View Solution


