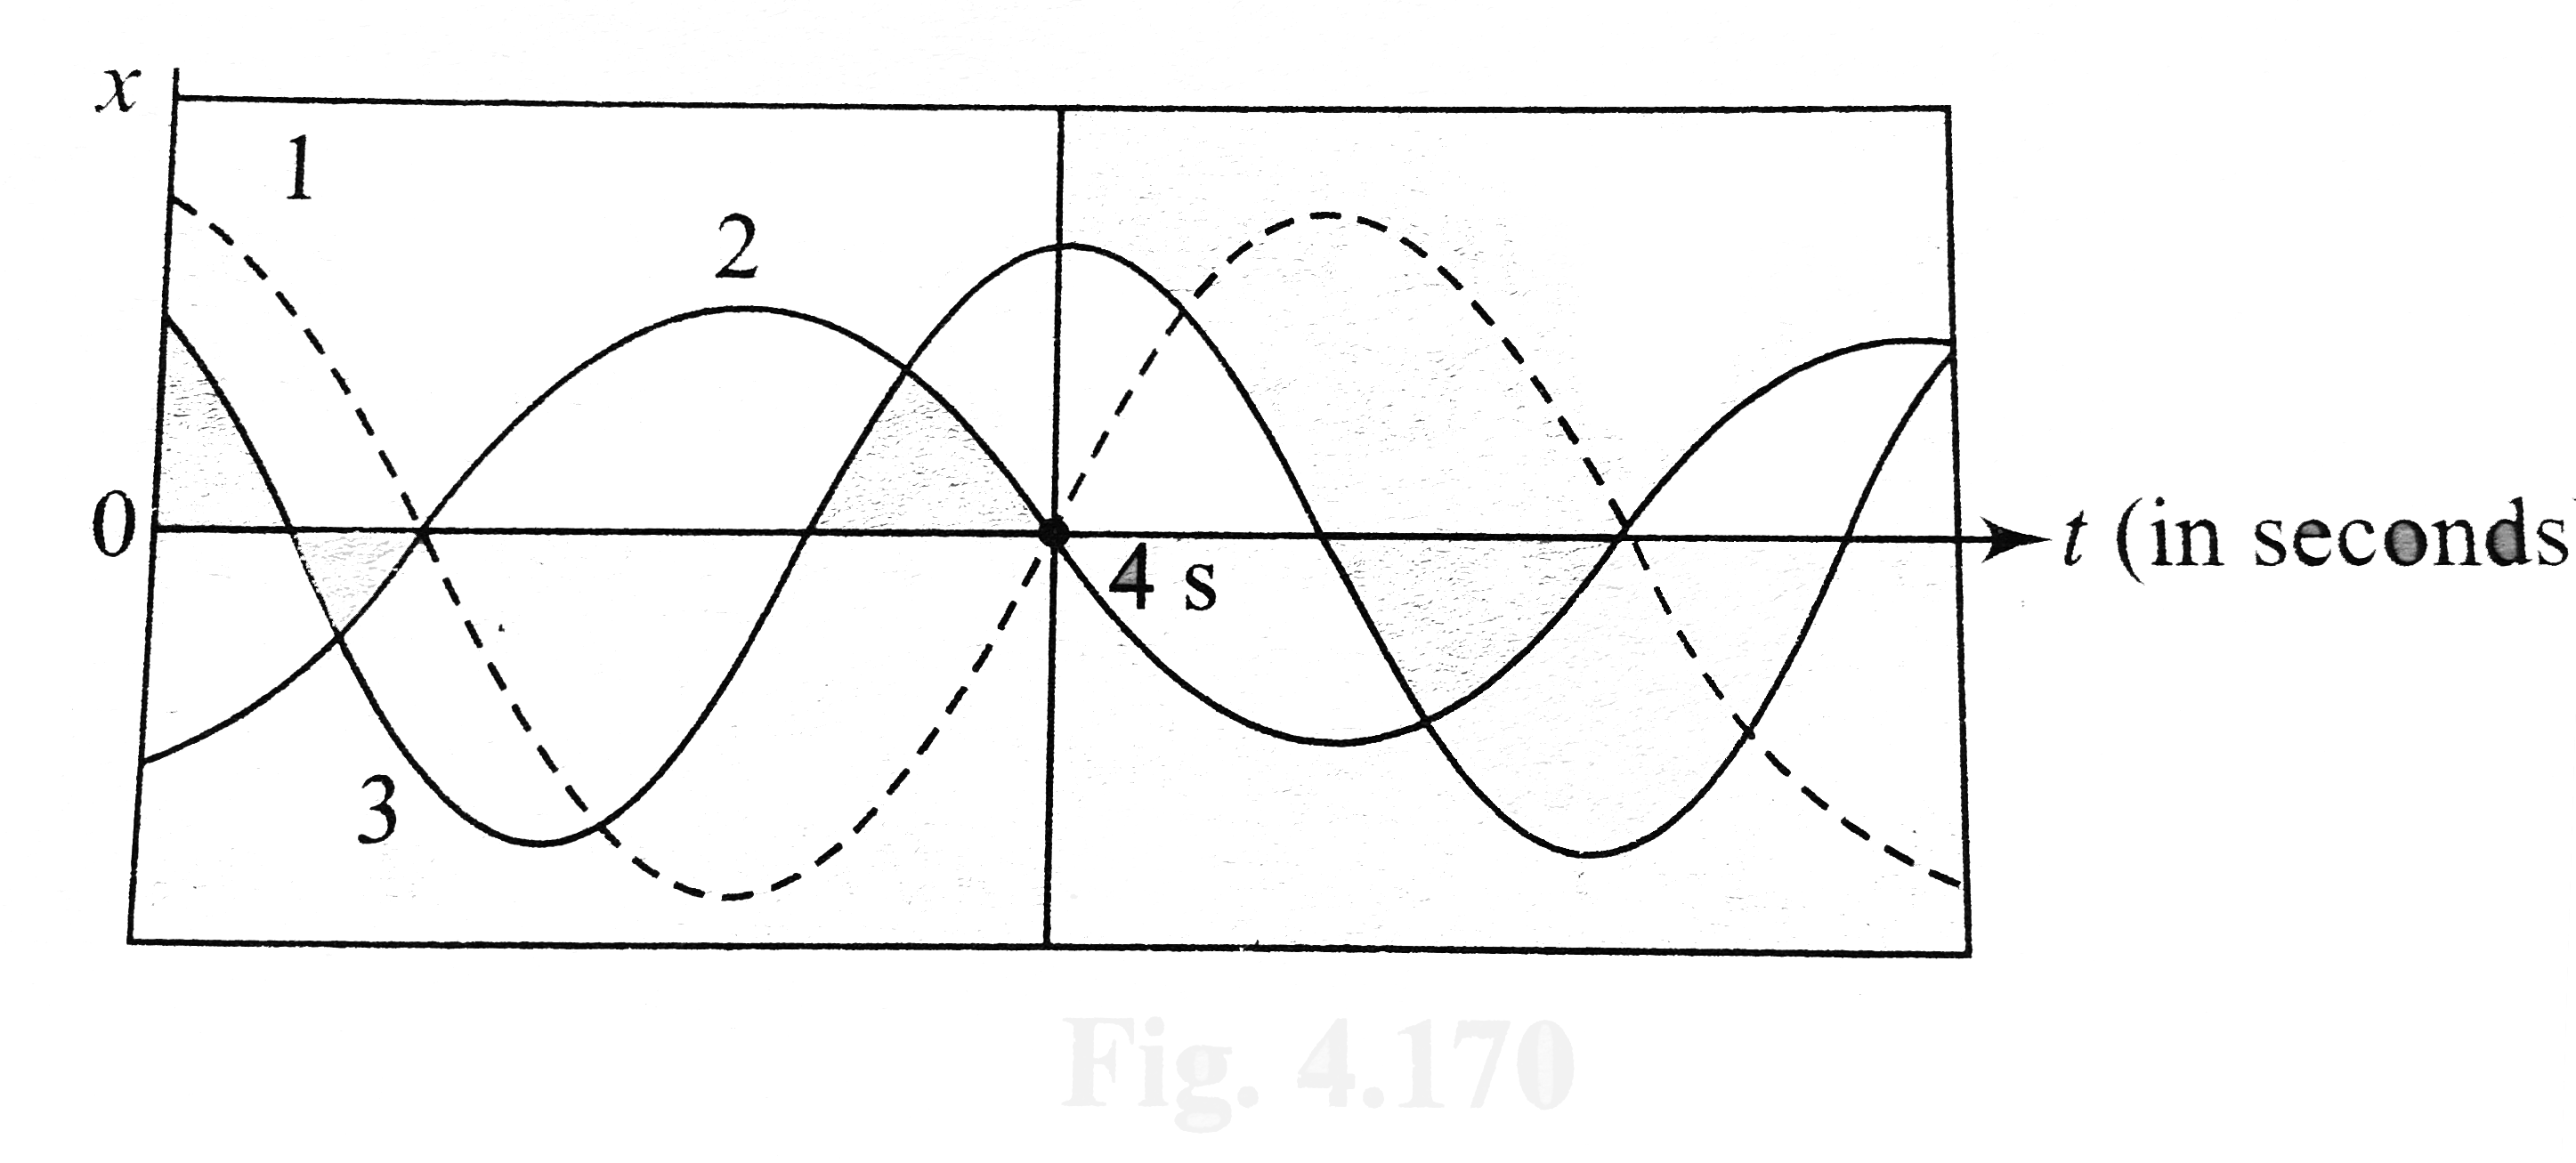
Graph shows the x(t) curves for the three experiments involving a particular spring block system oscillating in SHM. The kinetic energy of the system is maximum at t=4 s. For the situation.
1
2
3
same in all
The correct Answer is:A
At t=0 x=0 i.e, particle must be passes through the men position for (1) and (3) but
The slope of x-t graph is the speed. From graph, the slope of curve 1 is greatest, Hence (a)
Topper's Solved these Questions
- BOOK - CENGAGE PHYSICSCHAPTER - LINEAR AND ANGULAR SIMPLE HARMONIC MOTIONEXERCISE - Multiple Correct35videos
LINEAR AND ANGULAR SIMPLE HARMONIC MOTION
- BOOK - CENGAGE PHYSICSCHAPTER - LINEAR AND ANGULAR SIMPLE HARMONIC MOTIONEXERCISE - Assertion Reasoning6videos
LINEAR AND ANGULAR SIMPLE HARMONIC MOTION
- BOOK - CENGAGE PHYSICSCHAPTER - LINEAR AND ANGULAR SIMPLE HARMONIC MOTIONEXERCISE - Subjective21videos
LINEAR AND ANGULAR SIMPLE HARMONIC MOTION
- BOOK - CENGAGE PHYSICSCHAPTER - KINETIC THEORY OF GASES AND FIRST LAW OF THERMODYNAMICSEXERCISE - Interger11videos
KINETIC THEORY OF GASES AND FIRST LAW OF THERMODYNAMICS
- BOOK - CENGAGE PHYSICSCHAPTER - MISCELLANEOUS KINEMATICSEXERCISE - Interger type3videos
MISCELLANEOUS KINEMATICS
Similar Questions
Two blocks A and B each of mass m are connected by a massless spring of natural length L and spring constant k. The blocks are initially resting on a smooth horizontal floor with the spring at its natural length. A third identical block C also of mass m moves on the floor with a speed v along the line joining A and B and collides with A. Then
The kinetic energy of the A-B system at maximum compression of the spring is mv2/4
The maximum compression of the spring v√m/3k<br>Thek∈etice≠rgyoftheA−Bsystematmaxiμmcompression<br>Themaxiμmcoppressionofthespr∈gisvsqrt(m//k)View SolutionWhile comparing the L−C oscillations with the oscillations of spring-block system, with whom the magnetic energy can be compared and why?
View Solution
Knowledge Check
- Question 1 - Select One
In S.H.M., the graph between kinetic energy K and time 't' is
A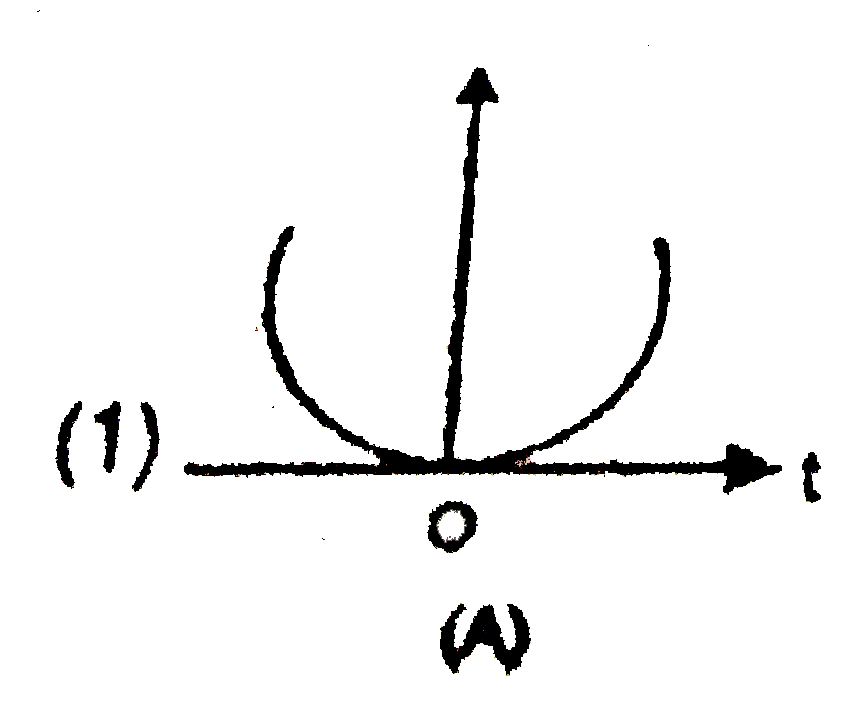 B
B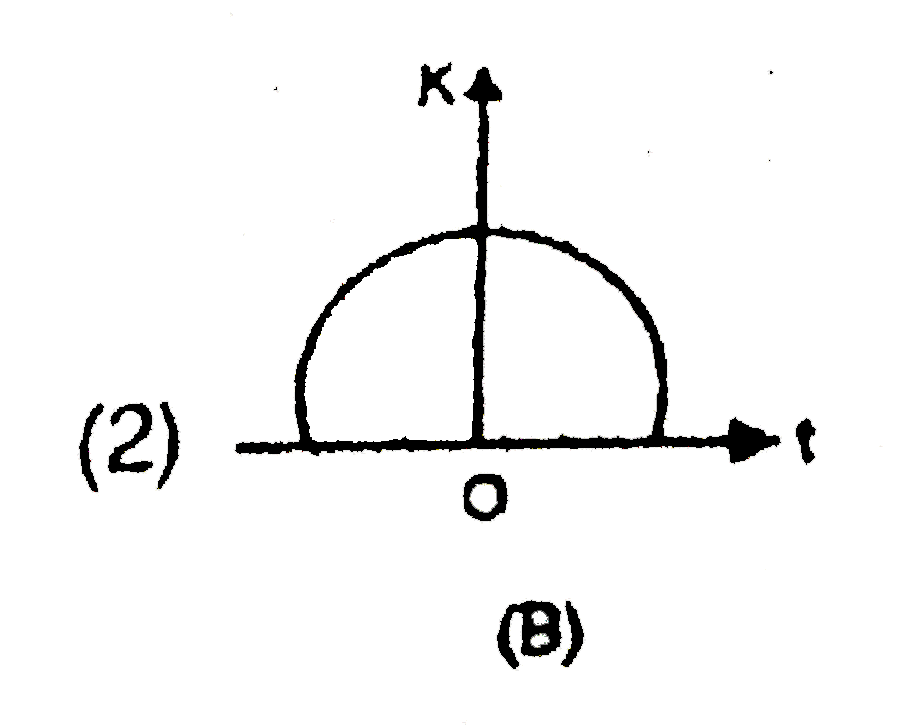 C
C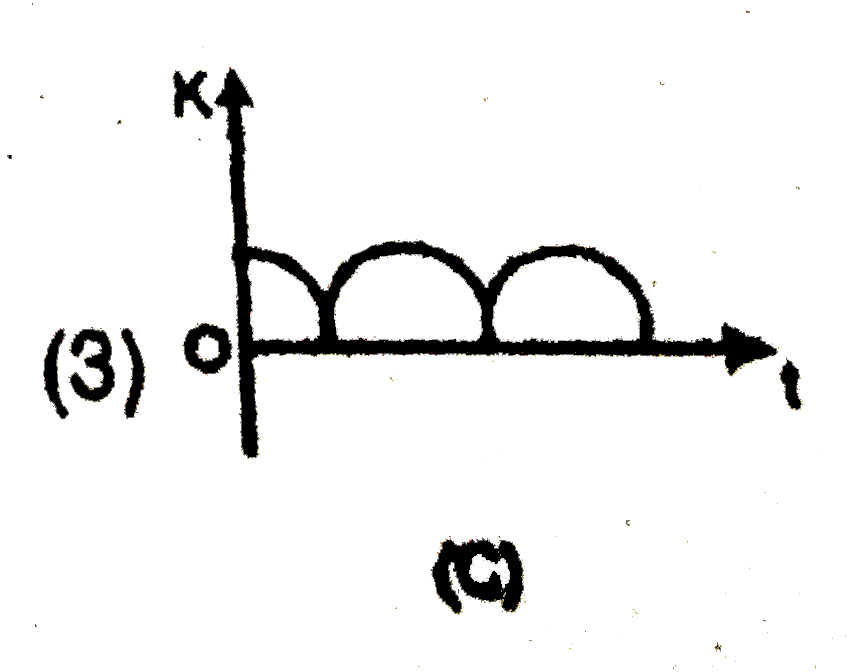 D
D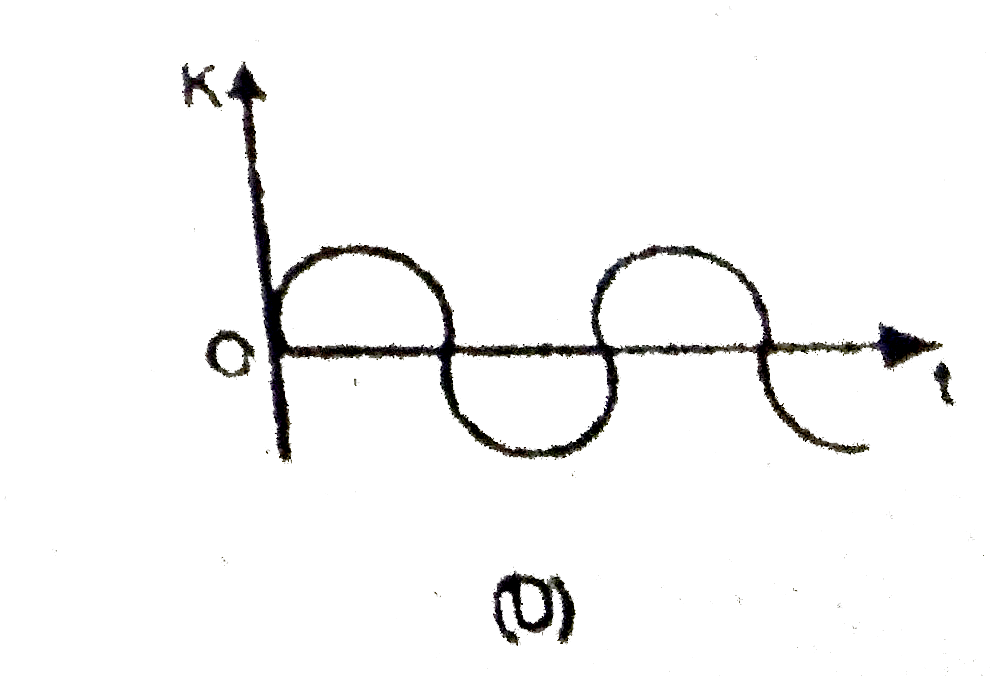
- Question 2 - Select One
A body performs S.H.M. Its kinetic energy K varies with time t as indicated by graph
A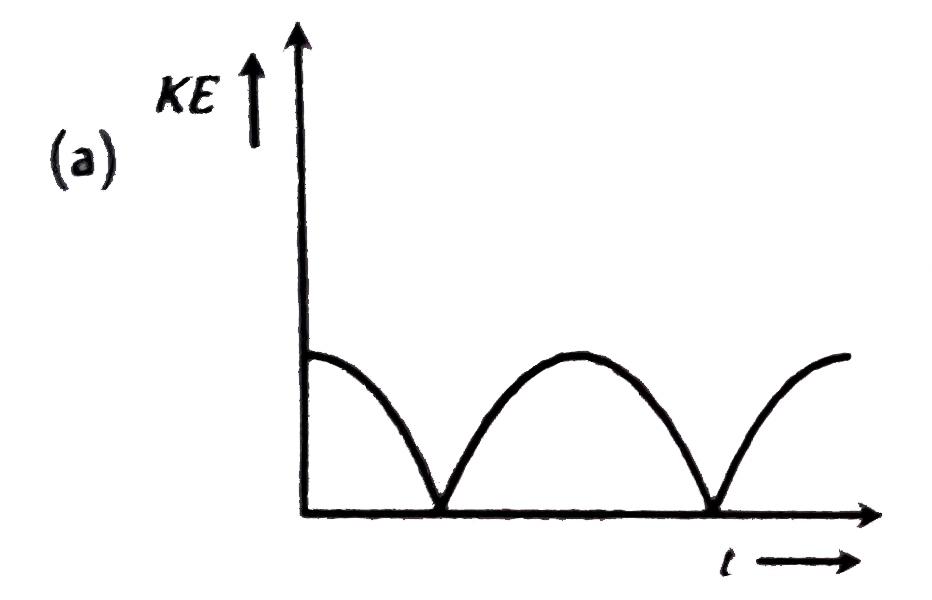 B
B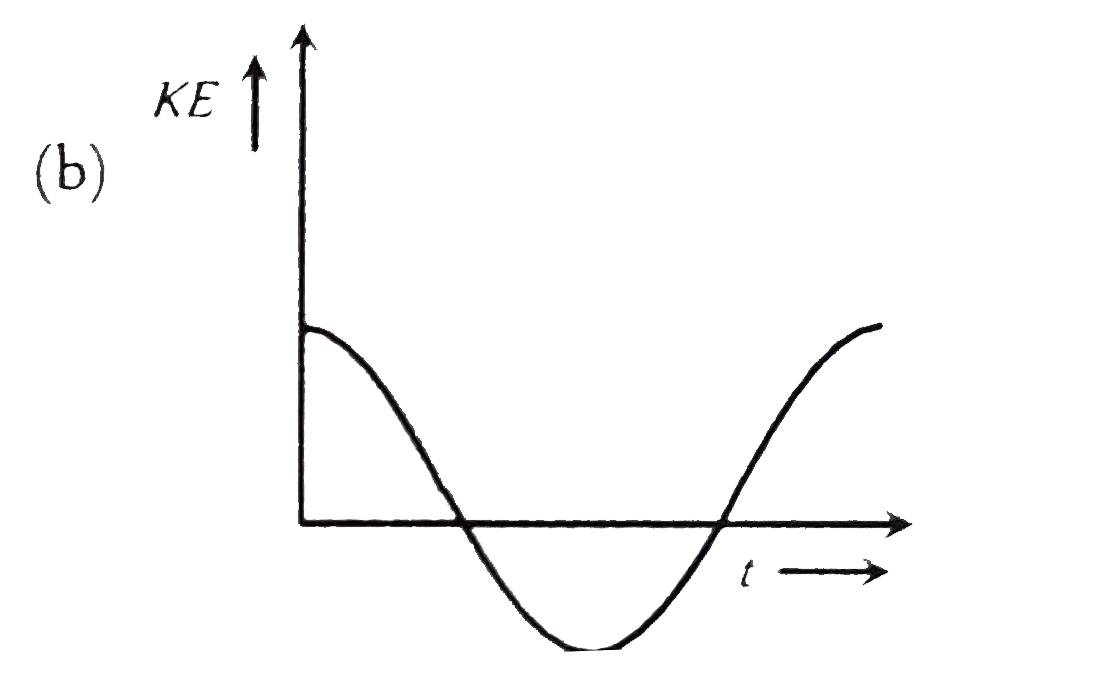 C
C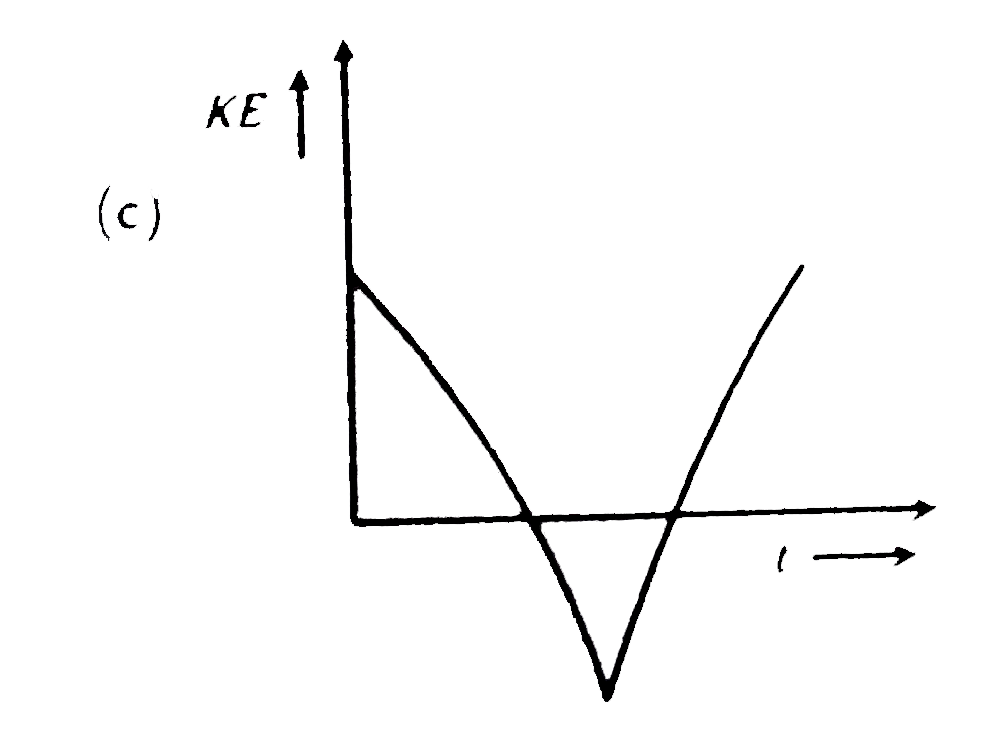 D
D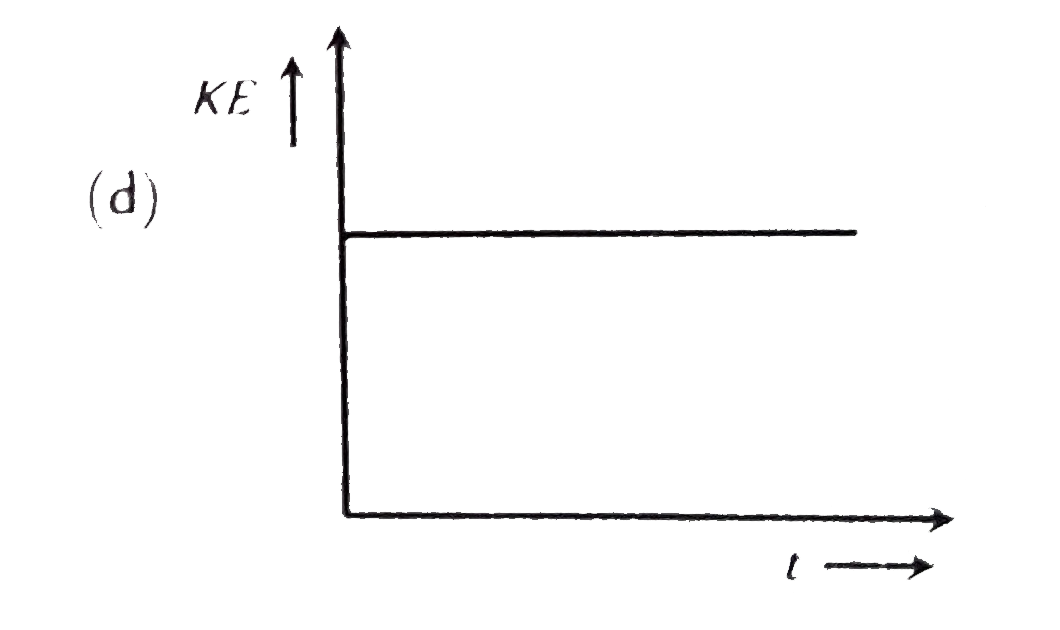
- Question 3 - Select One
In S.H.M., potential energy (U) V/s, time (t) . Graph is
A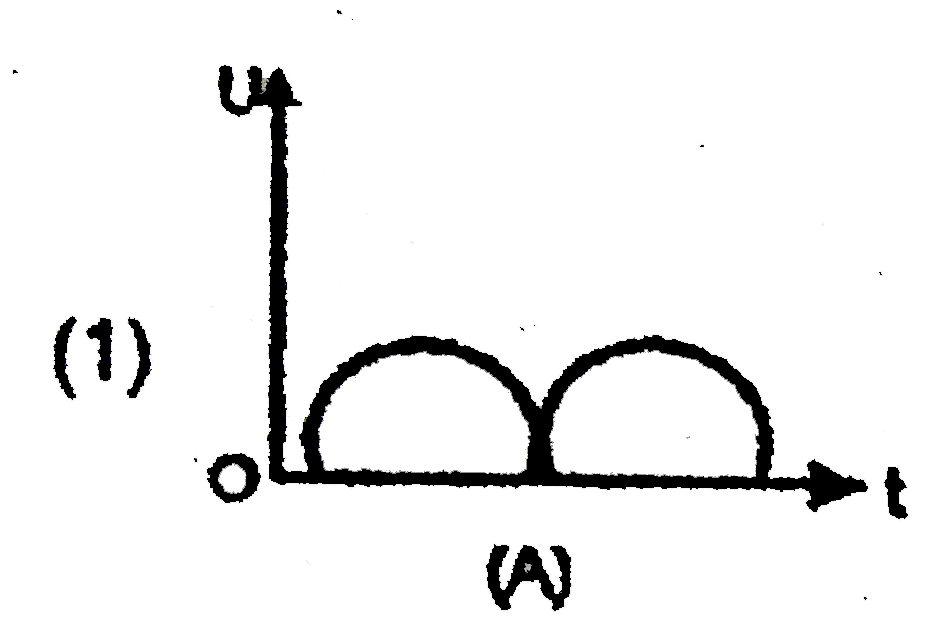 B
B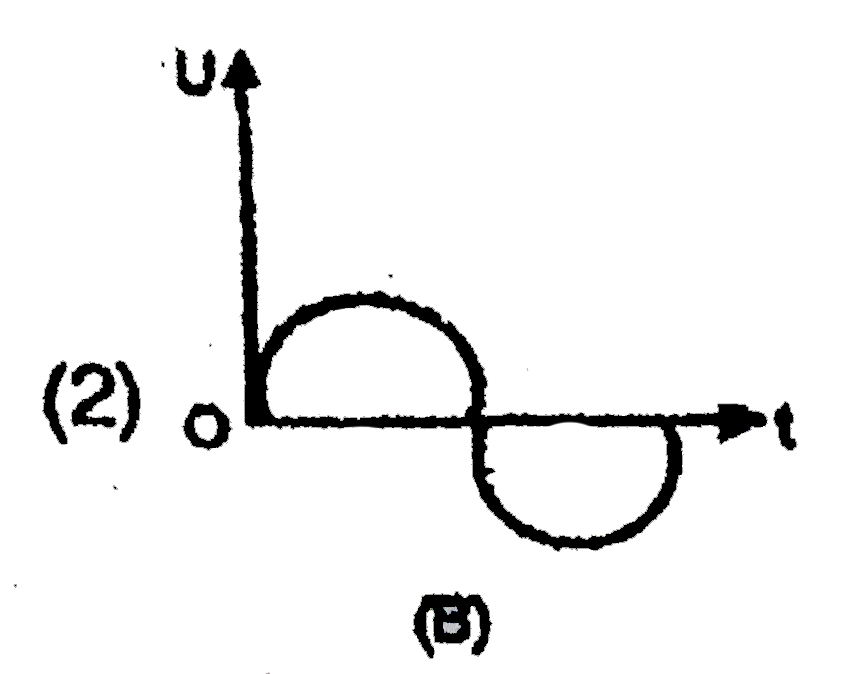 C
C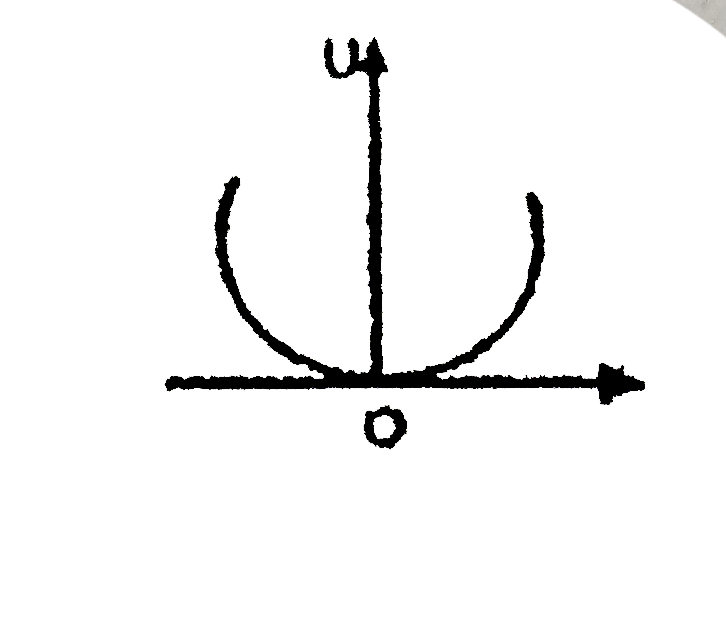 D
D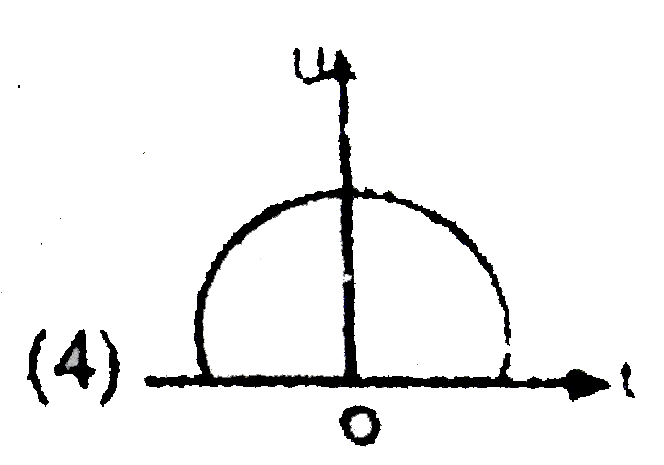
i.The acceleration versus time graph of a partical SHM is shown in the figure . Plot the displacement versus time graph
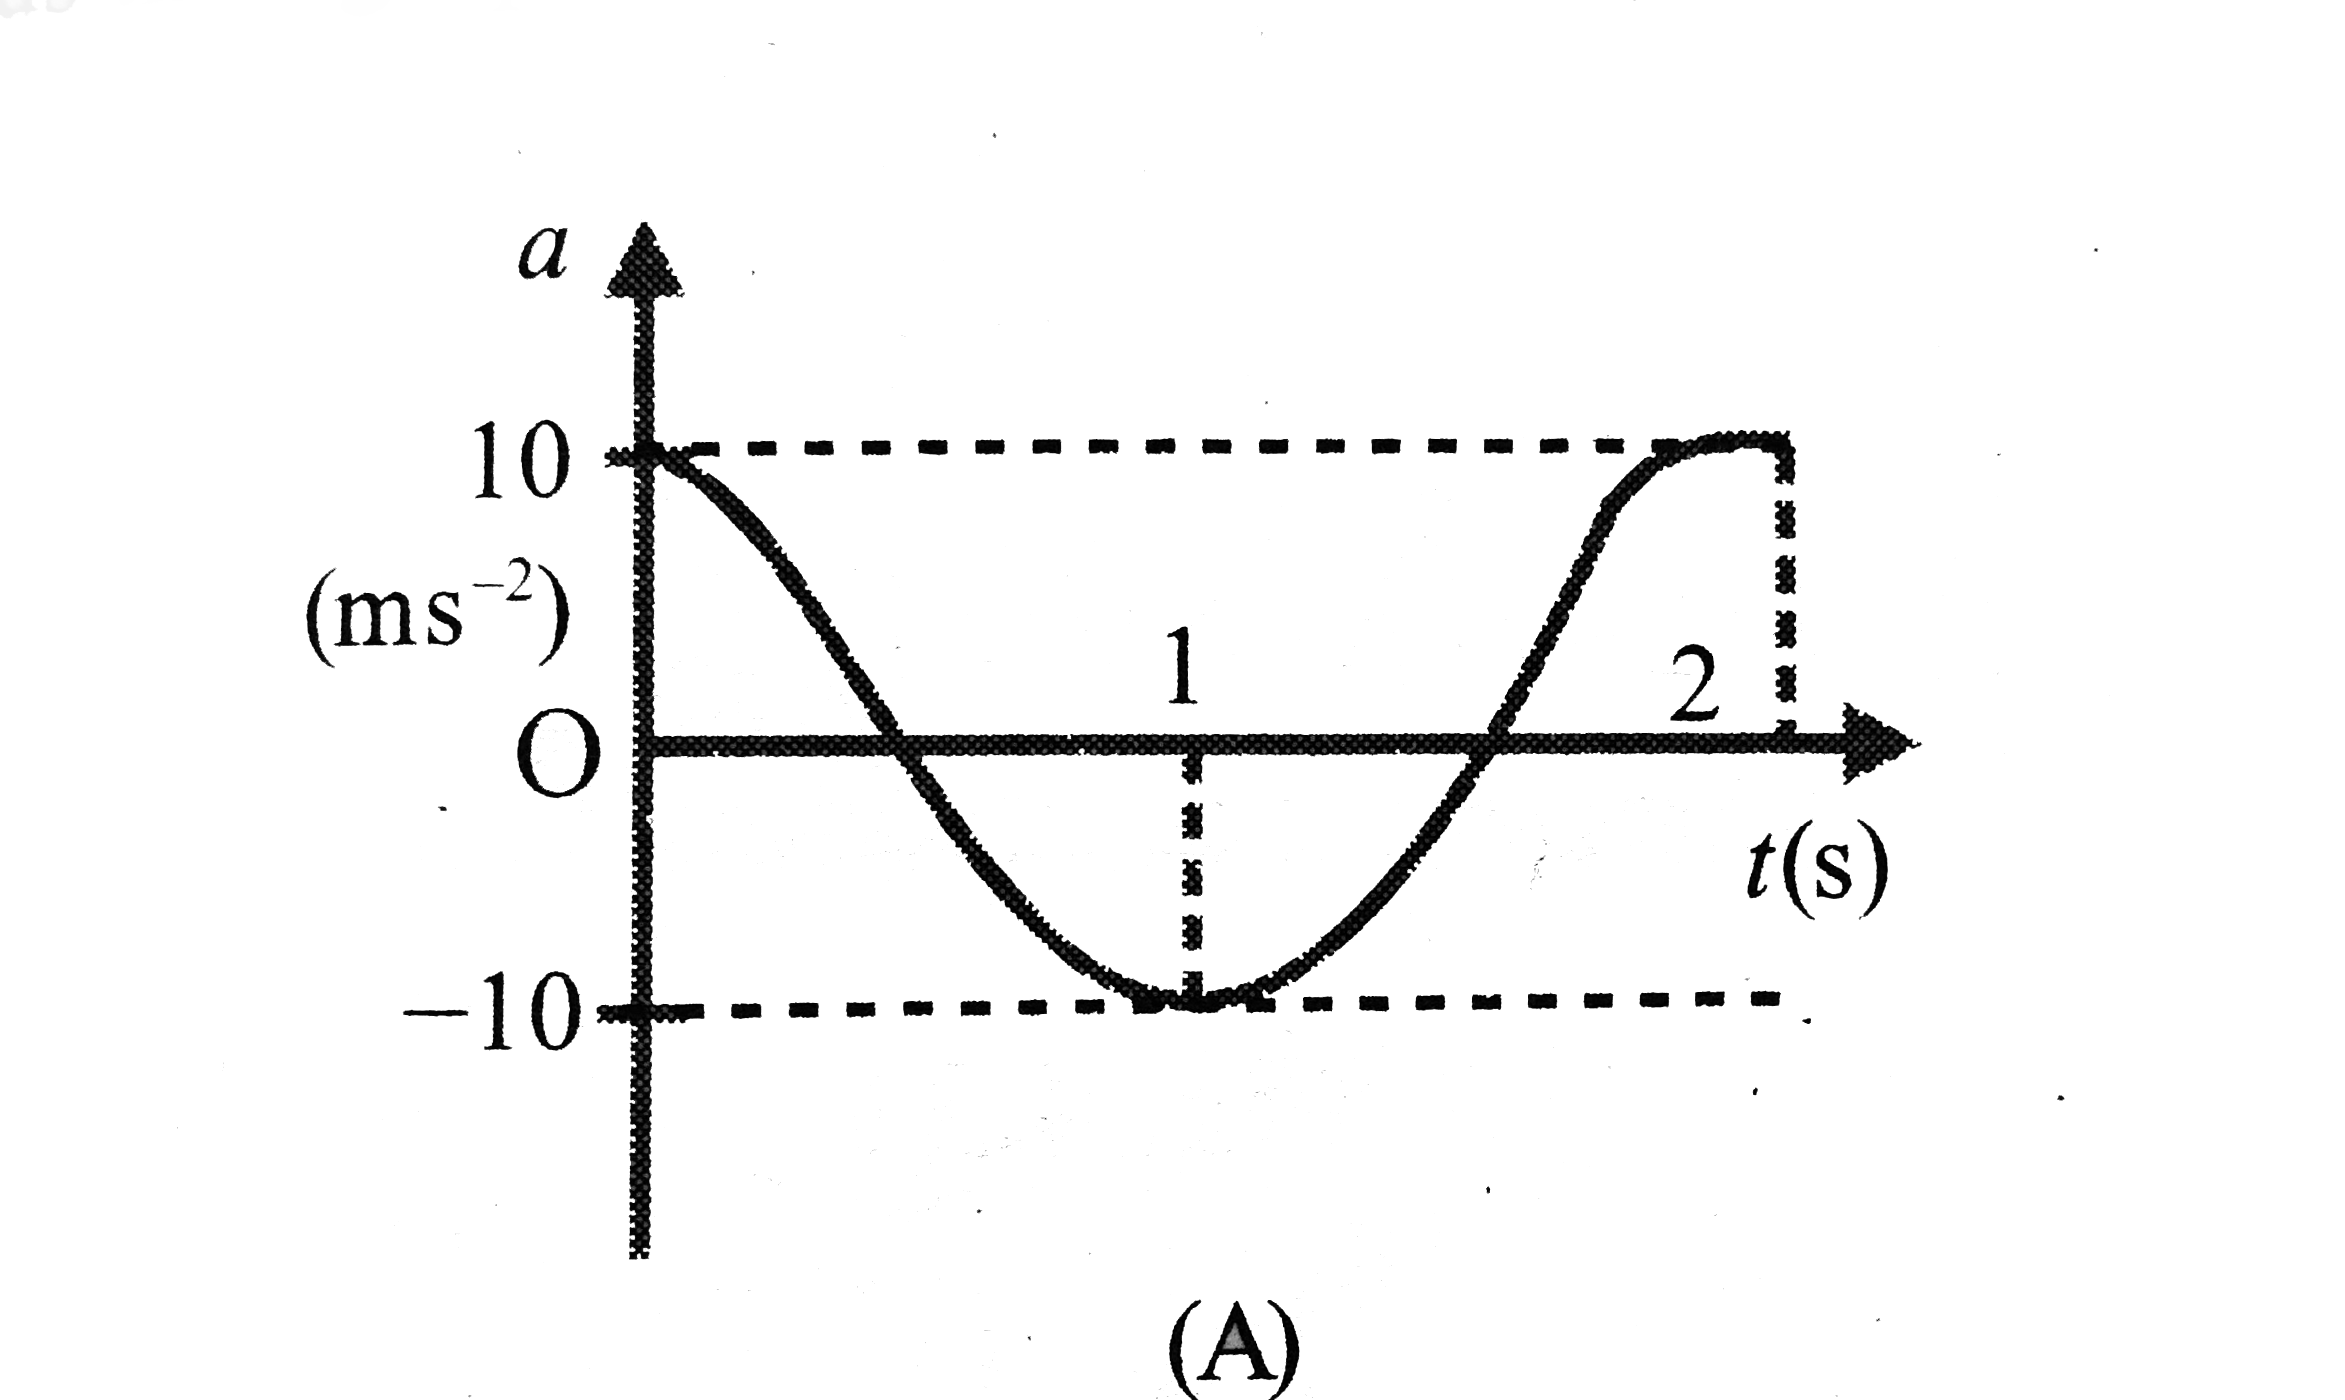
ii. The frection of oscillation is……..
iii. The displacement amplitude is ………
iv. At t=0, the velocity of the partical is ......
v. The kinetic energy of the partical is maximum at t=....... and t = ......
vi. The potential energy is maximum at t = ....... : t = ..... ans t = .........View SolutionA block moves with a certain speed and collides with another identical block kept at rest . There is maximum possible loss of kinetic energy in this collision . Find the ratio initial kinetic energy of the sustem to that with final kinetic enegy of the system .
View SolutionA particle of mass 1 kg is hanging from a spring of force constant 100 Nm1 . The mass is pulled slightly downward and released so that it executes free simple harmonic motion with time period T. The time when the kinetic energy and potential energy of the system will become equal, is Tx The value of x is_______
View SolutionFor a particle executing S.H.M., the kinetic energy K is given K=K0cos2ωt. The maximum value of potential energy is:
View SolutionA constant external torque τ acts for a very brief period Δt on a rotating system having moment of inertia I.
(i) The angular momentum of the system will change by τΔt
(ii) The angular velocity of the system will change by (τΔt)/I.
(iii) If the system was initially at rest, it will acquire rotational kinetic energy (τΔt)2/2I.
(iv) The kinetic energy of the system will change by (τΔt)2I.View Solution
