Two point charge ±q are placed on the axis at x=−a and x=+a, as shown in fig.
(i) Plot the variation of E along the x-axis.
(ii) Plot the variation of E along the y-axis.
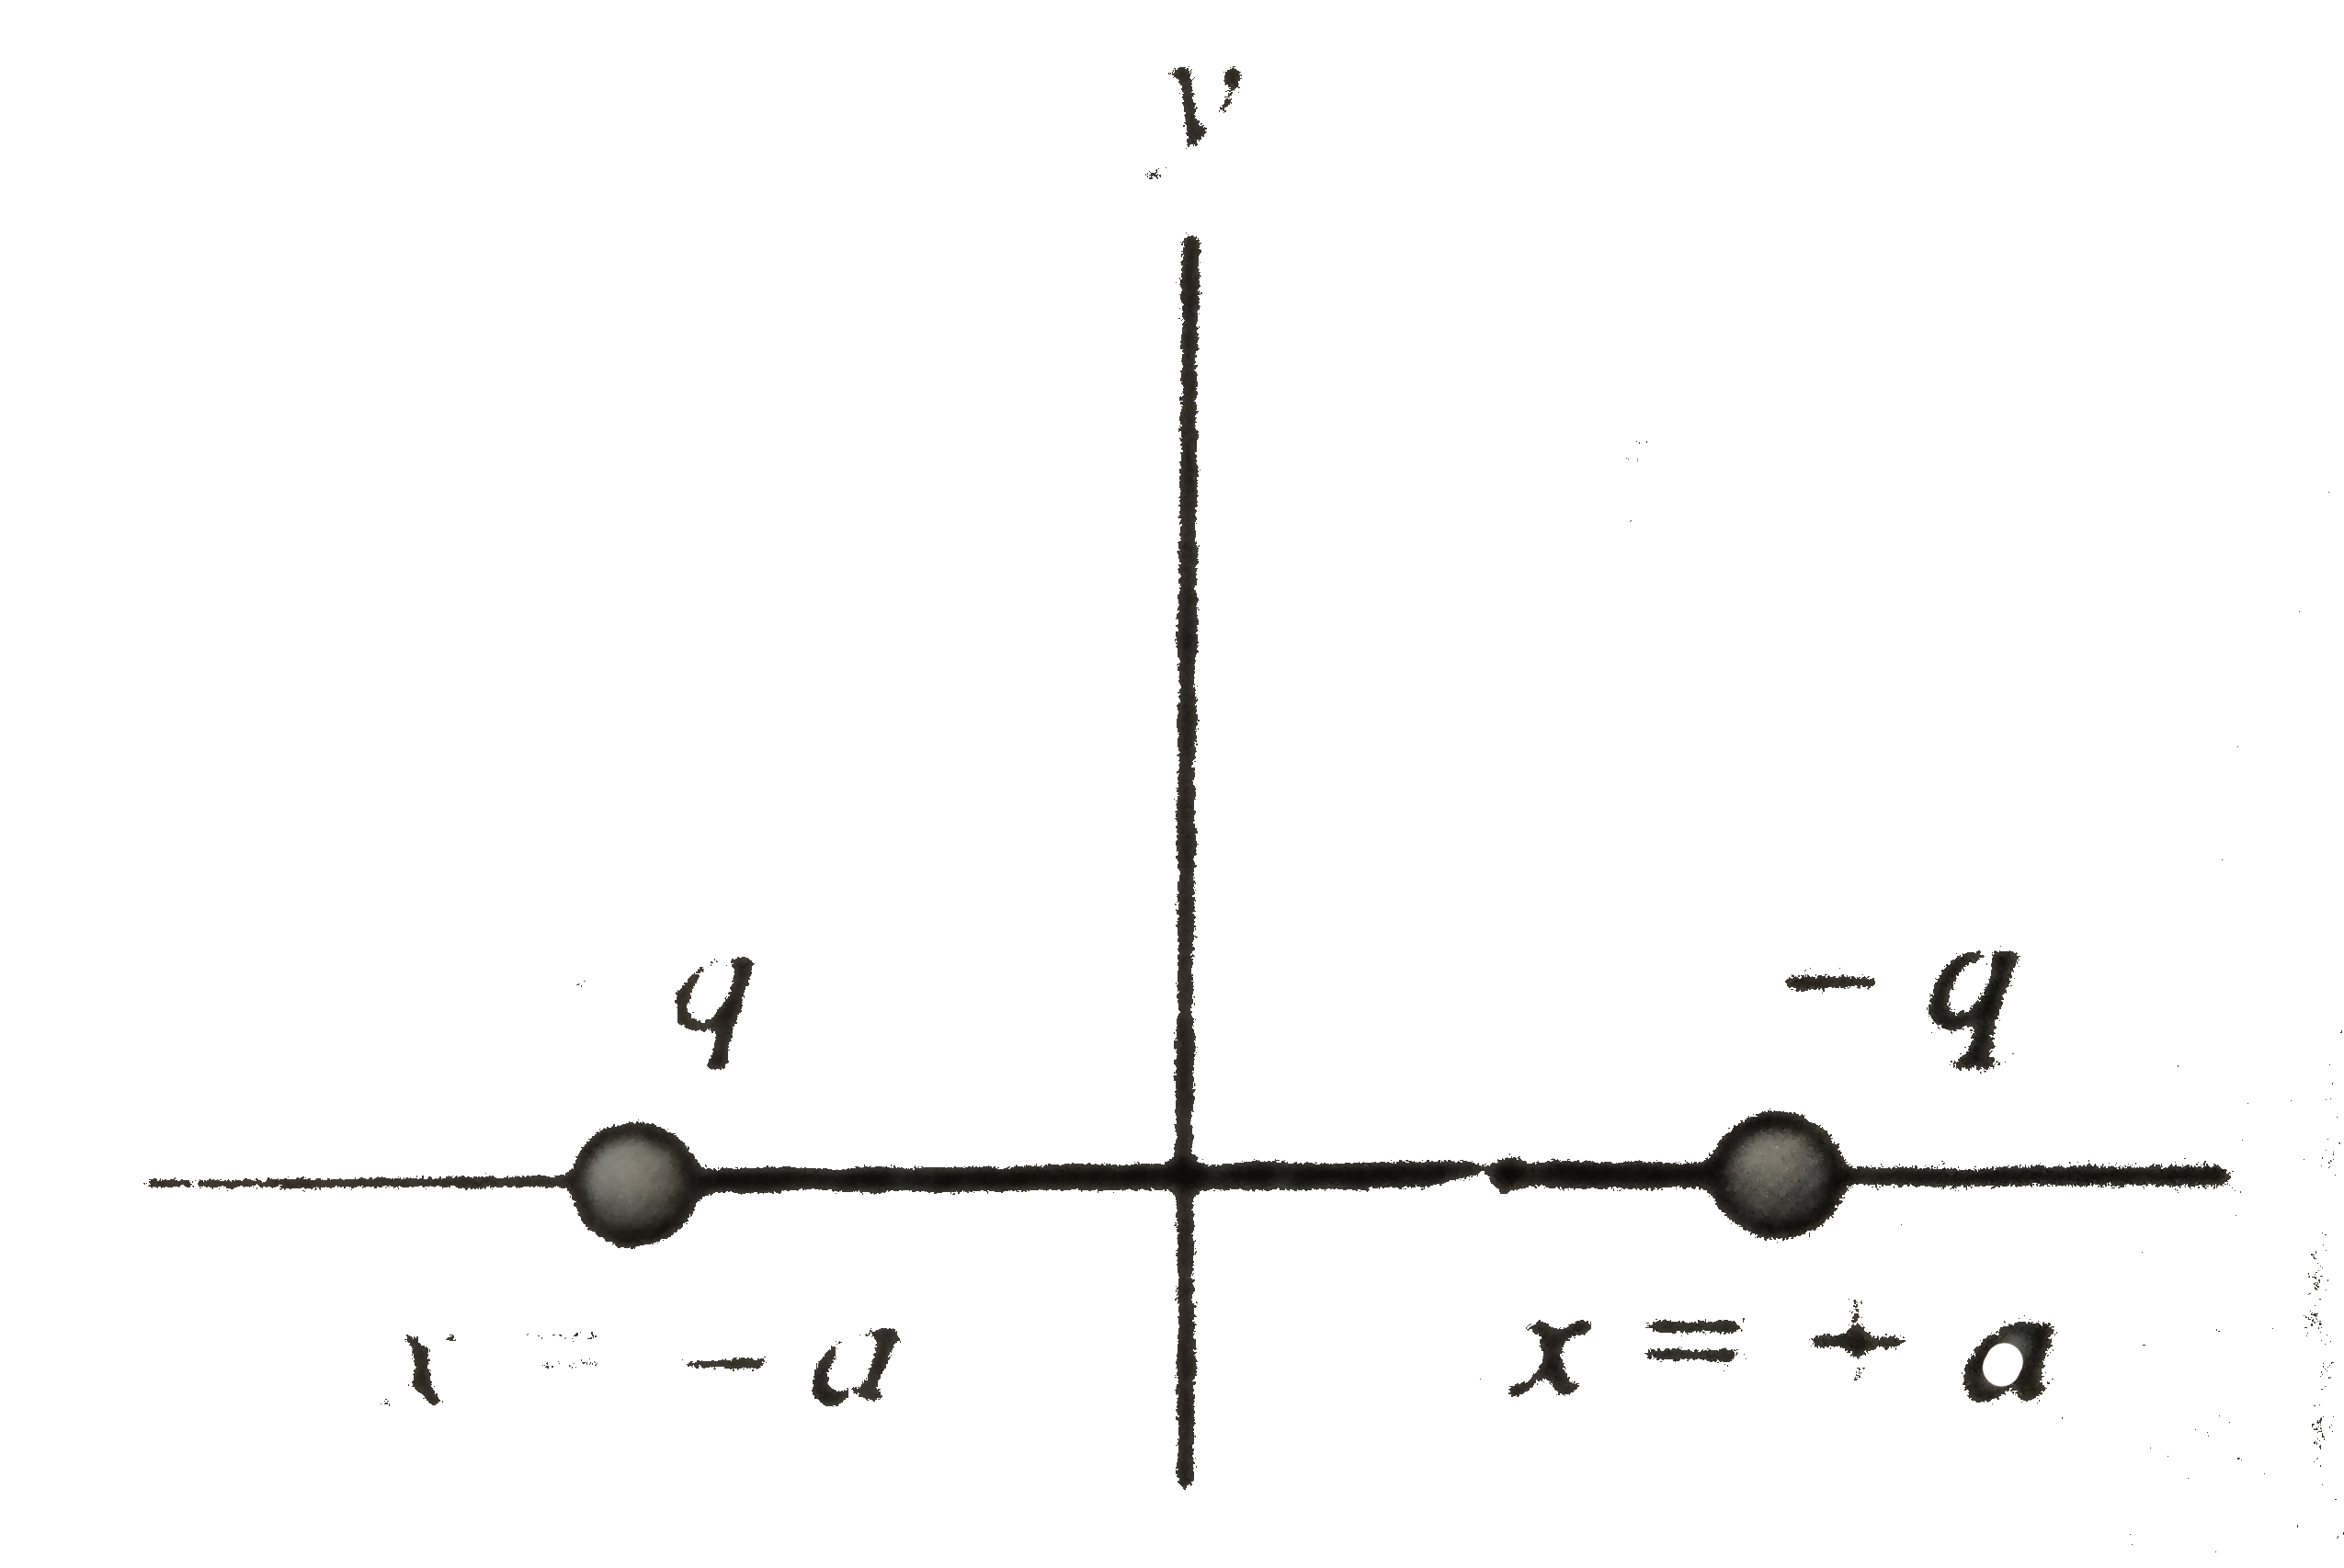
We can divide the x-axis into three region:
Region I (left of the charges): The field due to the left charge dominates and acts towards-x direction.
Region II(between the charges): From −a<x<0, the field of left charge dominater and acts towads.+x direction. At x=0,
resulant electric field is zero. from 0<x<a, the field of right charge dominaters and acts towards +x direction
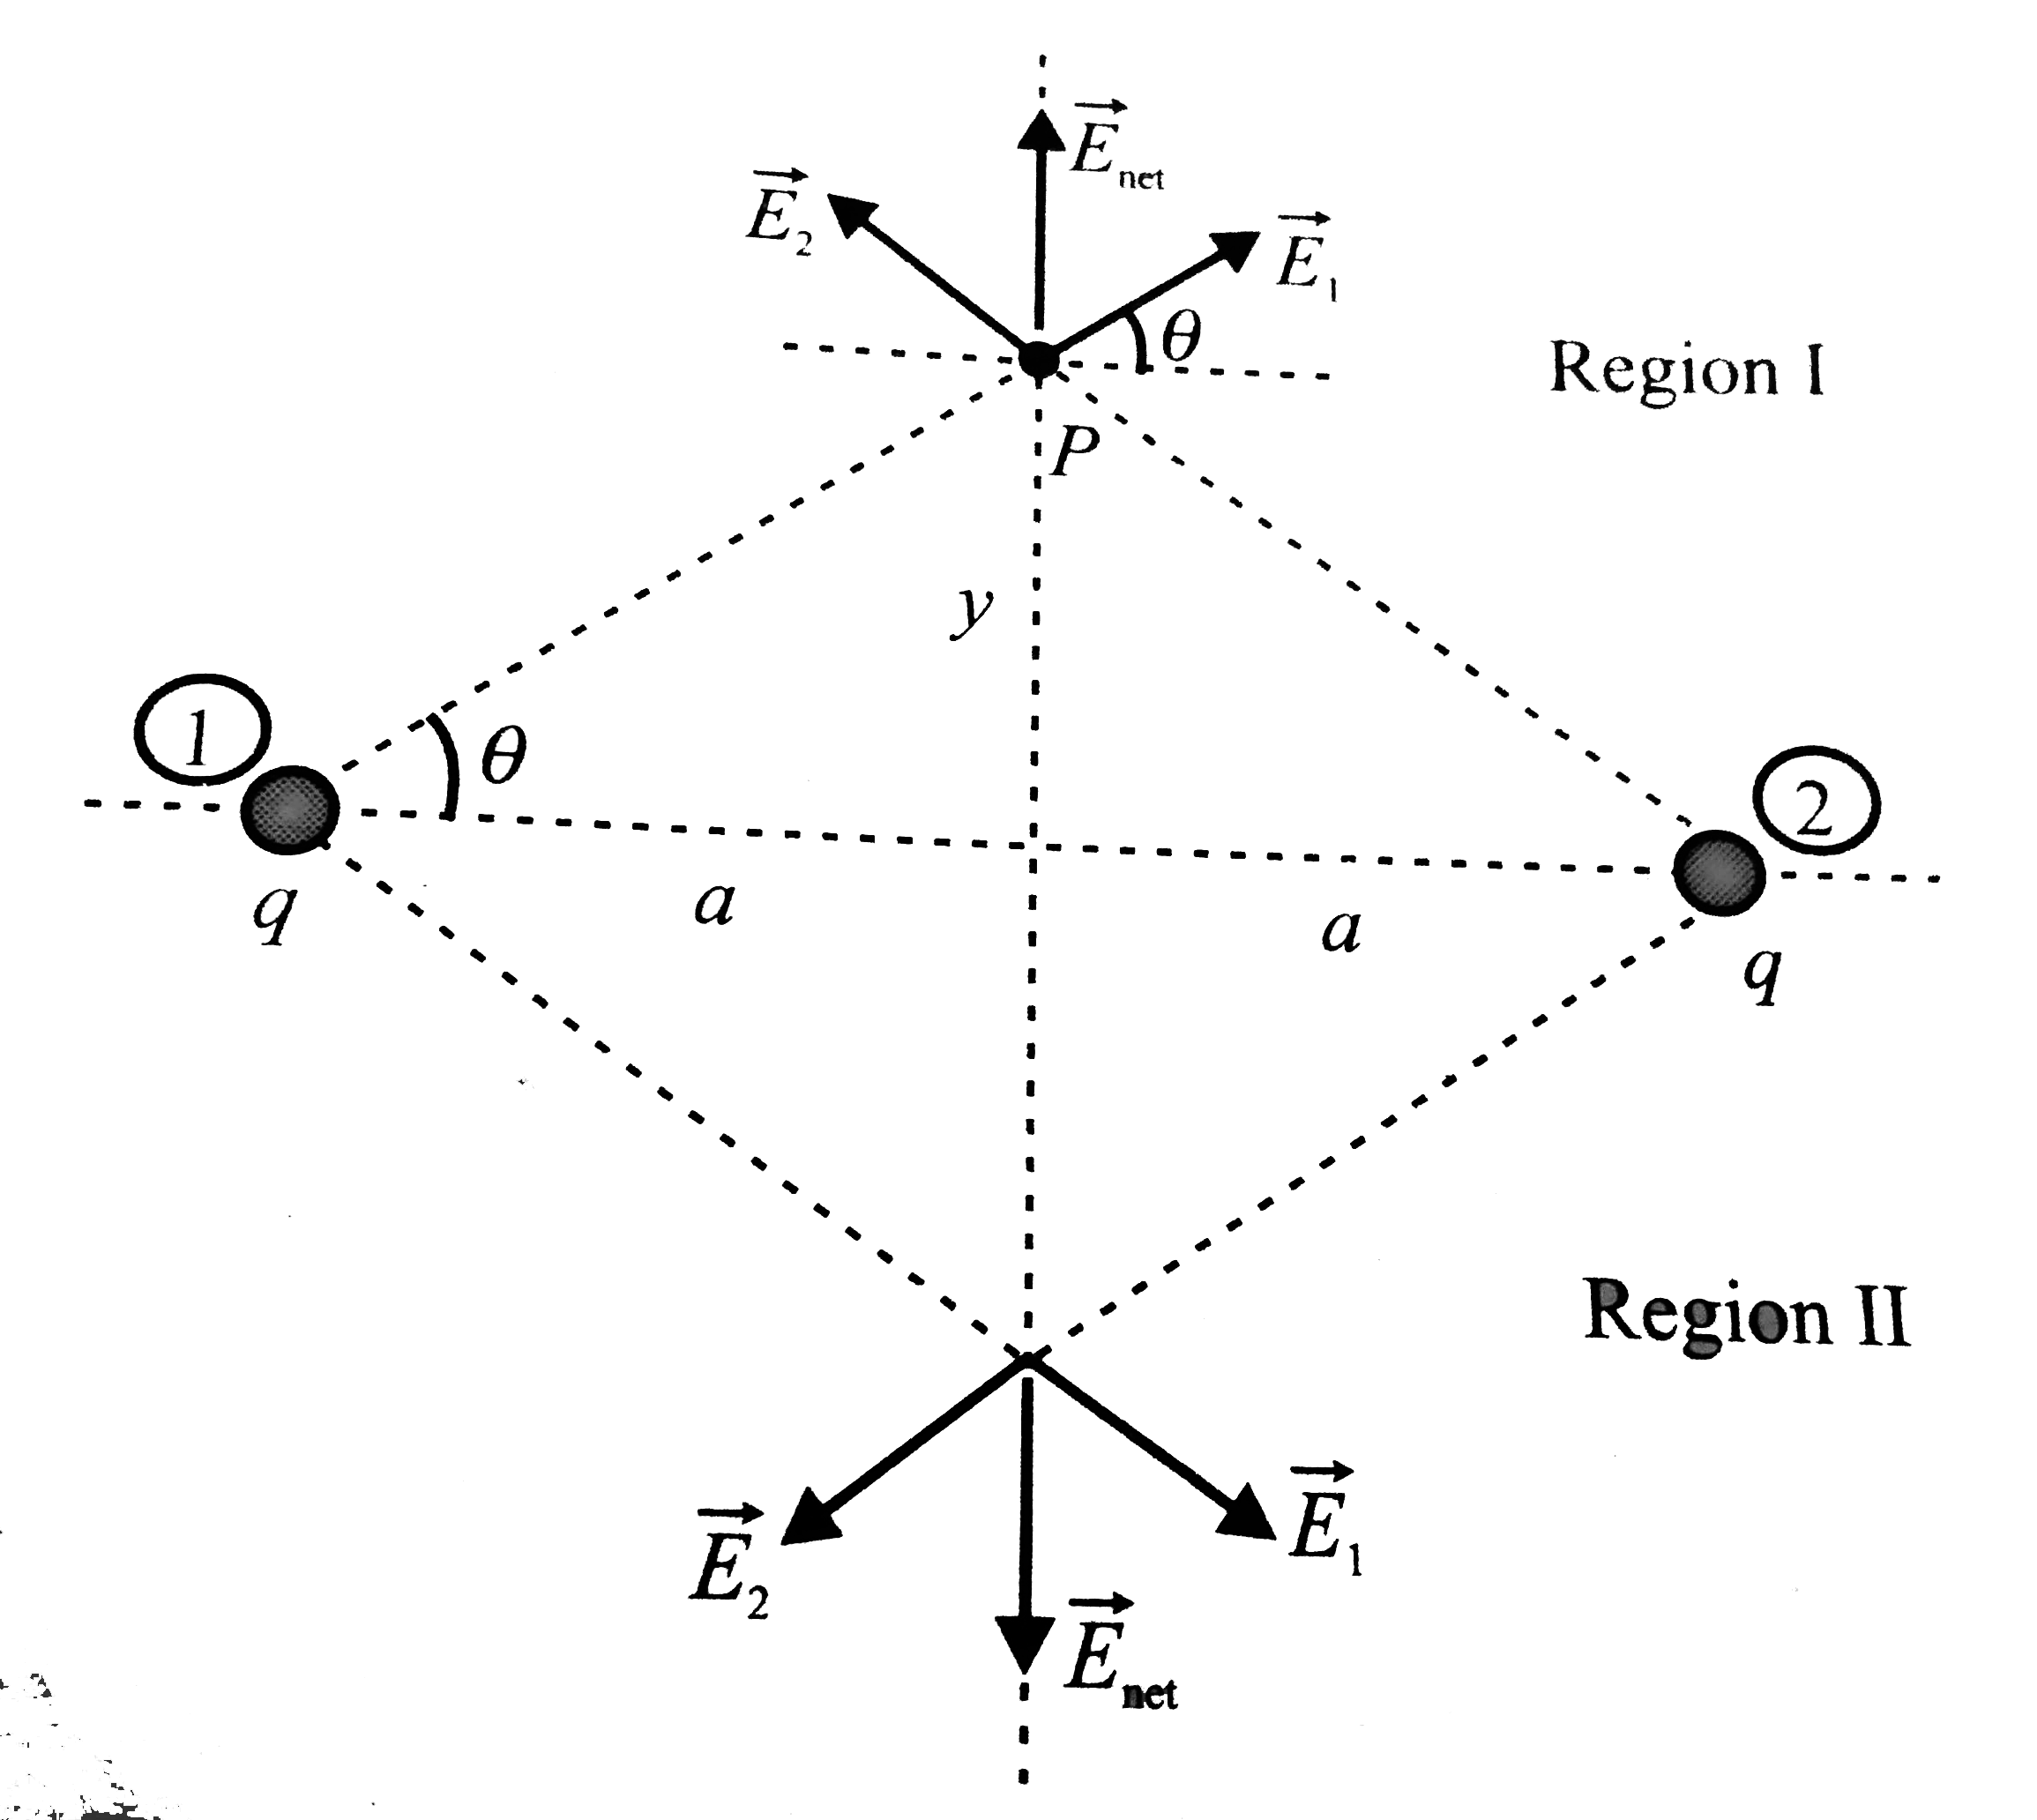
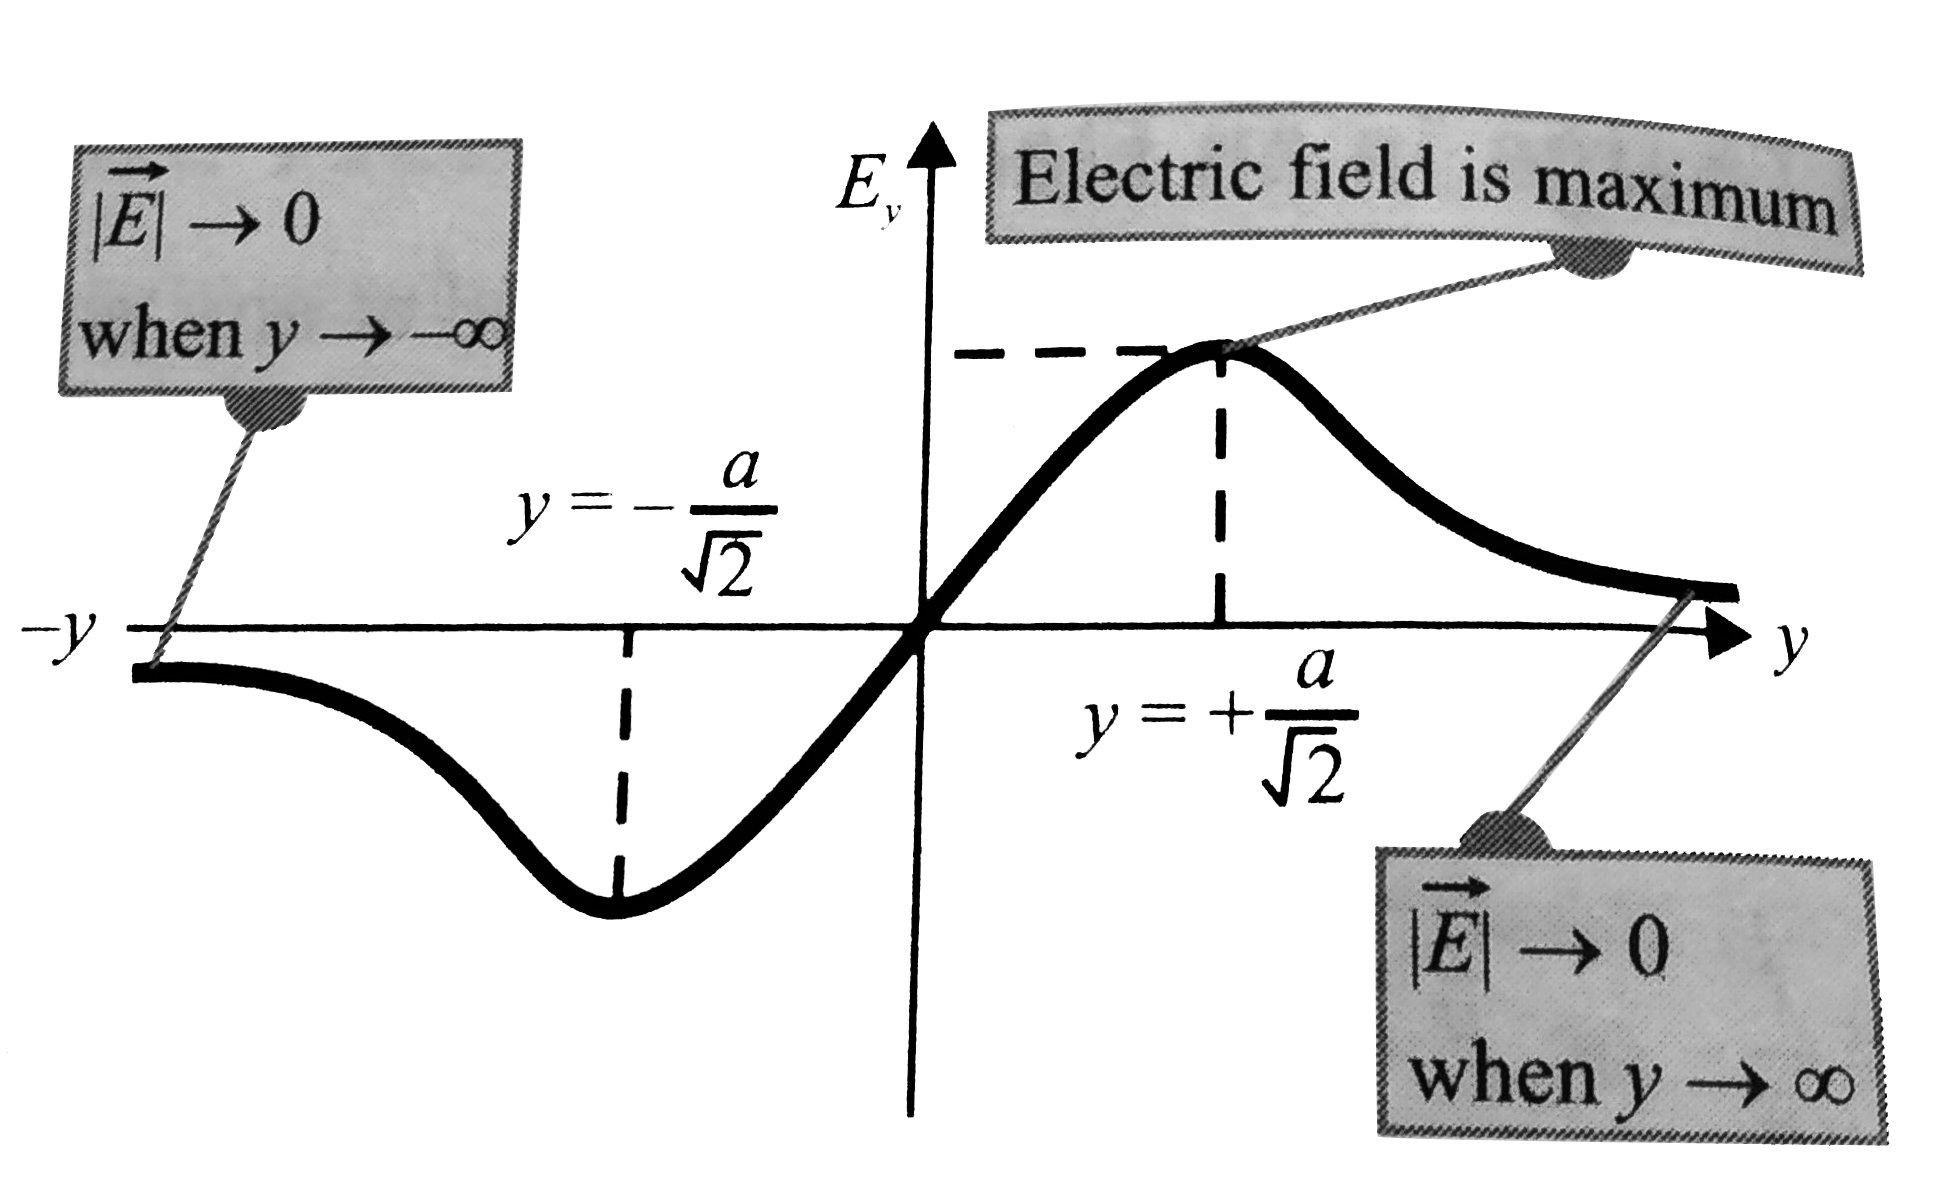
Variation of →E in the y-axis: we can divide the y-axis in two regions:
Resion I (above y-axis): Electric field is along +y direction.

Resion II (below y-axis ): Electric field is along y direction. Net electric field at P at a distance y from origin is
Enet=|E1|sinθ+|E2|sinθ=2|E1|sinθ as ∣∣→E1∣∣=∣∣→E2∣∣
=214πε0q(a2+y2)y(a2+y2)1/2
Hence, Enet=14πε0qy(a2+y2)3/2
For maximum or minimum value of Enet
dEnetdy=0=q2πε0[y(32)(a2+y2)−5/2(2y)+(a2+y2)−3/2(1)]
or, y=±a√2
Topper's Solved these Questions
- COULOMB LAW AND ELECTRIC FIELDBOOK - CENGAGE PHYSICS ENGLISHCHAPTER - COULOMB LAW AND ELECTRIC FIELDEXERCISE - Solved examples
10 Videos
- COULOMB LAW AND ELECTRIC FIELDBOOK - CENGAGE PHYSICS ENGLISHCHAPTER - COULOMB LAW AND ELECTRIC FIELDEXERCISE - Exercises
58 Videos
- CENGAGE PHYSICS DPPBOOK - CENGAGE PHYSICS ENGLISHCHAPTER - CENGAGE PHYSICS DPPEXERCISE - subjective type
51 Videos
- ELECTRIC CURRENT & CIRCUITSBOOK - CENGAGE PHYSICS ENGLISHCHAPTER - ELECTRIC CURRENT & CIRCUITSEXERCISE - Kirchhoff s law and simple circuits
15 Videos
Similar Questions
Three charges are placed along x-axis at x = - a x = 0 and x = a as shown in the figure. The potential energy of the system is

View SolutionThree charges are placed along x- axis at x=−a,x=0 and x=a as shown . Calculate the potential energy of the system.

View SolutionIn the figure, two point charges +qand−q are placed on the x-axis at (+a,0)and(−a,0) respectively. A tiny dipole of dipolem moment (p) is kept at the origin along the y-axis. The torque on the dipole equals

View SolutionTwo identical positive charges are placed at x=−a and x=a. The correct variation of potential V along the x-axis is given by
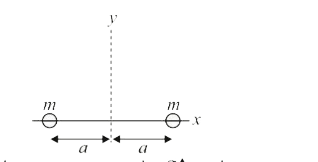
View SolutionTwo identical spherical balls, each of mass m, are placed as shown in figure. Plot the variation of g(gravitation intensity) along the x-axis due to both the masses.
View SolutionIn the graph shown in fig. the time is plotted along x-axis. Which quantity associated with the projectile motion is plotted along the y -axis:-
View SolutionTwo point charges (Q each are placed at (0,y) and (0-y) A point charge q of the same polarity can move along the x-axis. Then
View SolutionThe charges - q, Q, -q are placed along x-axis at x = 0, x = a and x = 2a. If the potential energy of the system is zero, then Q:q is
View Solution3 charges are placed in a circle of radius d as shown in figure. Find the electric field along x-axis at centre of circle.
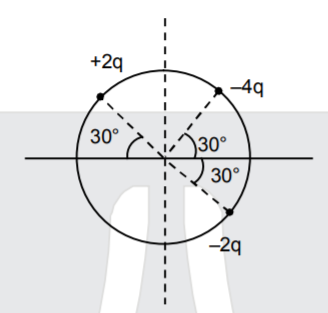
View Solution3 charges are placed in a circle of radius d as shown in figure. Find the electric field along x-axis at centre of circle.

View Solution
