Figure shows the VT diagram for helium gas in a cyclic process. Find the ratio of maximum and minimum pressure.
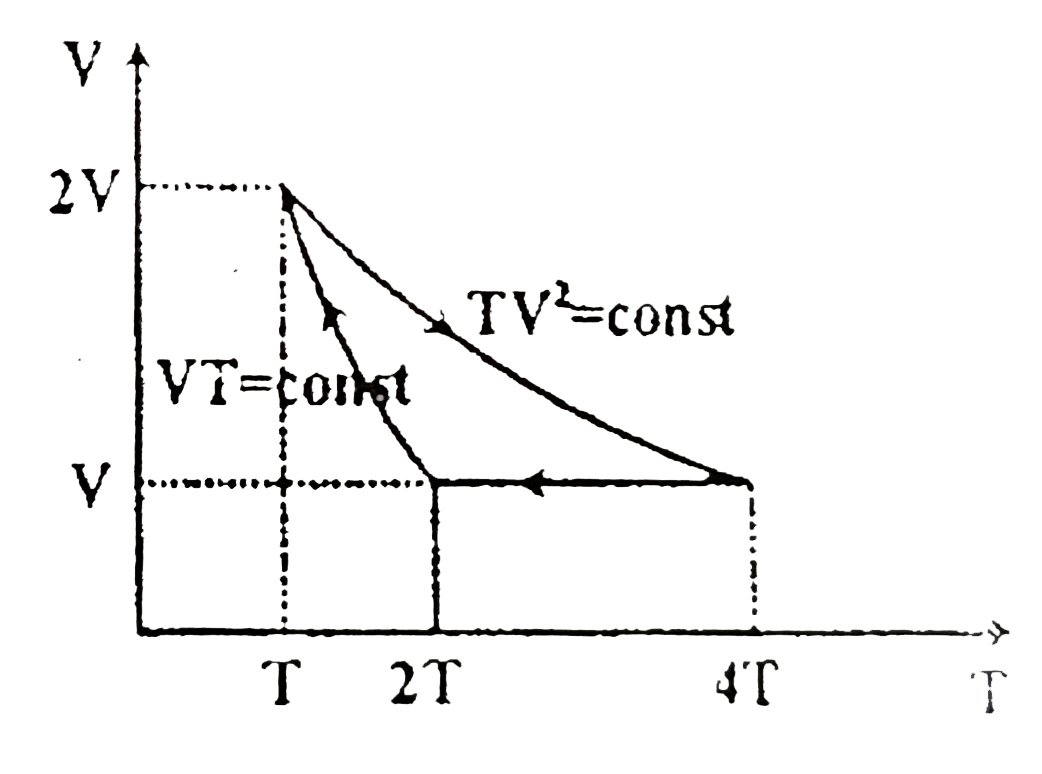
Step by step video & image solution for Figure shows the VT diagram for helium gas in a cyclic process. Find the ratio of maximum and minimum pressure. by Physics experts to help you in doubts & scoring excellent marks in Class 12 exams.
Updated on:21/07/2023Topper's Solved these Questions
- GMP ASSESMENTBOOK - FIITJEECHAPTER - GMP ASSESMENTEXERCISE - Objective problems
215 Videos
- GMP ASSESMENTBOOK - FIITJEECHAPTER - GMP ASSESMENTEXERCISE - Assertion & Reason
15 Videos
- GENERAL PHYSICSBOOK - FIITJEECHAPTER - GENERAL PHYSICSEXERCISE - MATRIX MATCH TYPE
3 Videos
- GRAVITATIONBOOK - FIITJEECHAPTER - GRAVITATIONEXERCISE - Numerical based Question
2 Videos
Similar Questions
Knowledge Check
In a cyclic process, the internal energy of the gas
AincreasesBdecreasesCremains constant,Dbecome zero.In a cyclic process, the internal energy of the gas
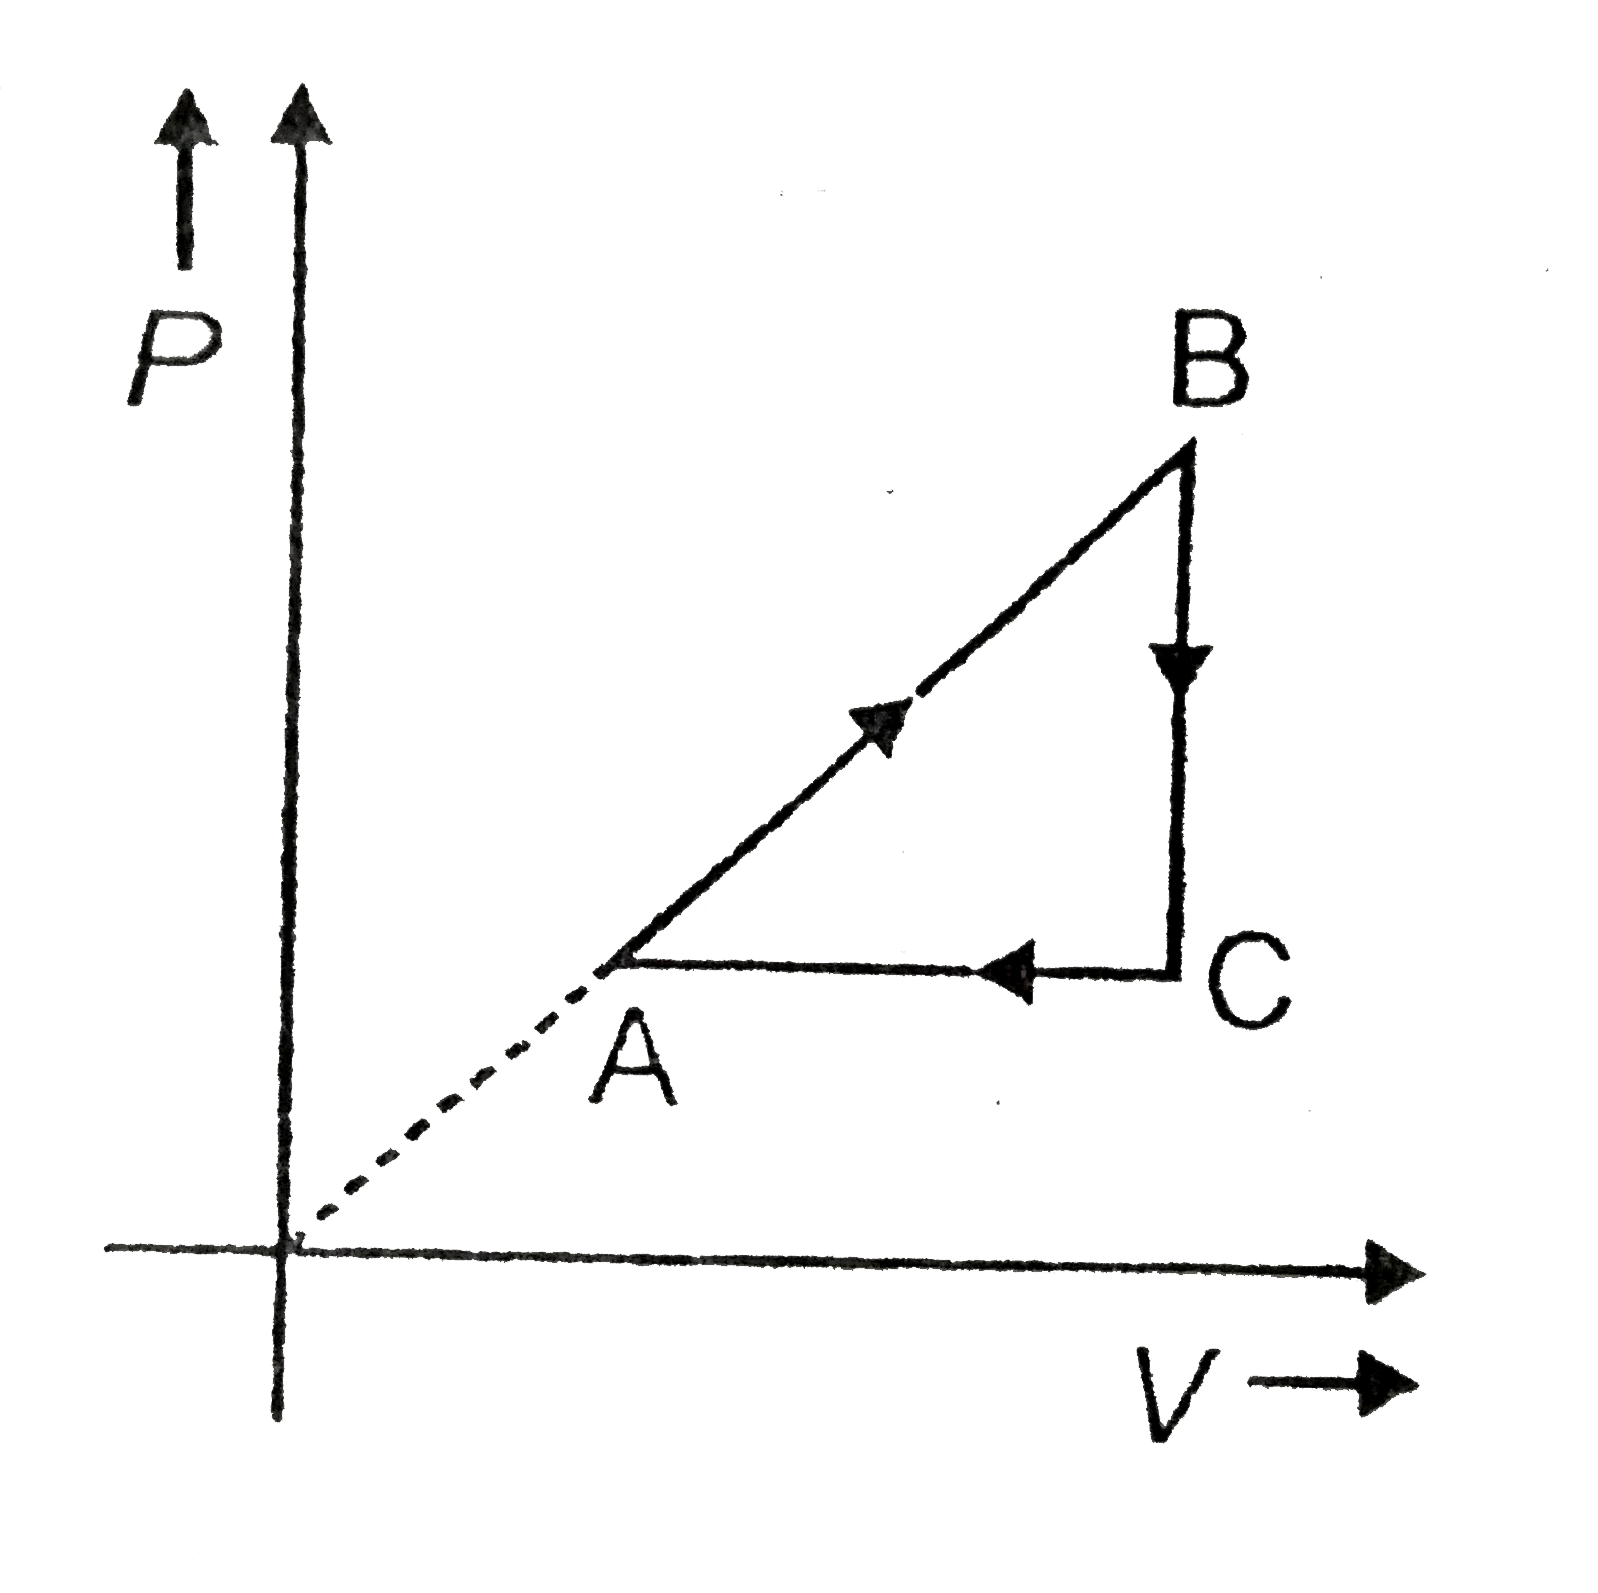
AIncreasesBDecreasesCRemains constantDBecomes zeroA monoatomic gas undergoes a cyclic process as shown in the figure. The idealgas follows the equation T=bV2 for the process B→C. During the cycle, the ratio of maximum to minimum pressure is 2 and heat supplied to the gas B→C is QB→C=120J Assuming usual meanings for the symbols, pick correct option (s):
 APA=PCBTATB=2CTCTB=2DQC→A→B=−130J
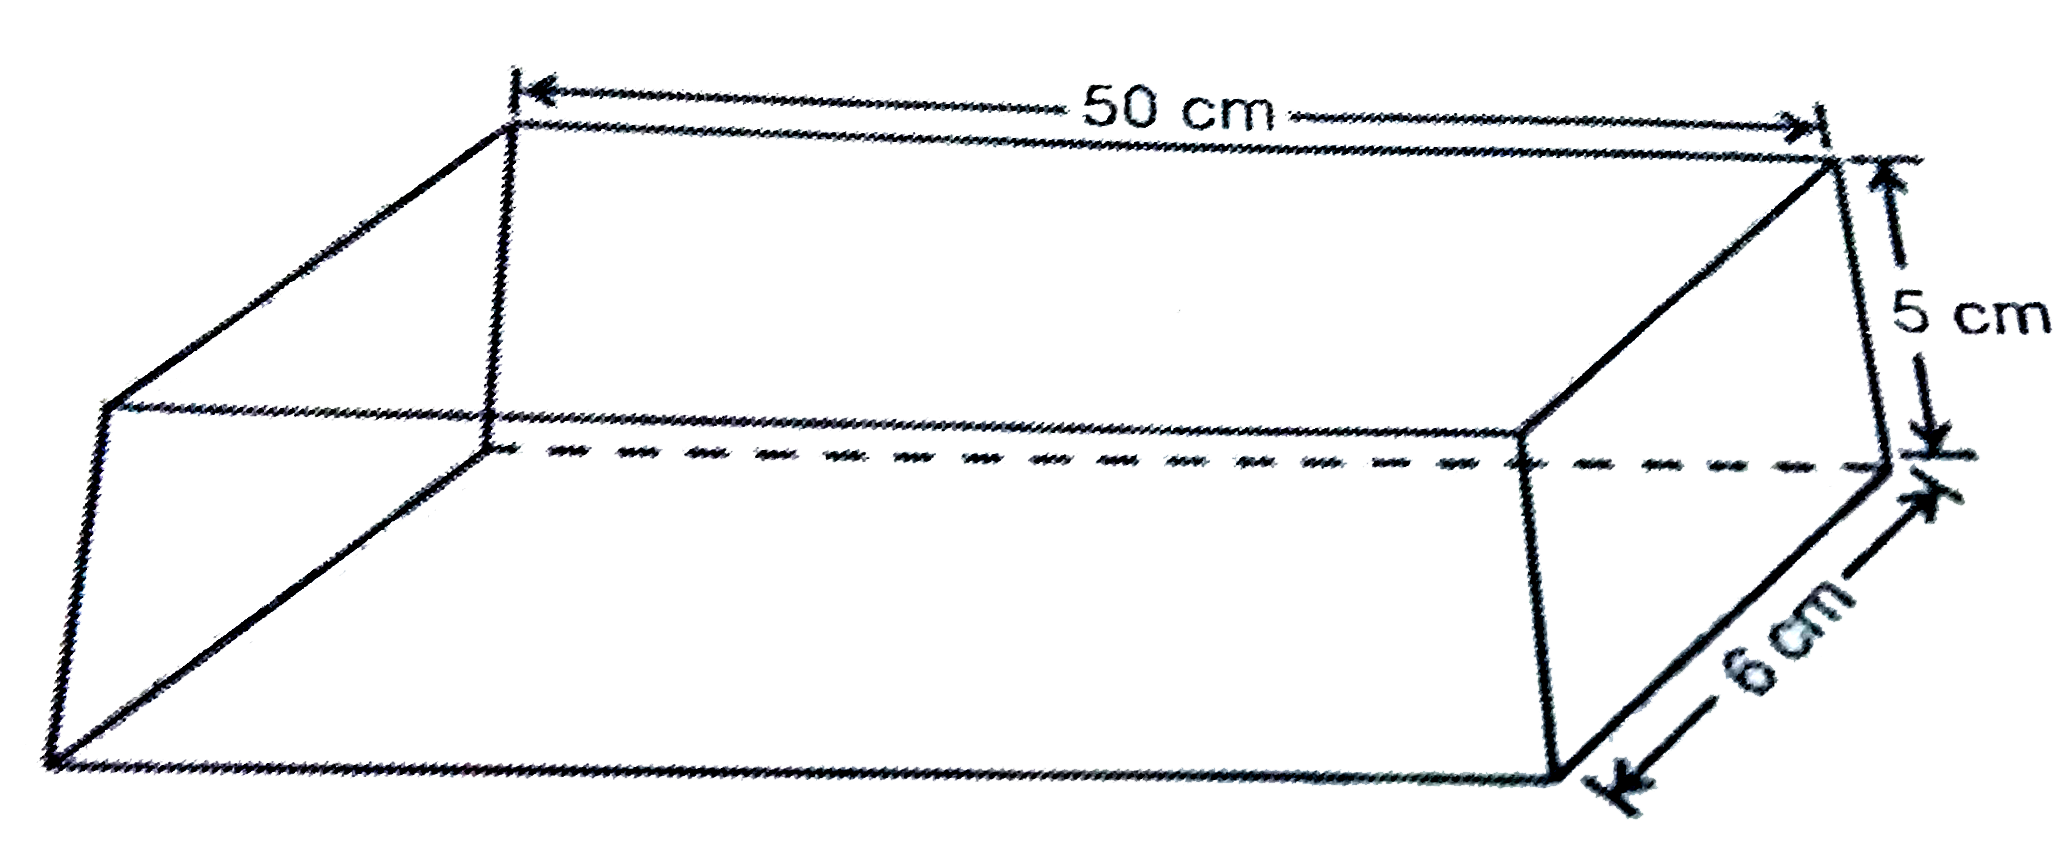
For the block shown in the figure below, find the ratio of maximum to minimum resistance, that the block can offer when connected in a circuit.
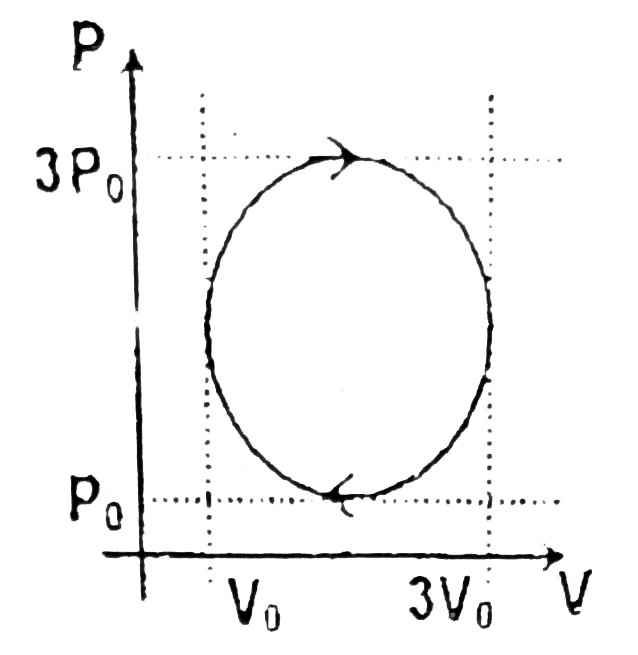
View SolutionAn ideal gas undergoes a circular cycle as shown in the figure. Find the ratio of maximum temperature of cycle to minimum temperature of cycle.
View SolutionThe figure shows P - V diagram of a thermodynamic cycle
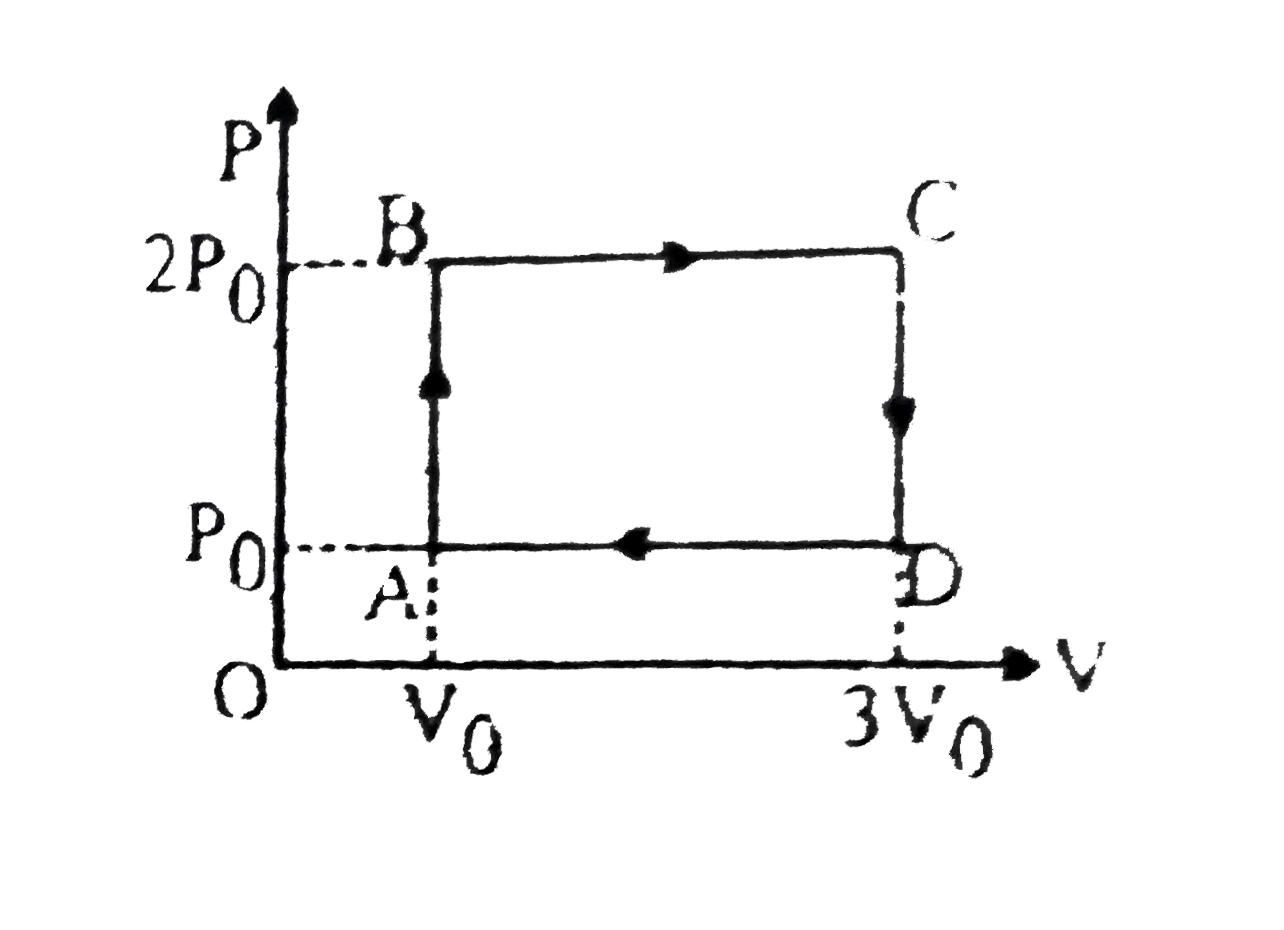
Choose the correct V - T diagram for the given cyclic process.
View SolutionThe figure shows P - V diagram of a thermodynamic cycle
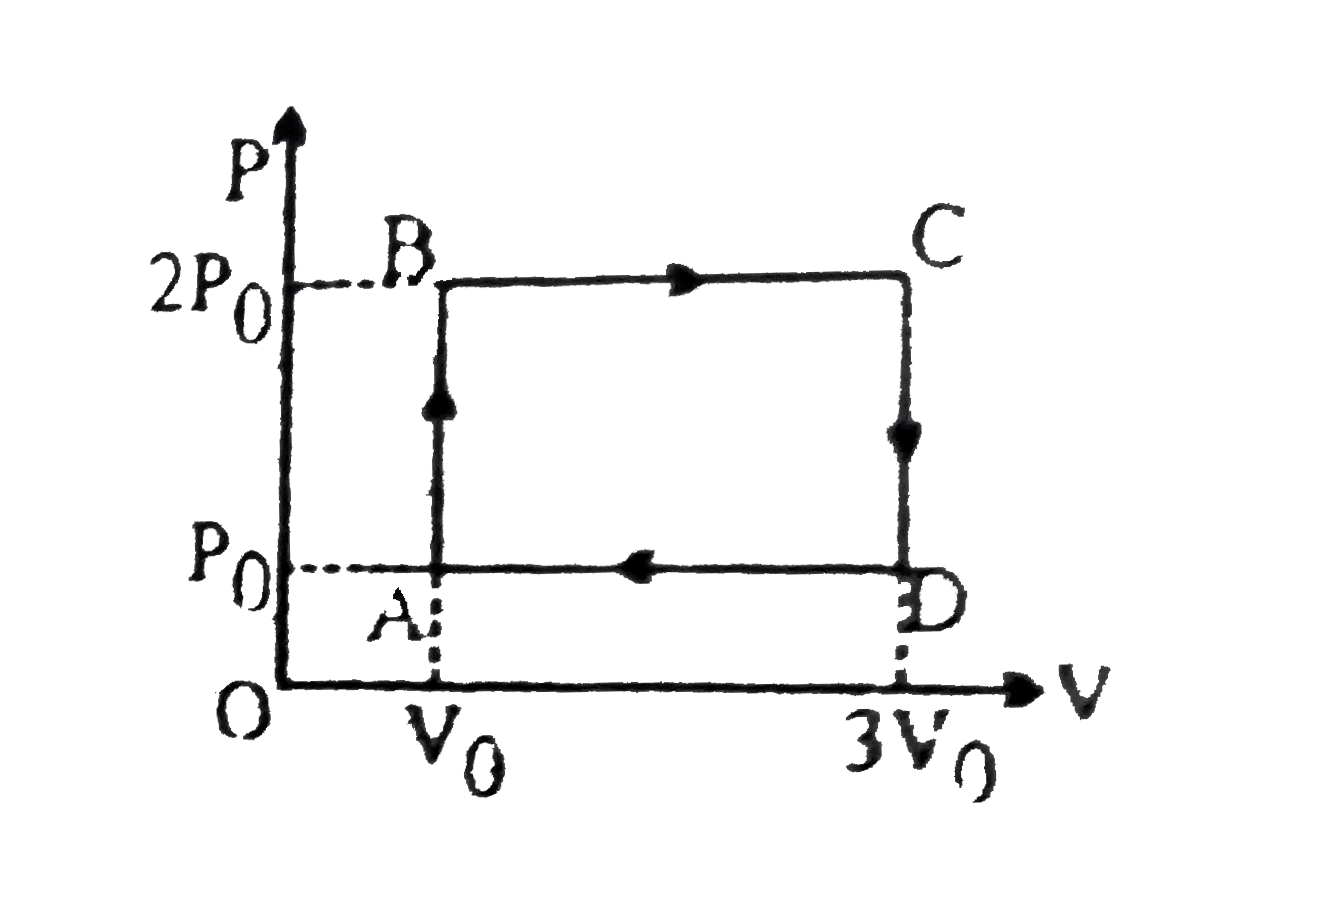
Choose the correct V - T diagram for the given cyclic process.
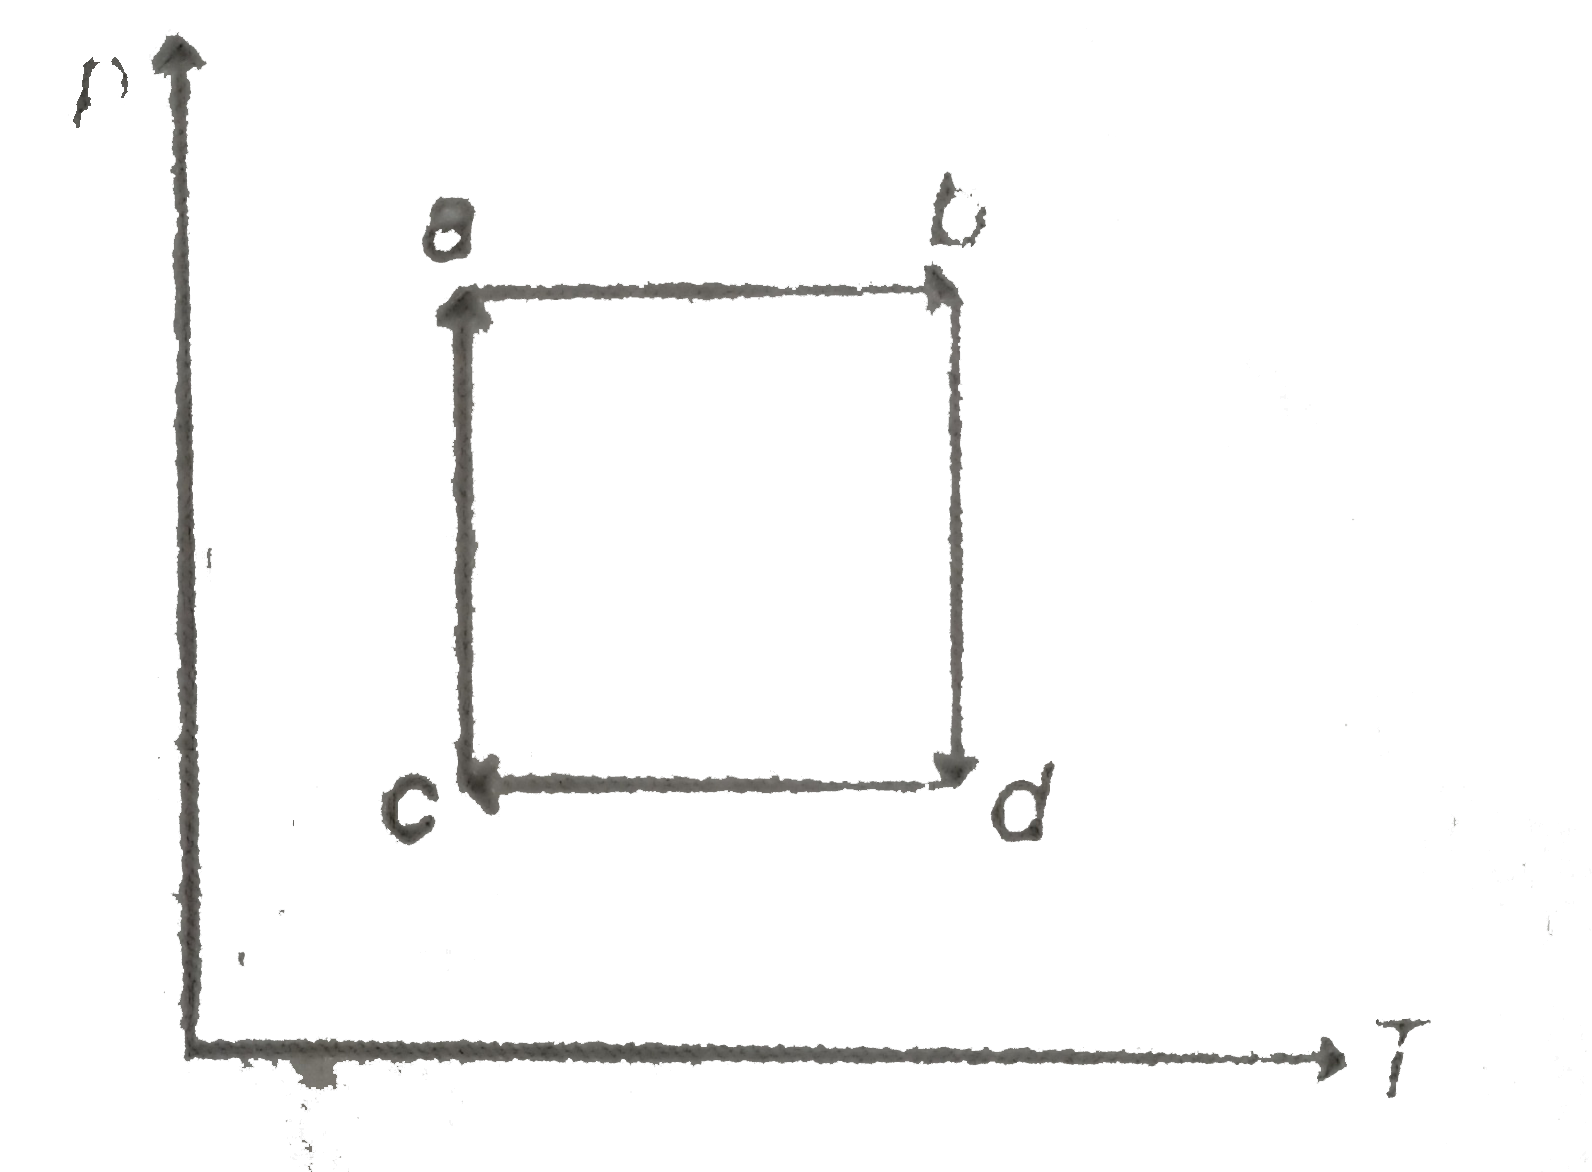
View SolutionOn a pT diagram, a cyclic process is performed as shown. Where is the volume maximum?
View Solution

 .
.