The adjoining diagram shows the spectral energy density distribution Eλ of a black body at two different temperatures. If the areas under the curves are in the ratio 16 : 1, the value of temperature T is
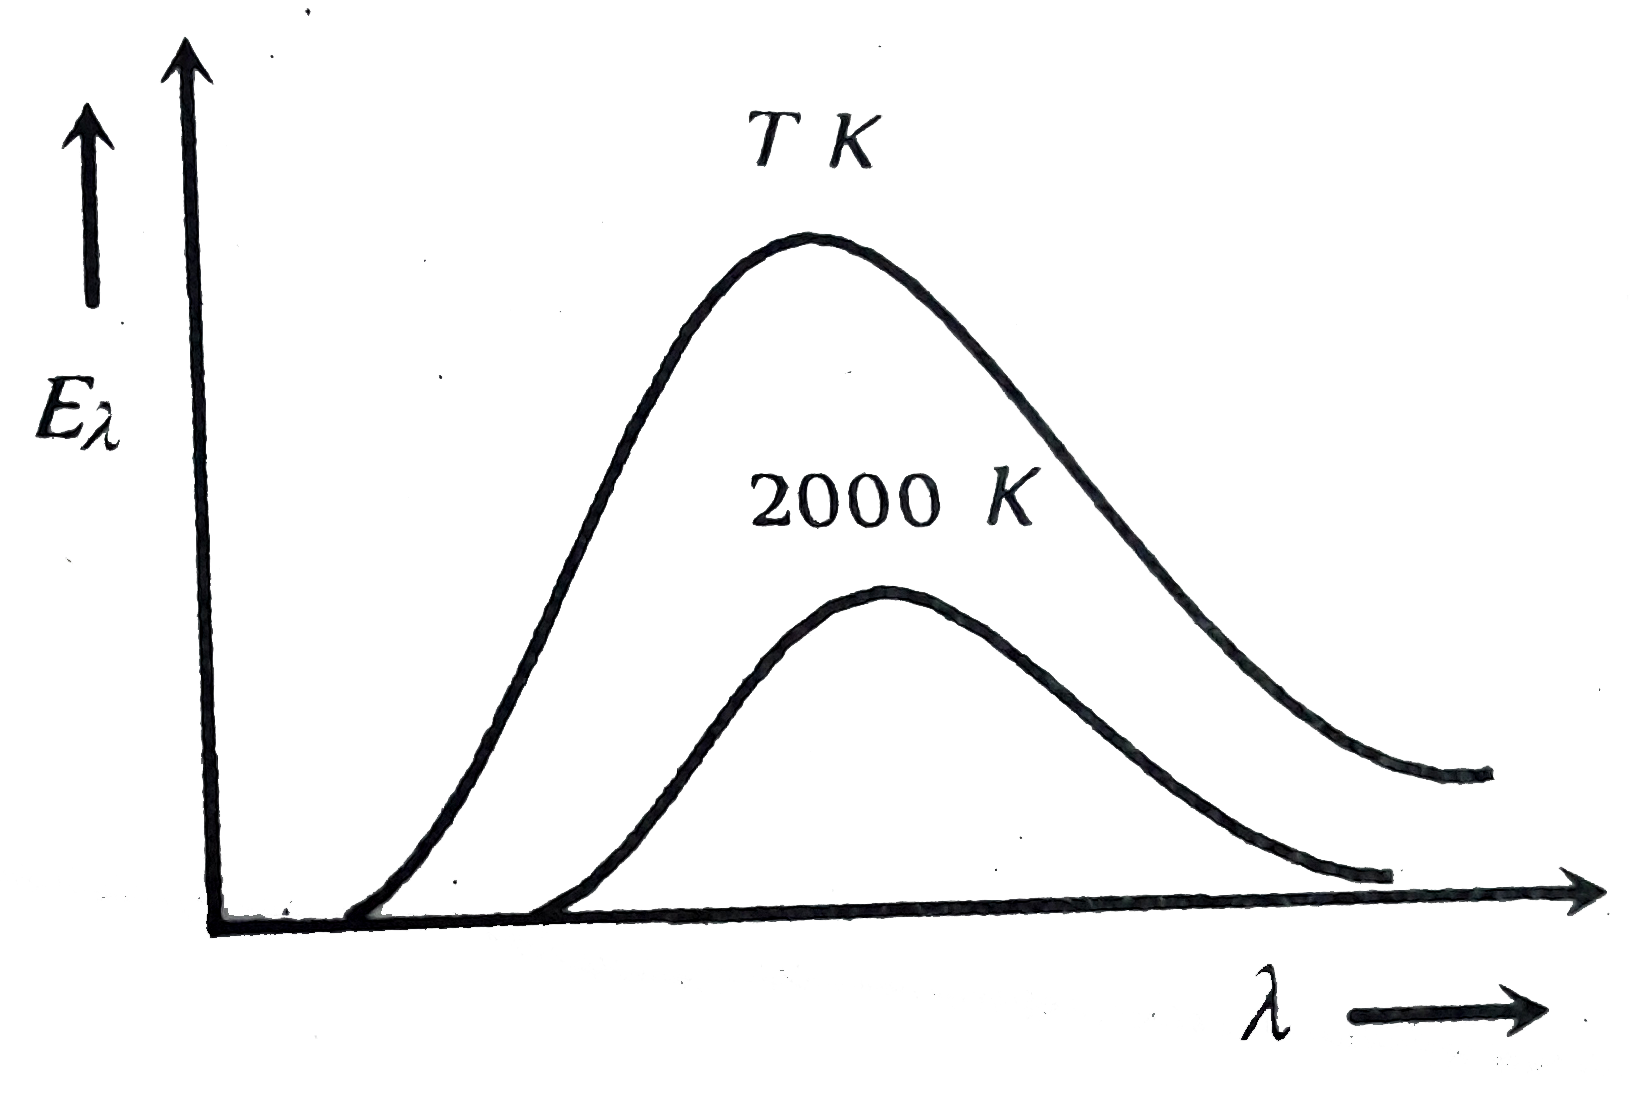
32,000 K
16,000 K
8,000 K
4,000 K
The correct Answer is:D
Step by step video, text & image solution for The adjoining diagram shows the spectral energy density distribution E_(lambda) of a black body at two different temperatures. If the areas under the curves are in the ratio 16 : 1, the value of temperature T is by Physics experts to help you in doubts & scoring excellent marks in Class 11 exams.
Topper's Solved these Questions
- BOOK - ERRORLESS CHAPTER - TRANSMISSION OF HEATEXERCISE - Assertion & Reason24videos
TRANSMISSION OF HEAT
- BOOK - ERRORLESS CHAPTER - TRANSMISSION OF HEATEXERCISE - ET Self Evaluation Test23videos
TRANSMISSION OF HEAT
- BOOK - ERRORLESS CHAPTER - TRANSMISSION OF HEATEXERCISE - Critical Thinking36videos
TRANSMISSION OF HEAT
- BOOK - ERRORLESS CHAPTER - THERMOMETRY, THERMAL EXPANSION AND CALORIMETRY EXERCISE - Self Evaluation Test15videos
THERMOMETRY, THERMAL EXPANSION AND CALORIMETRY
- BOOK - ERRORLESS CHAPTER - UNITS, DIMENSION & MEASUREMENTSEXERCISE - All Questions333videos
UNITS, DIMENSION & MEASUREMENTS
Similar Questions
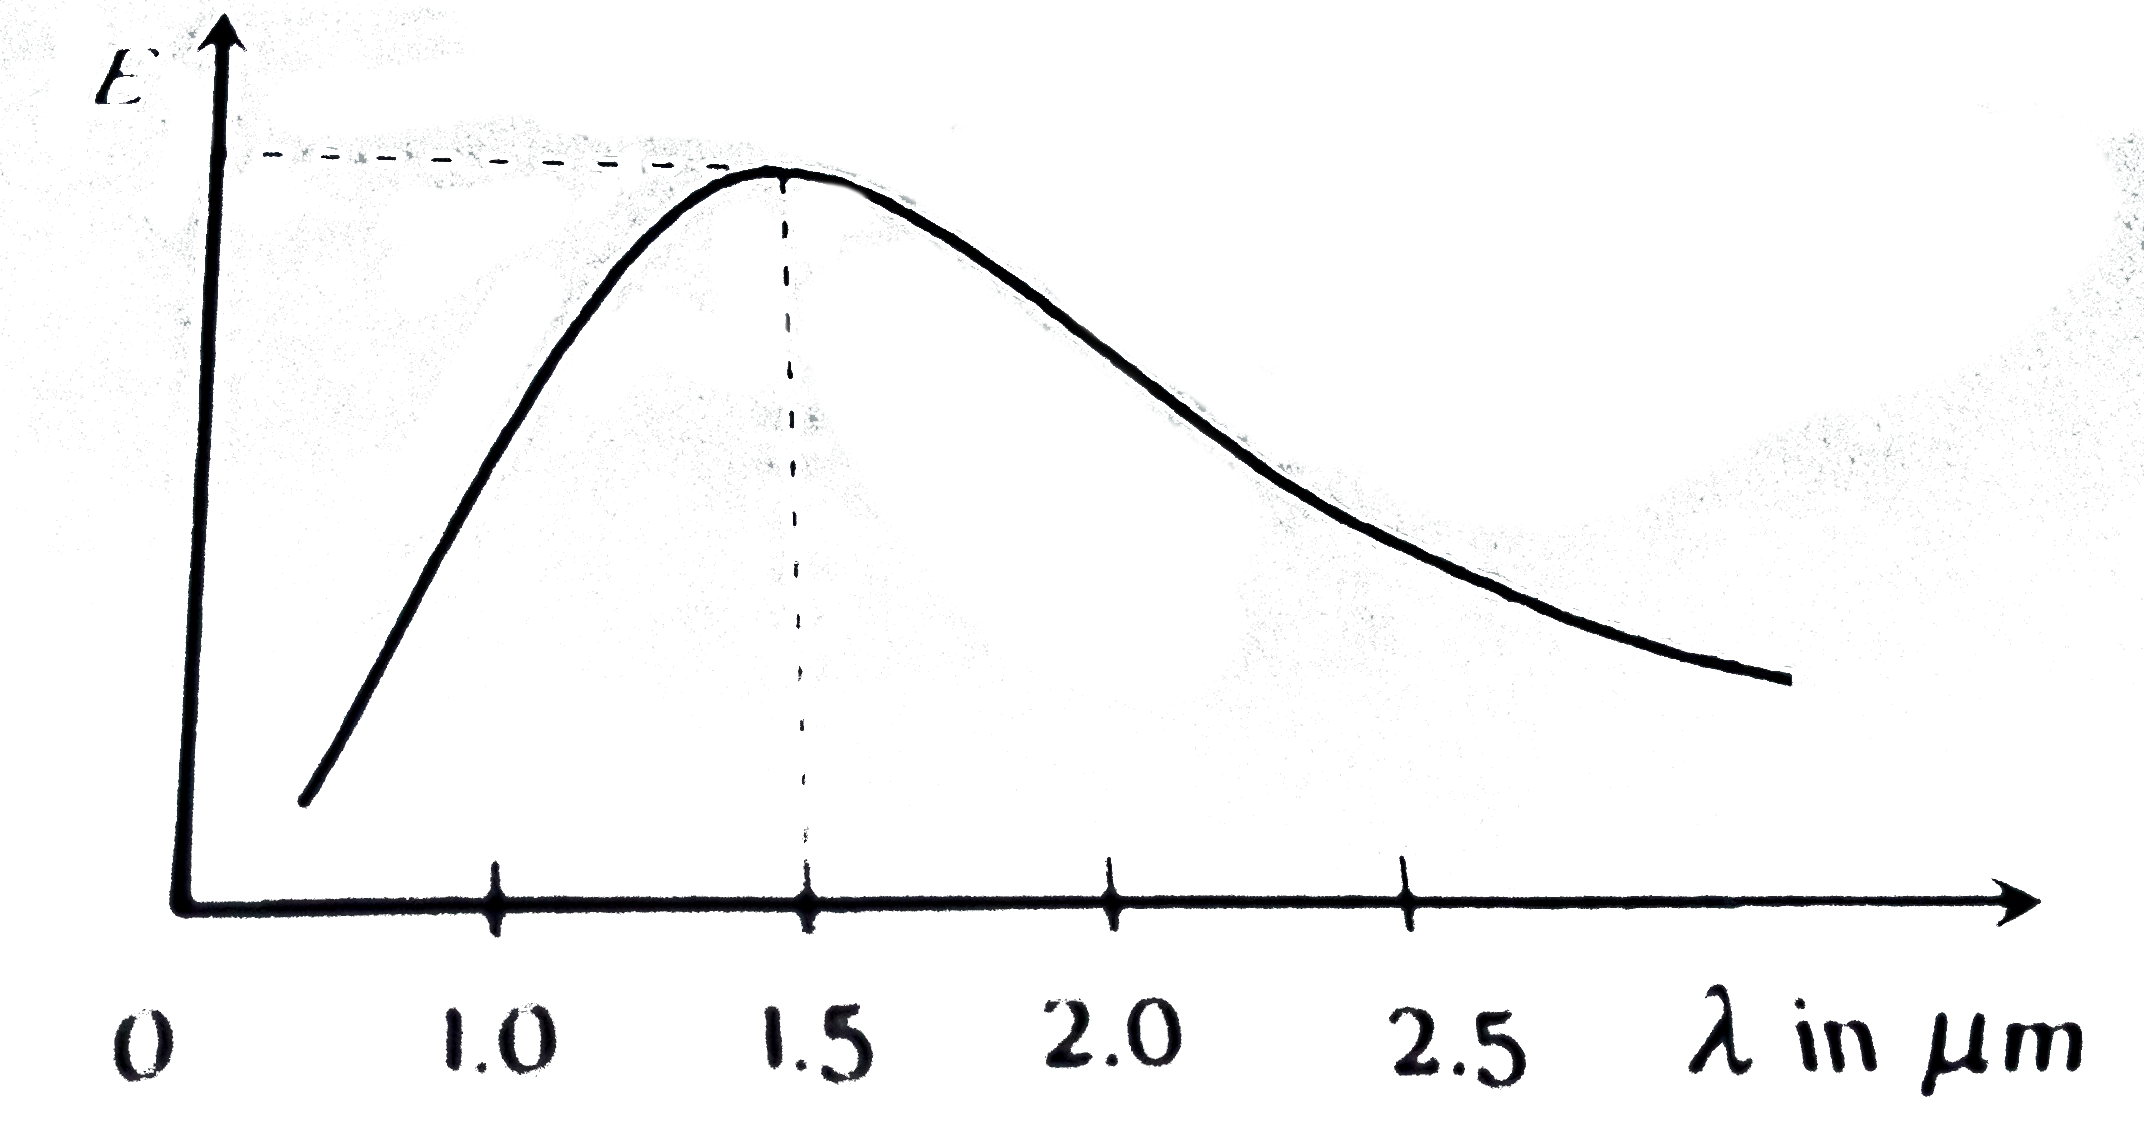
In the figure, the distribution of energy density of the radiation emitted by a black body at a given temperature is shown. The possible temperature of the black body is
 View Solution
A perfectly black body emits radiation at temperature T1K. If is to radiate at 16 times this power, its temperature T2K should be
View Solution
Knowledge Check
- Question 1 - Select One
The emission spectrum of a black body at two different temperatures are shown by curves P and Q (as shown in figure). The ratio of the areas under the two curves P and Q will be
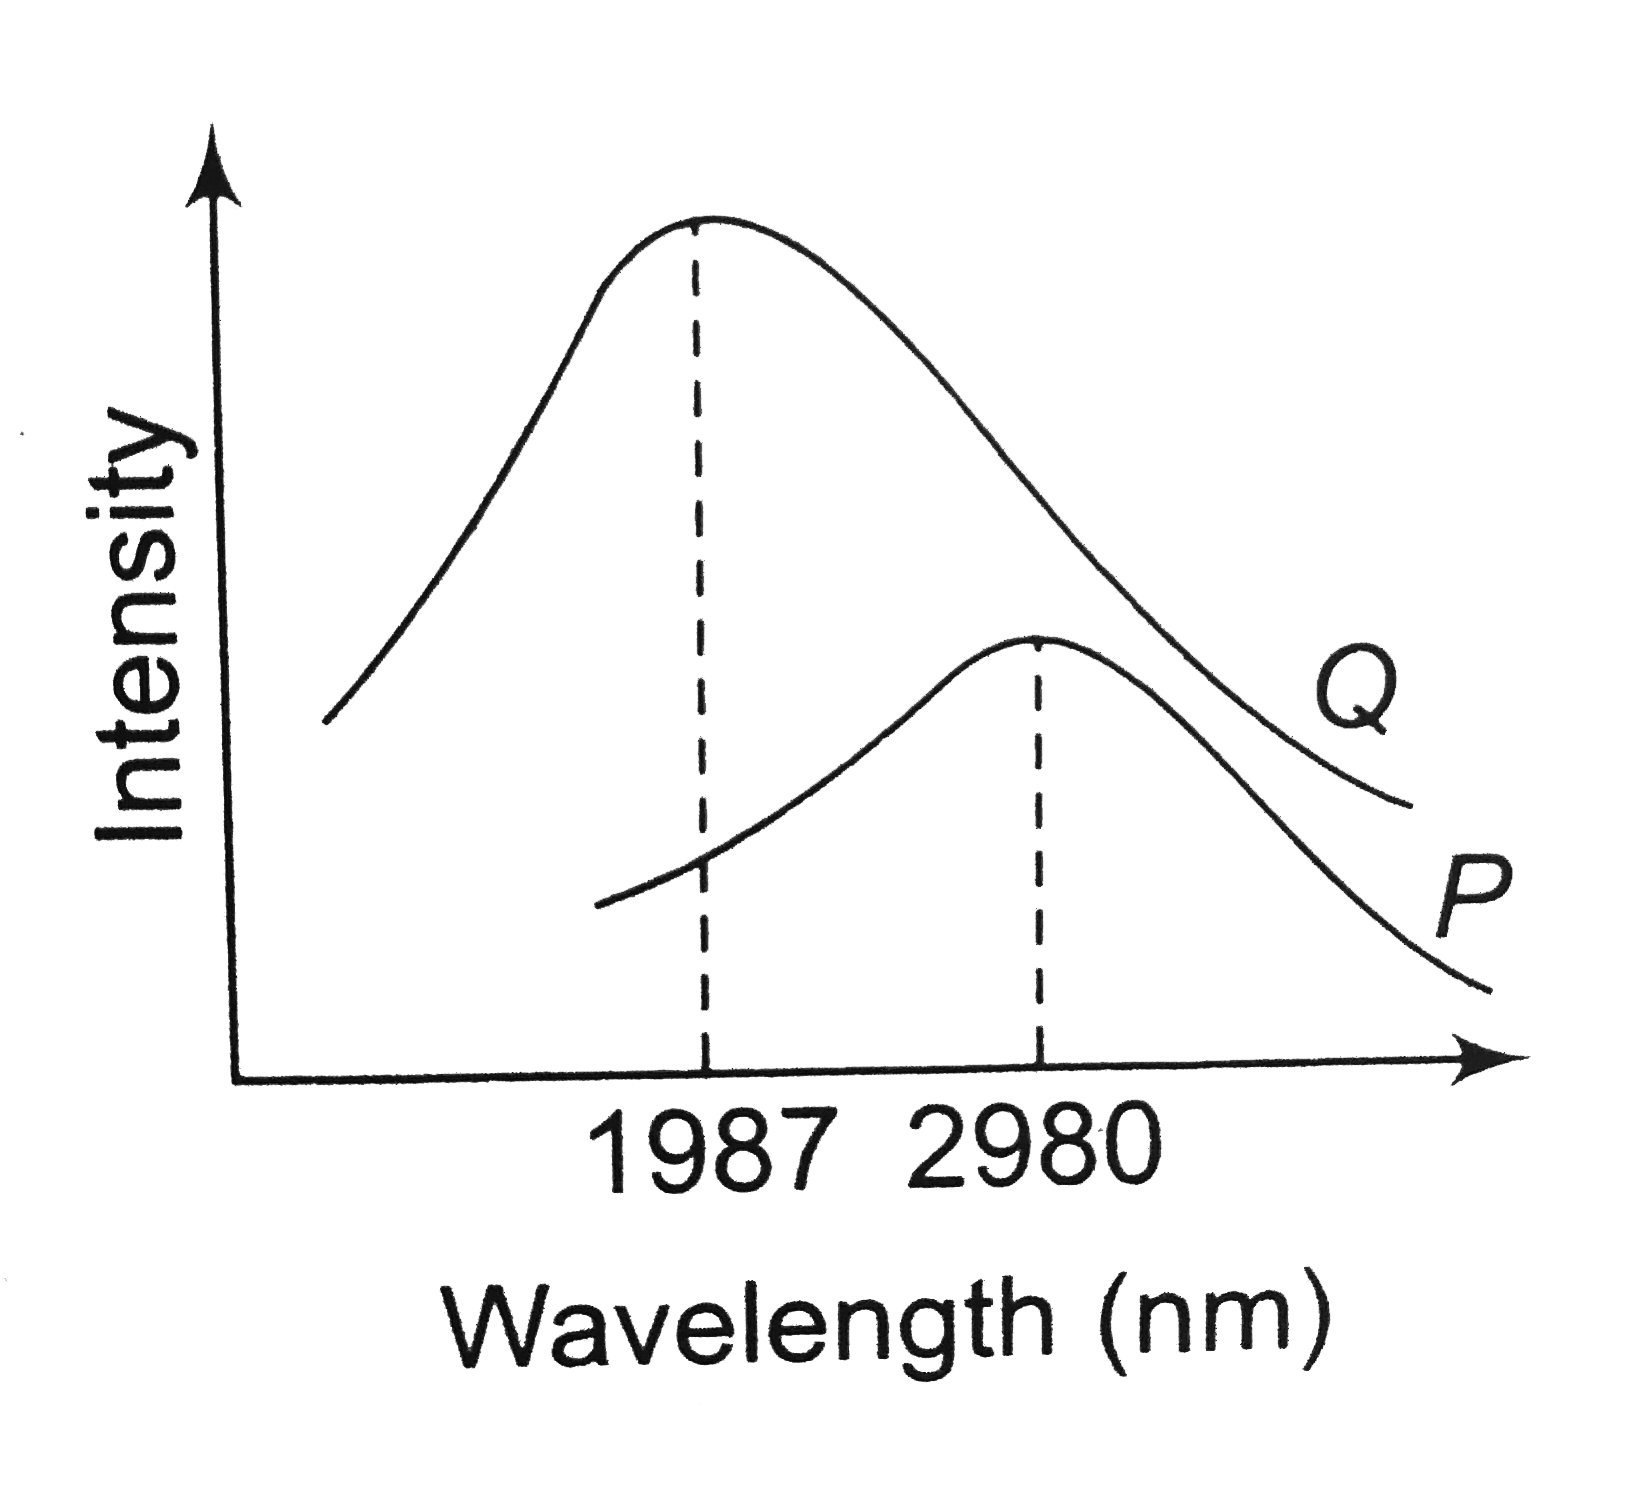 A1:16B4:9C81:256D16:81
 - Question 2 - Select One
If two bodies at different temperatures T1 and T2 are brought in thermal contact, the mean temperature T1+T22. When
Amass of two bodies are equalBpressure on two bodies are equalCtherma capacities of two bodies are equalDvolume of two bodies are equal - Question 3 - Select One
The energy distribution E with the wavelength (λ) for the black body radiation at temperature Kelvin T is shown in the figure. As the temperature is increased the maxima will
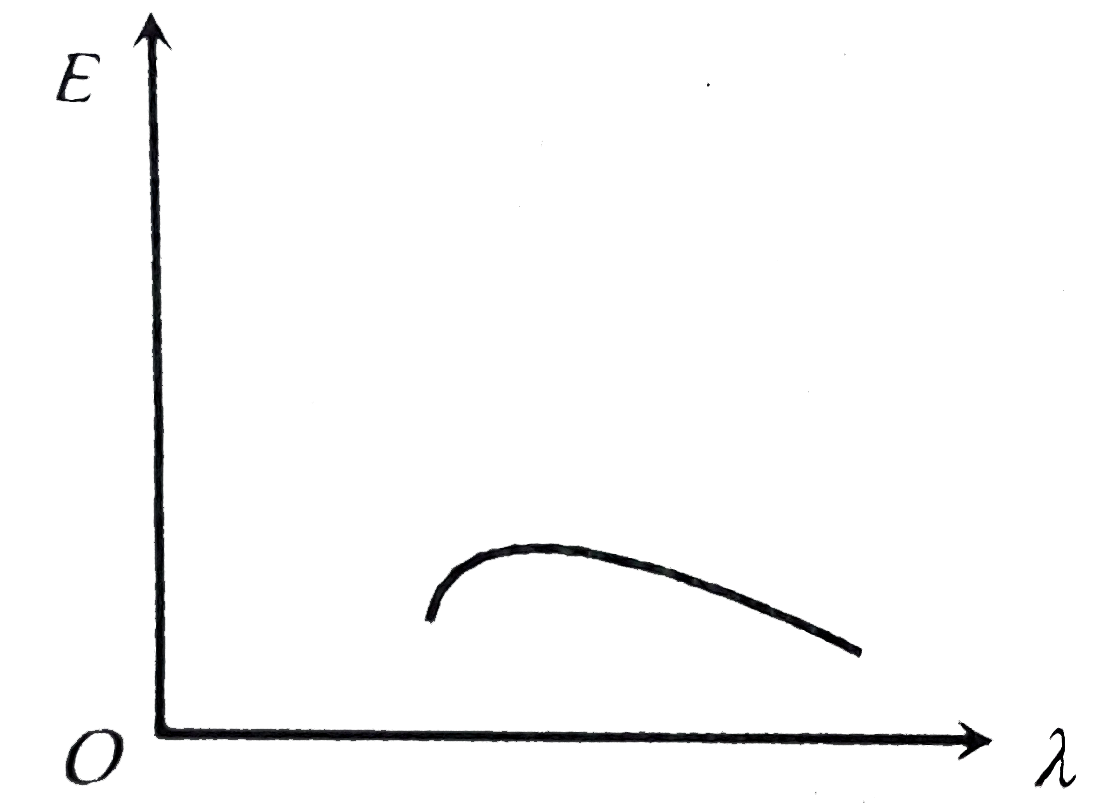 AShift towards left and become higherBRise high but will not shiftCShift towards right and become higherDShift towards left and the curve will become broader
The shows a radiant energy spectrum graph for a black body at at temperature T
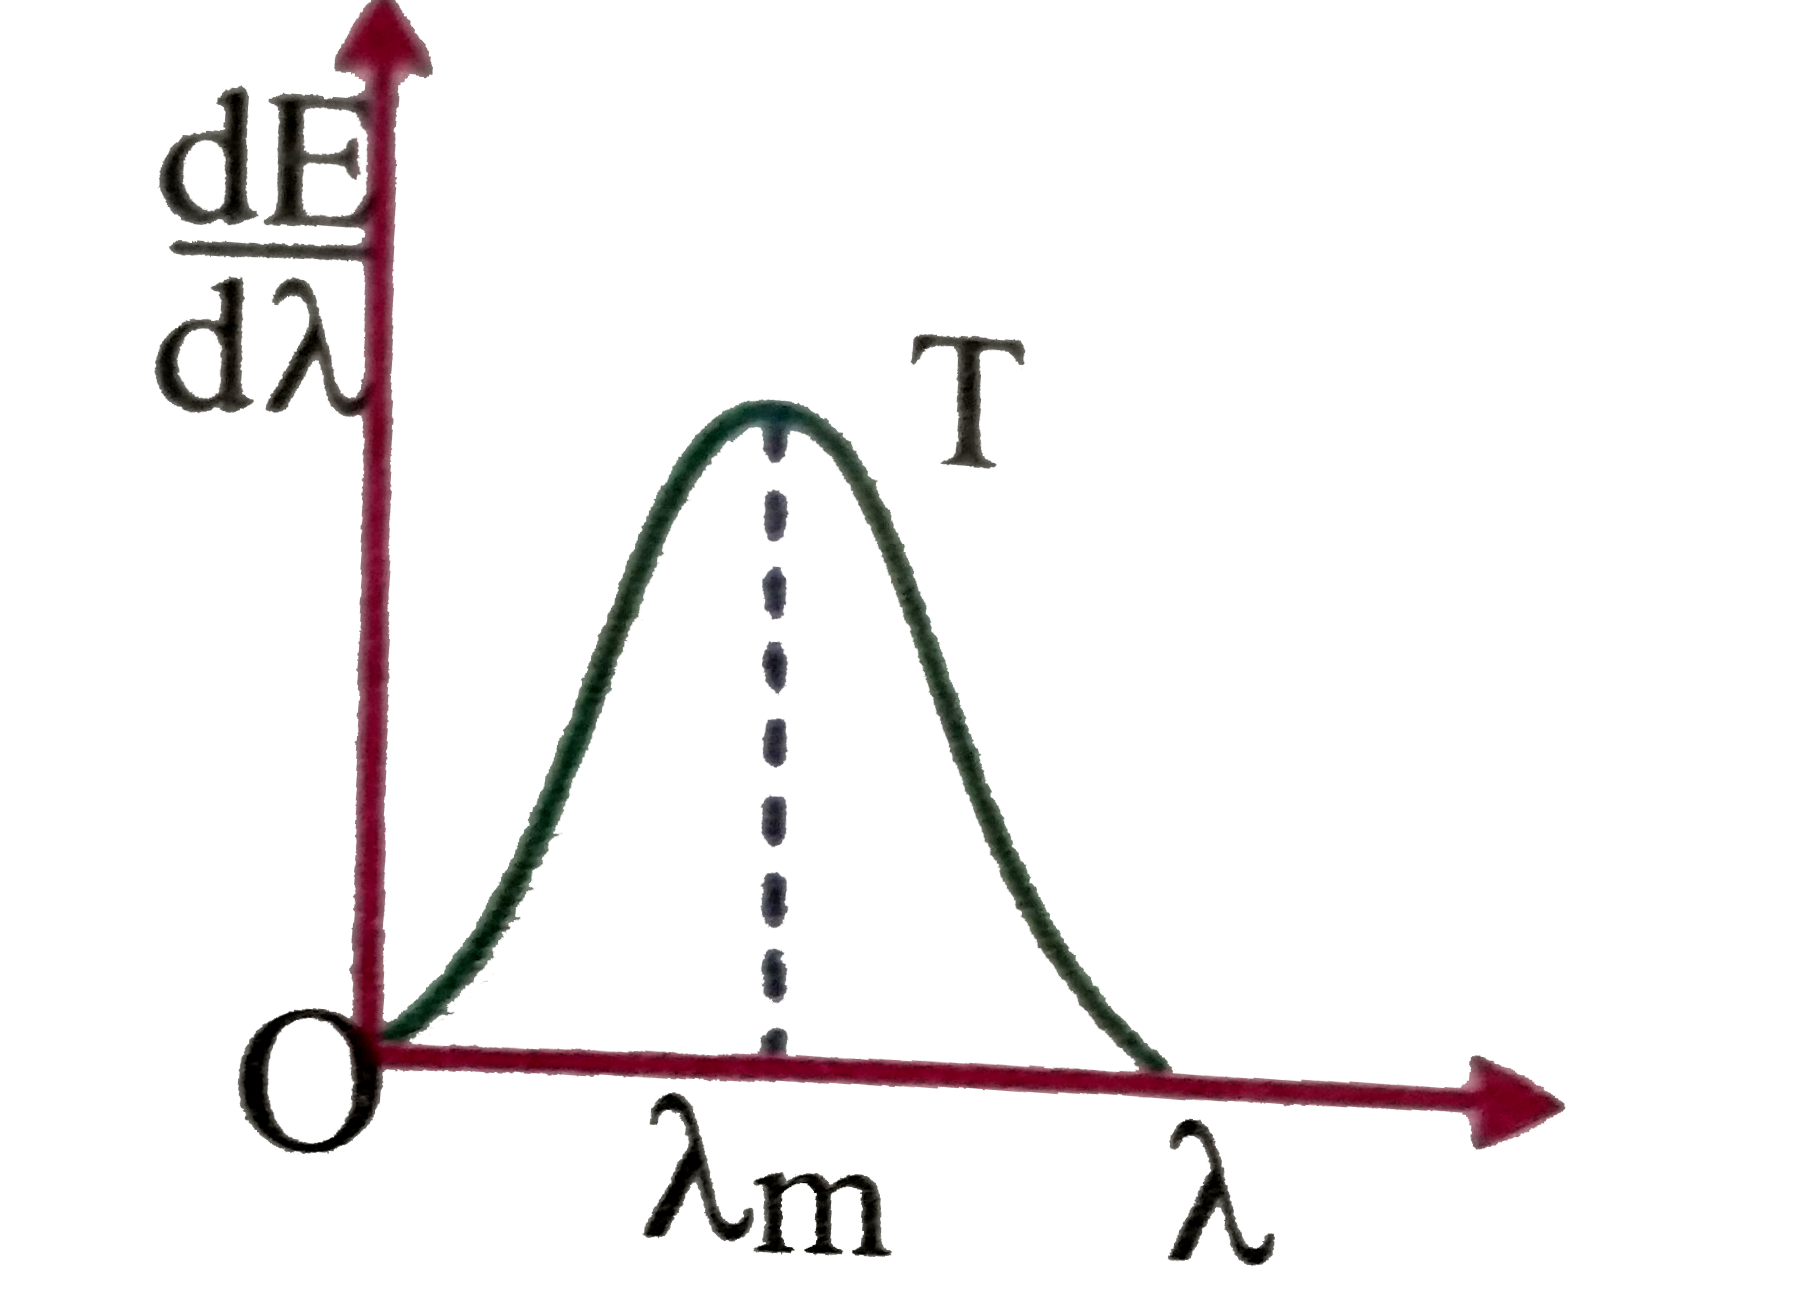
Choose the correct statements (s) .View SolutionActivation energy (Ea) and rate constants (k1andk2) of a chemical reaction at two different temperature (T1andT2) are related by
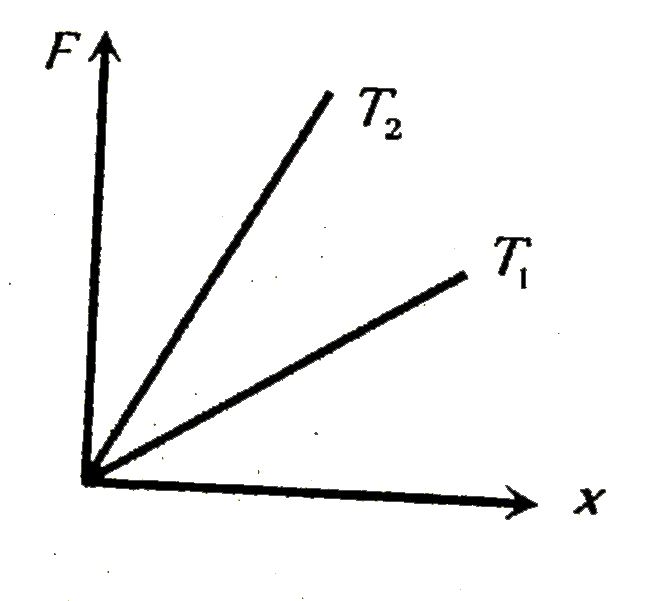
View SolutionThe diagram shows the change x in the length of the uniform wire caused by the application of stres F at two different temperatures T and T. The variations shown suggest that
 View Solution
The shows a radiant energy spectrum graph for a black body at at temperature T
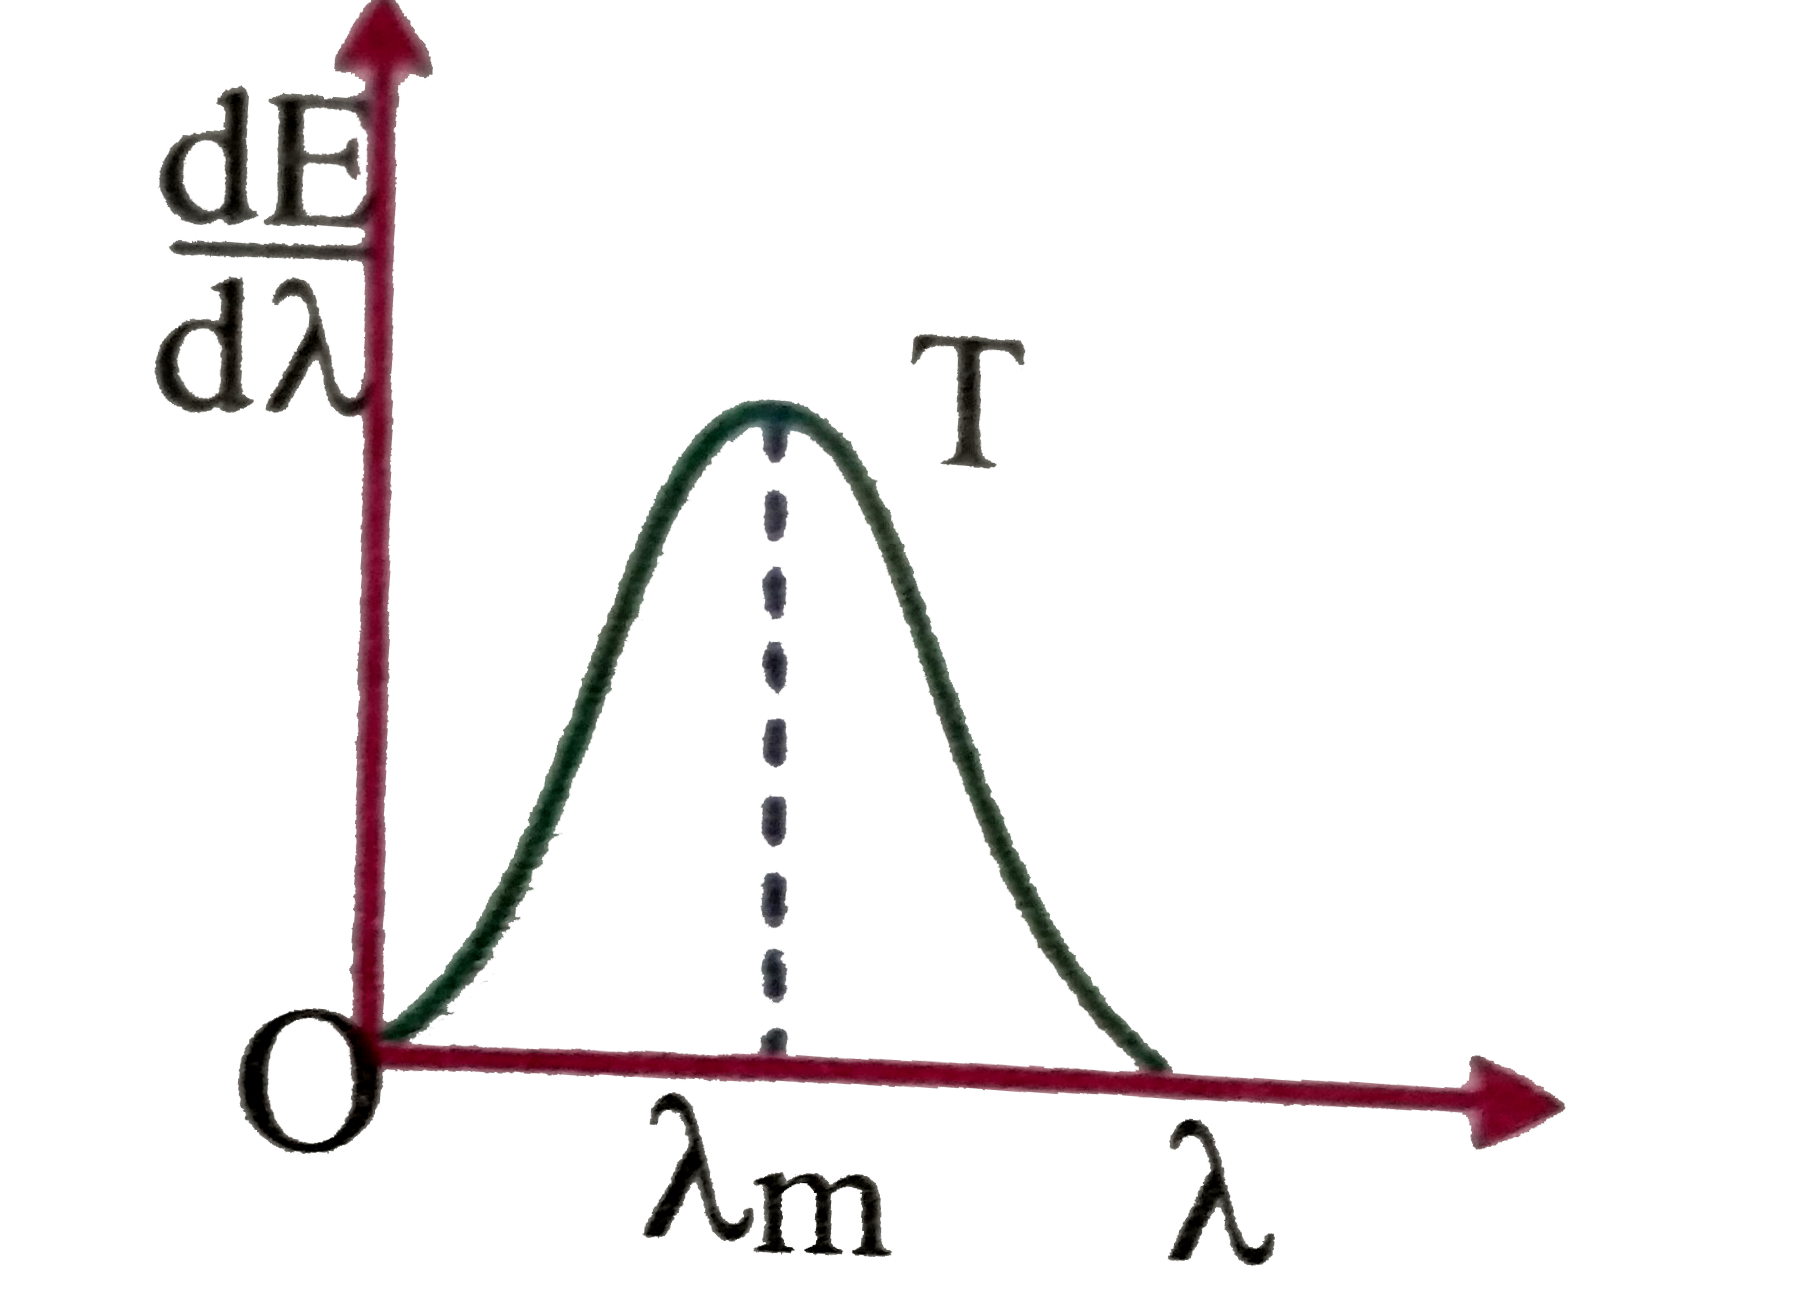
If the temperature of the body is raised to a higher temperature T then choose the correct statement (s).View SolutionActivation energy (Ea) and rate constant (k1andk2) of chemical reaction at two different temperatures (T1andT2) are related by :
View Solution

