Which of the following graphs correctly represents the relation between ln E and ln T where E is the amount of radiation emitted per unit time from unit area of a body and T is the absolute temperature

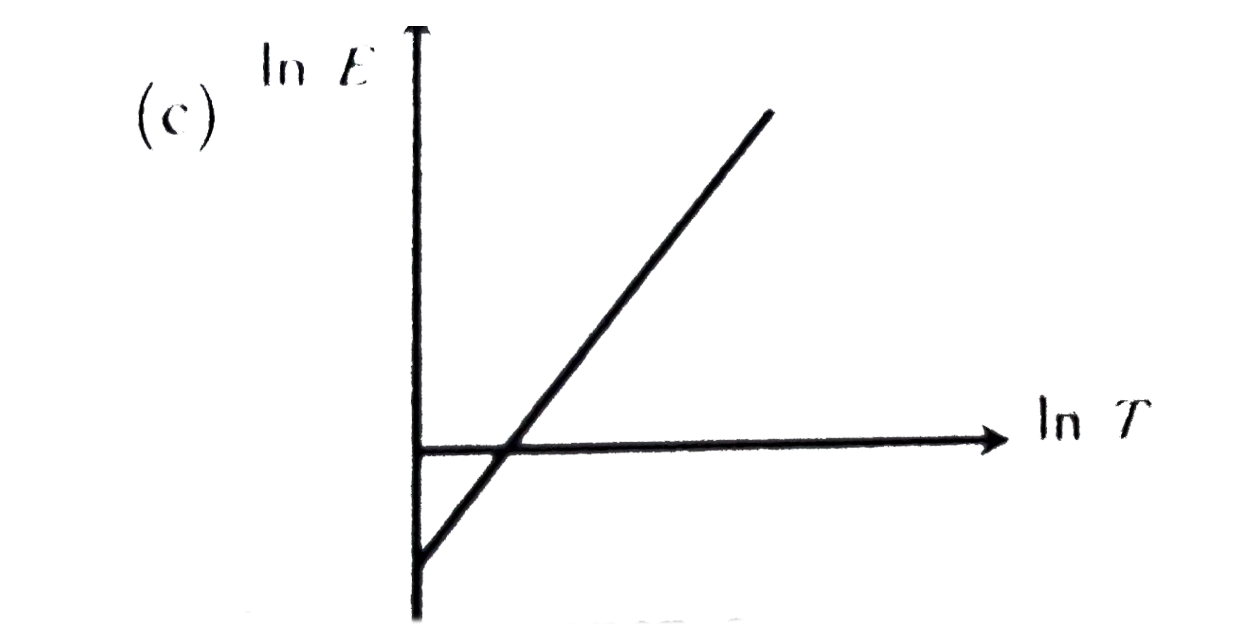
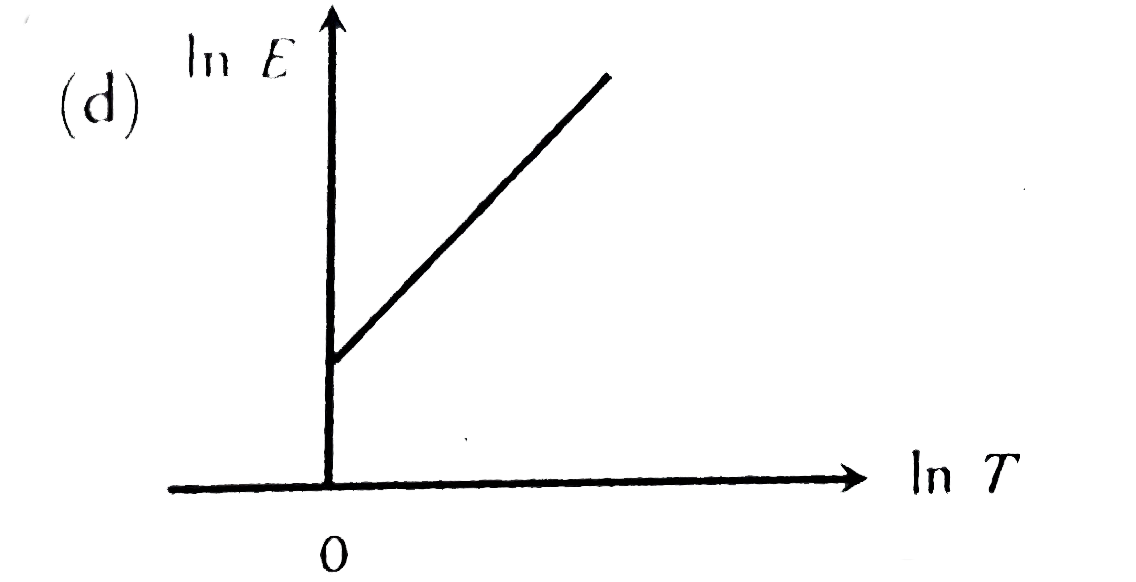
The correct Answer is:D
Topper's Solved these Questions
- TRANSMISSION OF HEATBOOK - ERRORLESS CHAPTER - TRANSMISSION OF HEATEXERCISE - Assertion & Reason
24 Videos
- TRANSMISSION OF HEATBOOK - ERRORLESS CHAPTER - TRANSMISSION OF HEATEXERCISE - ET Self Evaluation Test
23 Videos
- TRANSMISSION OF HEATBOOK - ERRORLESS CHAPTER - TRANSMISSION OF HEATEXERCISE - Critical Thinking
36 Videos
- THERMOMETRY, THERMAL EXPANSION AND CALORIMETRY BOOK - ERRORLESS CHAPTER - THERMOMETRY, THERMAL EXPANSION AND CALORIMETRY EXERCISE - Self Evaluation Test
15 Videos
- UNITS, DIMENSION & MEASUREMENTSBOOK - ERRORLESS CHAPTER - UNITS, DIMENSION & MEASUREMENTSEXERCISE - All Questions
333 Videos
Similar Questions
Which of the following graphs correctly represents the relation between In (E) and In (T), where E is the amount of radiation emitted per unit time from a unit area of the body and T is the absolute temperature ?
View SolutionWhich graph correctly represents variation between relaxation time (t) of gas molecules with absolute temperature of gas T.
View Solution
Knowledge Check
Which of the following graphs correctly represents the relation between In (E) and In (T), where E is the amount of radiation emitted per unit time from a unit area of the body and T is the absolute temperature ?
A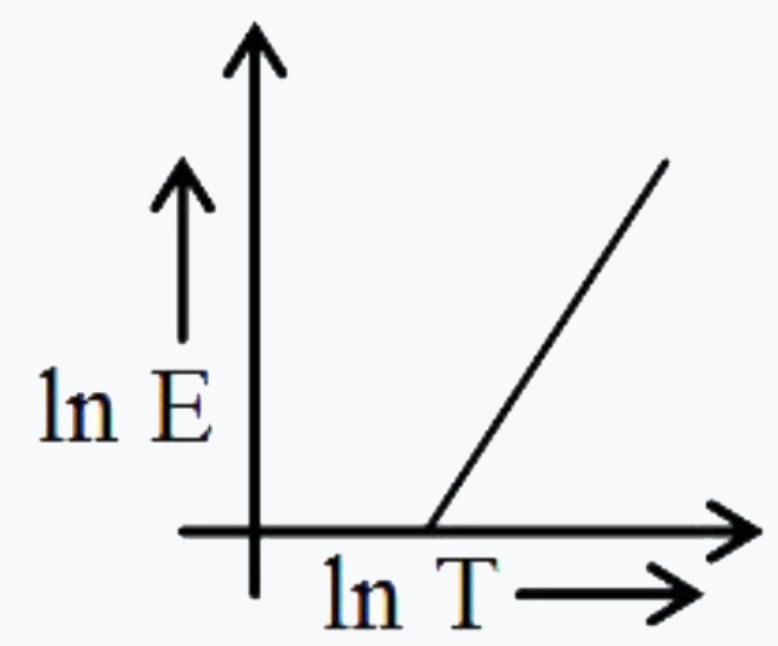 B
B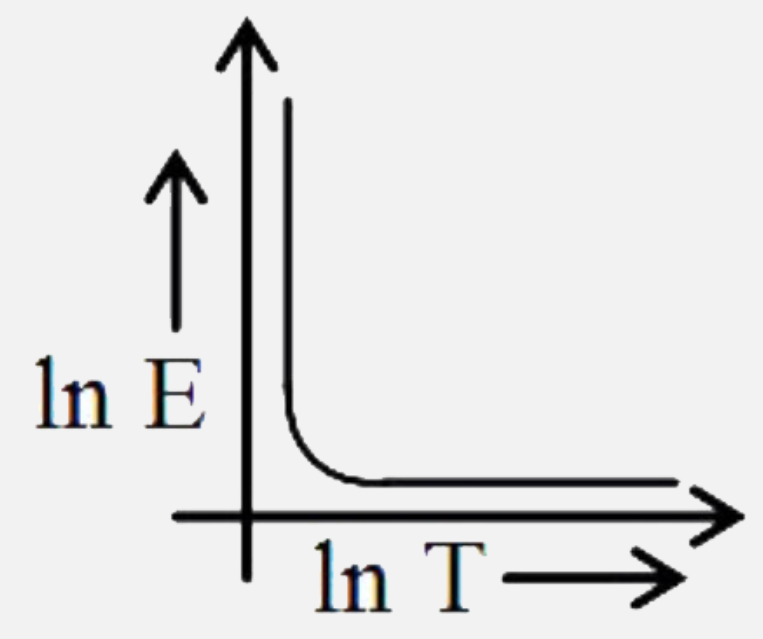 C
C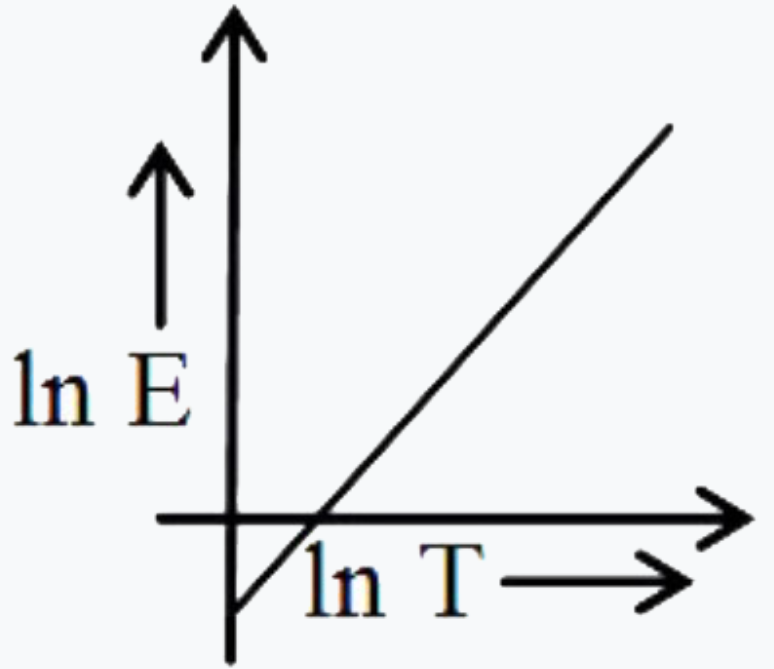 D
D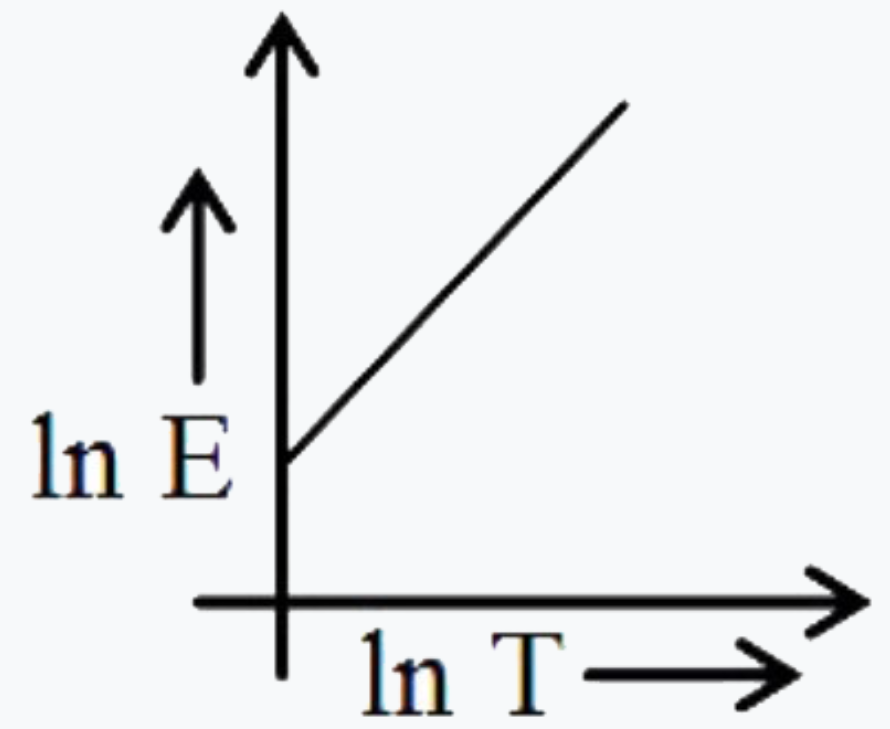
The amount of heat enerrgy radiated per unit time per unit area by a body depends upon
Aarea of the bodyBtemperature and nature of the bodyCnature of the body onlyDall of theseThe law which relates the energy radiated per second by unit area of a body and fourth power of absolute temperature of body is
ANewton's law of coolingBKirchhoff's lawCStefan's lawDWien's law
Which graph correctly represents variation between relaxation time (t) of gas molecules with absolute temperature of gas T.
View SolutionThe amount of thermal radiation energy emitted from the surface of a body is found to be proportional to the ........ power of the absolute temperature of the body.
View SolutionThe maximum energy emitted per unit time per unit area by a body for a particular wavelength depend directly on
View SolutionWhich graph correctly represents variation between relaxation time (t) of gas molecules with absolute temperature of gas T.
View SolutionWhich one of the following represents the graph between log P on Y - axis and 1/T on X - axis ? (P = vapour pressure of a liquid, T = absolute temperature)
View Solution
