A gas is taken isochorically from state A to state C as shown in the graph. Choose the correct statement:

Moles of gas first remains constant and then increases
Moles of gas first increase and then remains constant
Moles of gas first remains constant and then decreases
Moles of gas first decreases and then remains constant.
The correct Answer is:C
Topper's Solved these Questions
- GRAPHICAL INTERPRETATIONBOOK - GRB PUBLICATIONCHAPTER - GRAPHICAL INTERPRETATIONEXERCISE - C. Atomic Sturcture
1 Videos
- GRAPHICAL INTERPRETATIONBOOK - GRB PUBLICATIONCHAPTER - GRAPHICAL INTERPRETATIONEXERCISE - Atomic Sturcture
9 Videos
- GRAPHICAL INTERPRETATIONBOOK - GRB PUBLICATIONCHAPTER - GRAPHICAL INTERPRETATIONEXERCISE - B. Gaseous State
1 Videos
- F-BLOCK ELEMENTSBOOK - GRB PUBLICATIONCHAPTER - F-BLOCK ELEMENTSEXERCISE - Subjective type
7 Videos
- HYDROCARBON (ALIPHATIC)BOOK - GRB PUBLICATIONCHAPTER - HYDROCARBON (ALIPHATIC)EXERCISE - Previous years jee questions
28 Videos
Similar Questions
The heating curve of a particular substance in solid state is as shown in the figure: Choose the correct alternative.
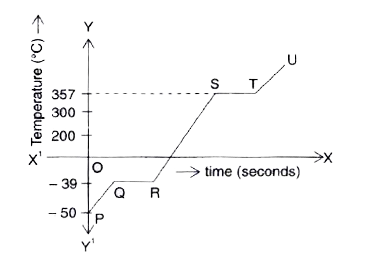
The portion RS of the graph indicates _____ state of substance.
View SolutionThe heating curve of a paritcular substance in solid state is as shown in the figure .choose the correct alternative
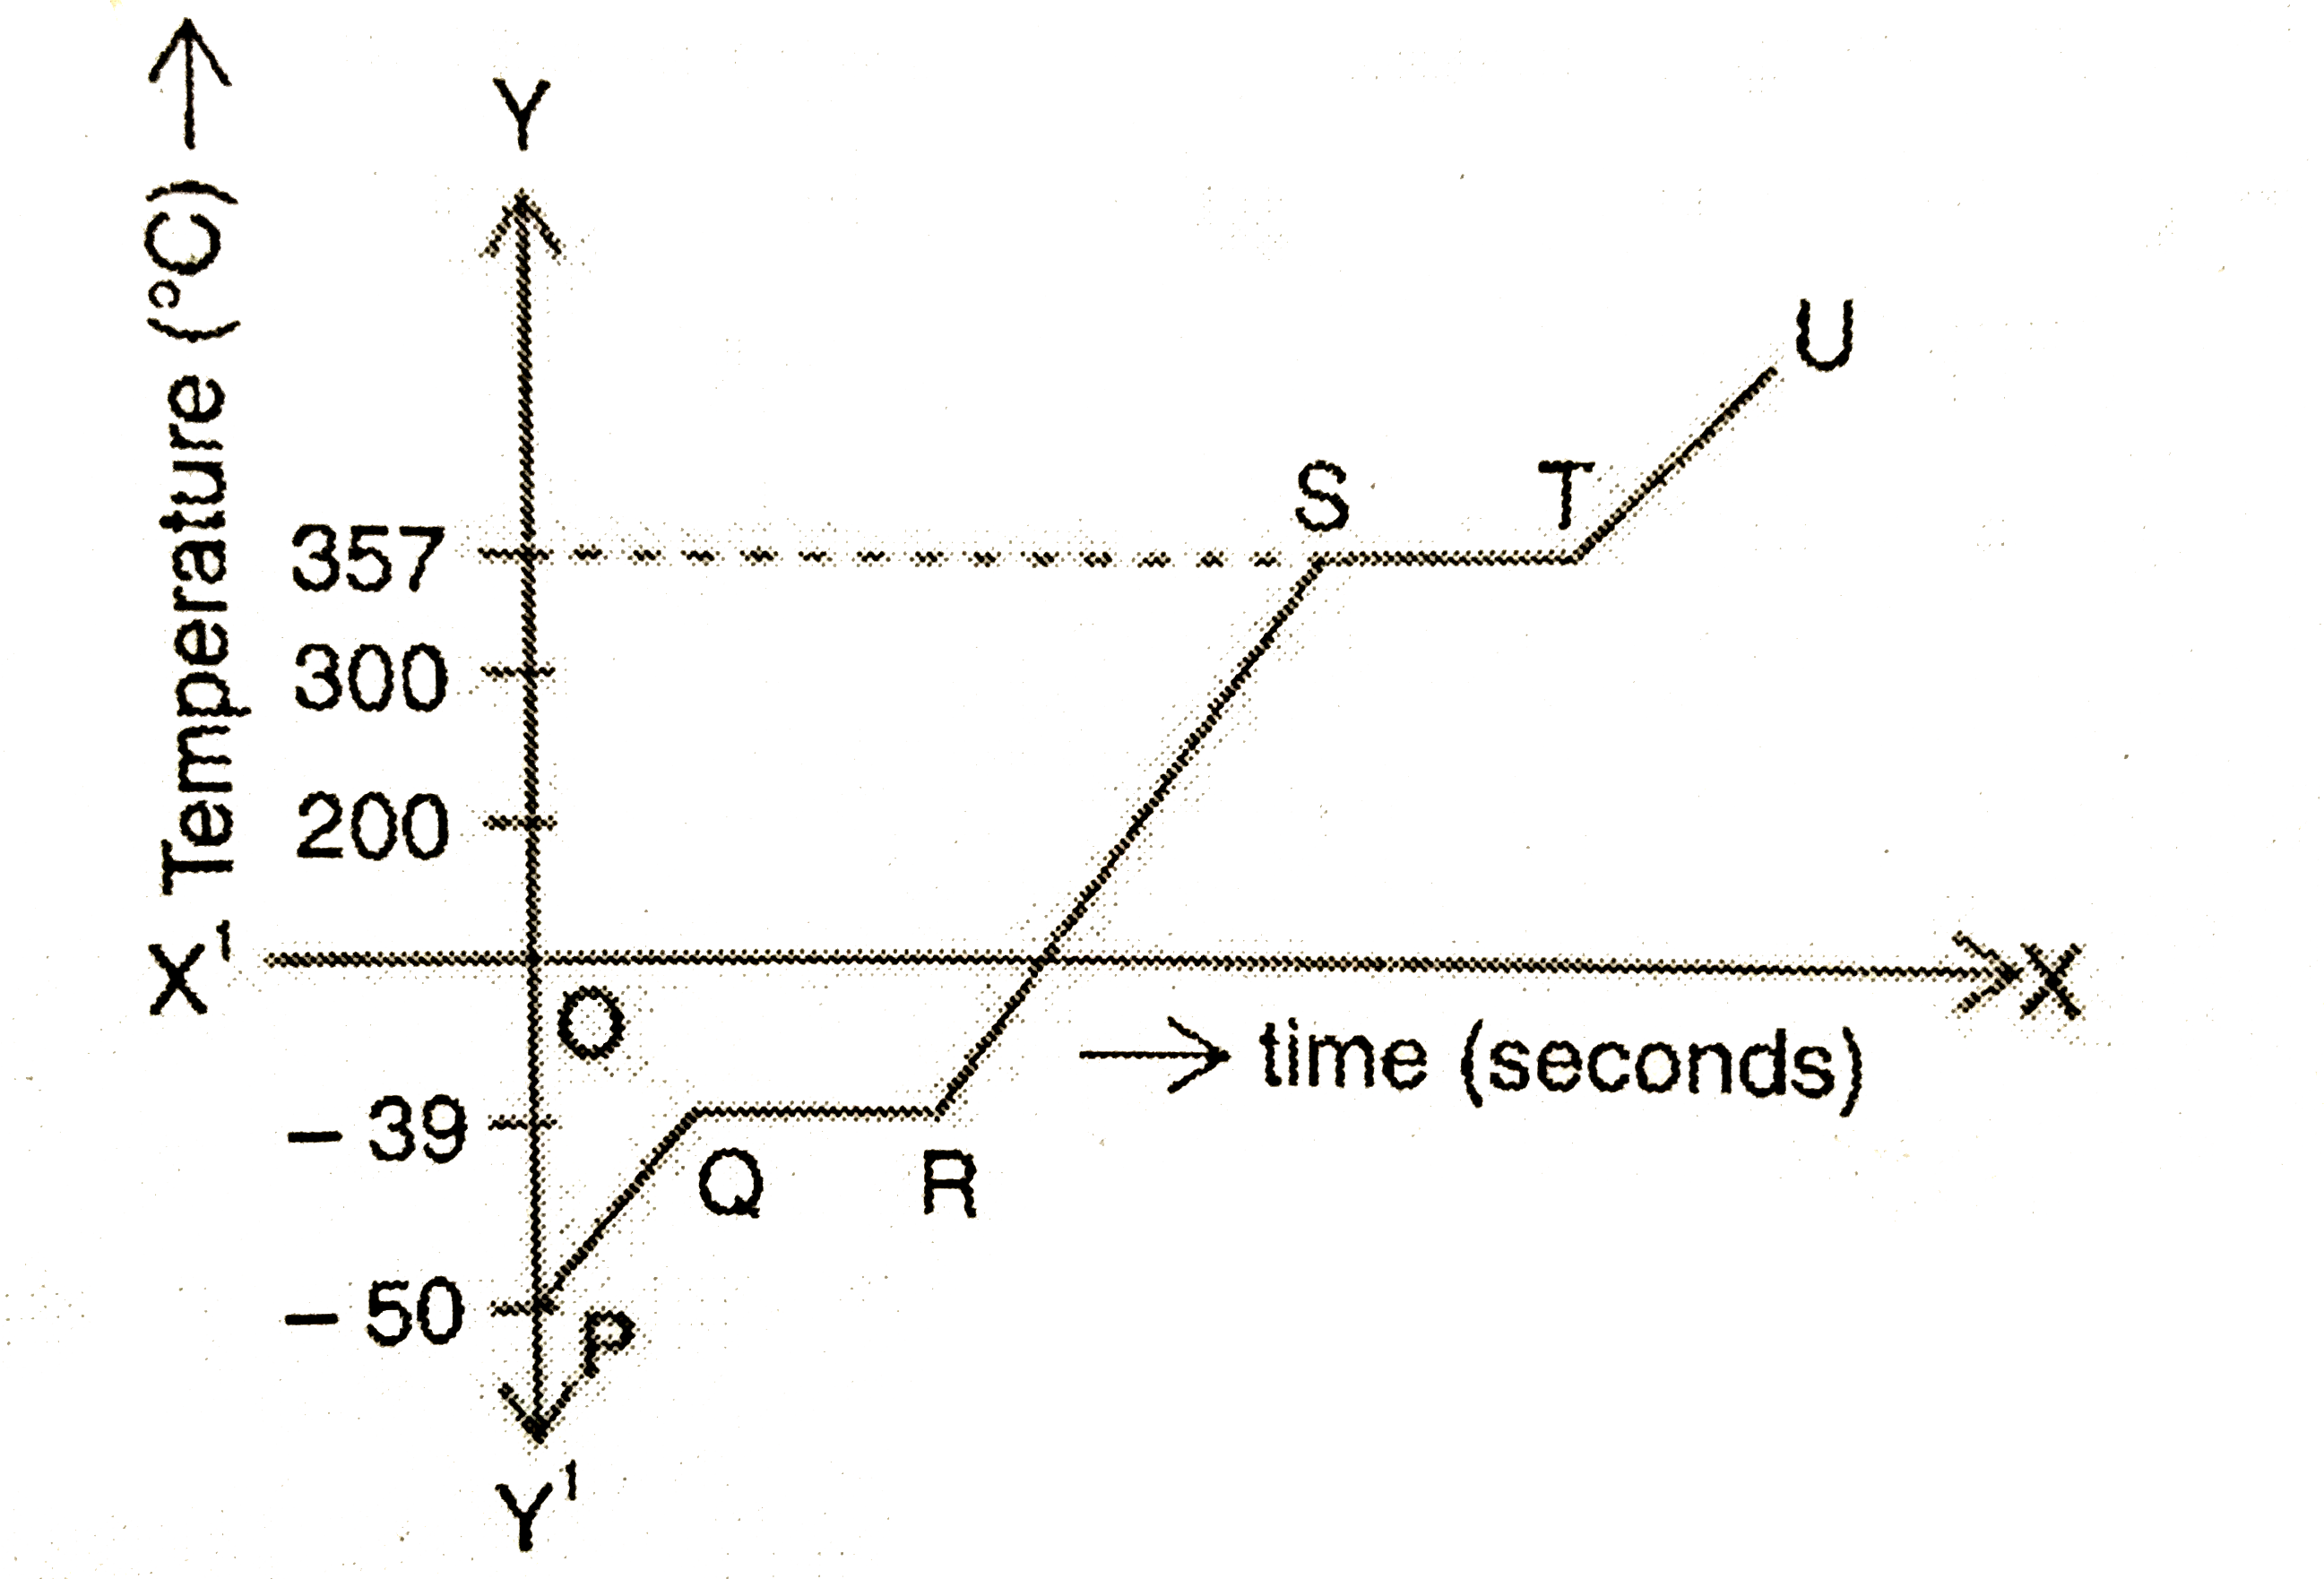
The porition QR of the graph indicates
View Solution
Knowledge Check
The heating curve of a particular substance in solid state is as shows in the figure.Choose the correct alternative
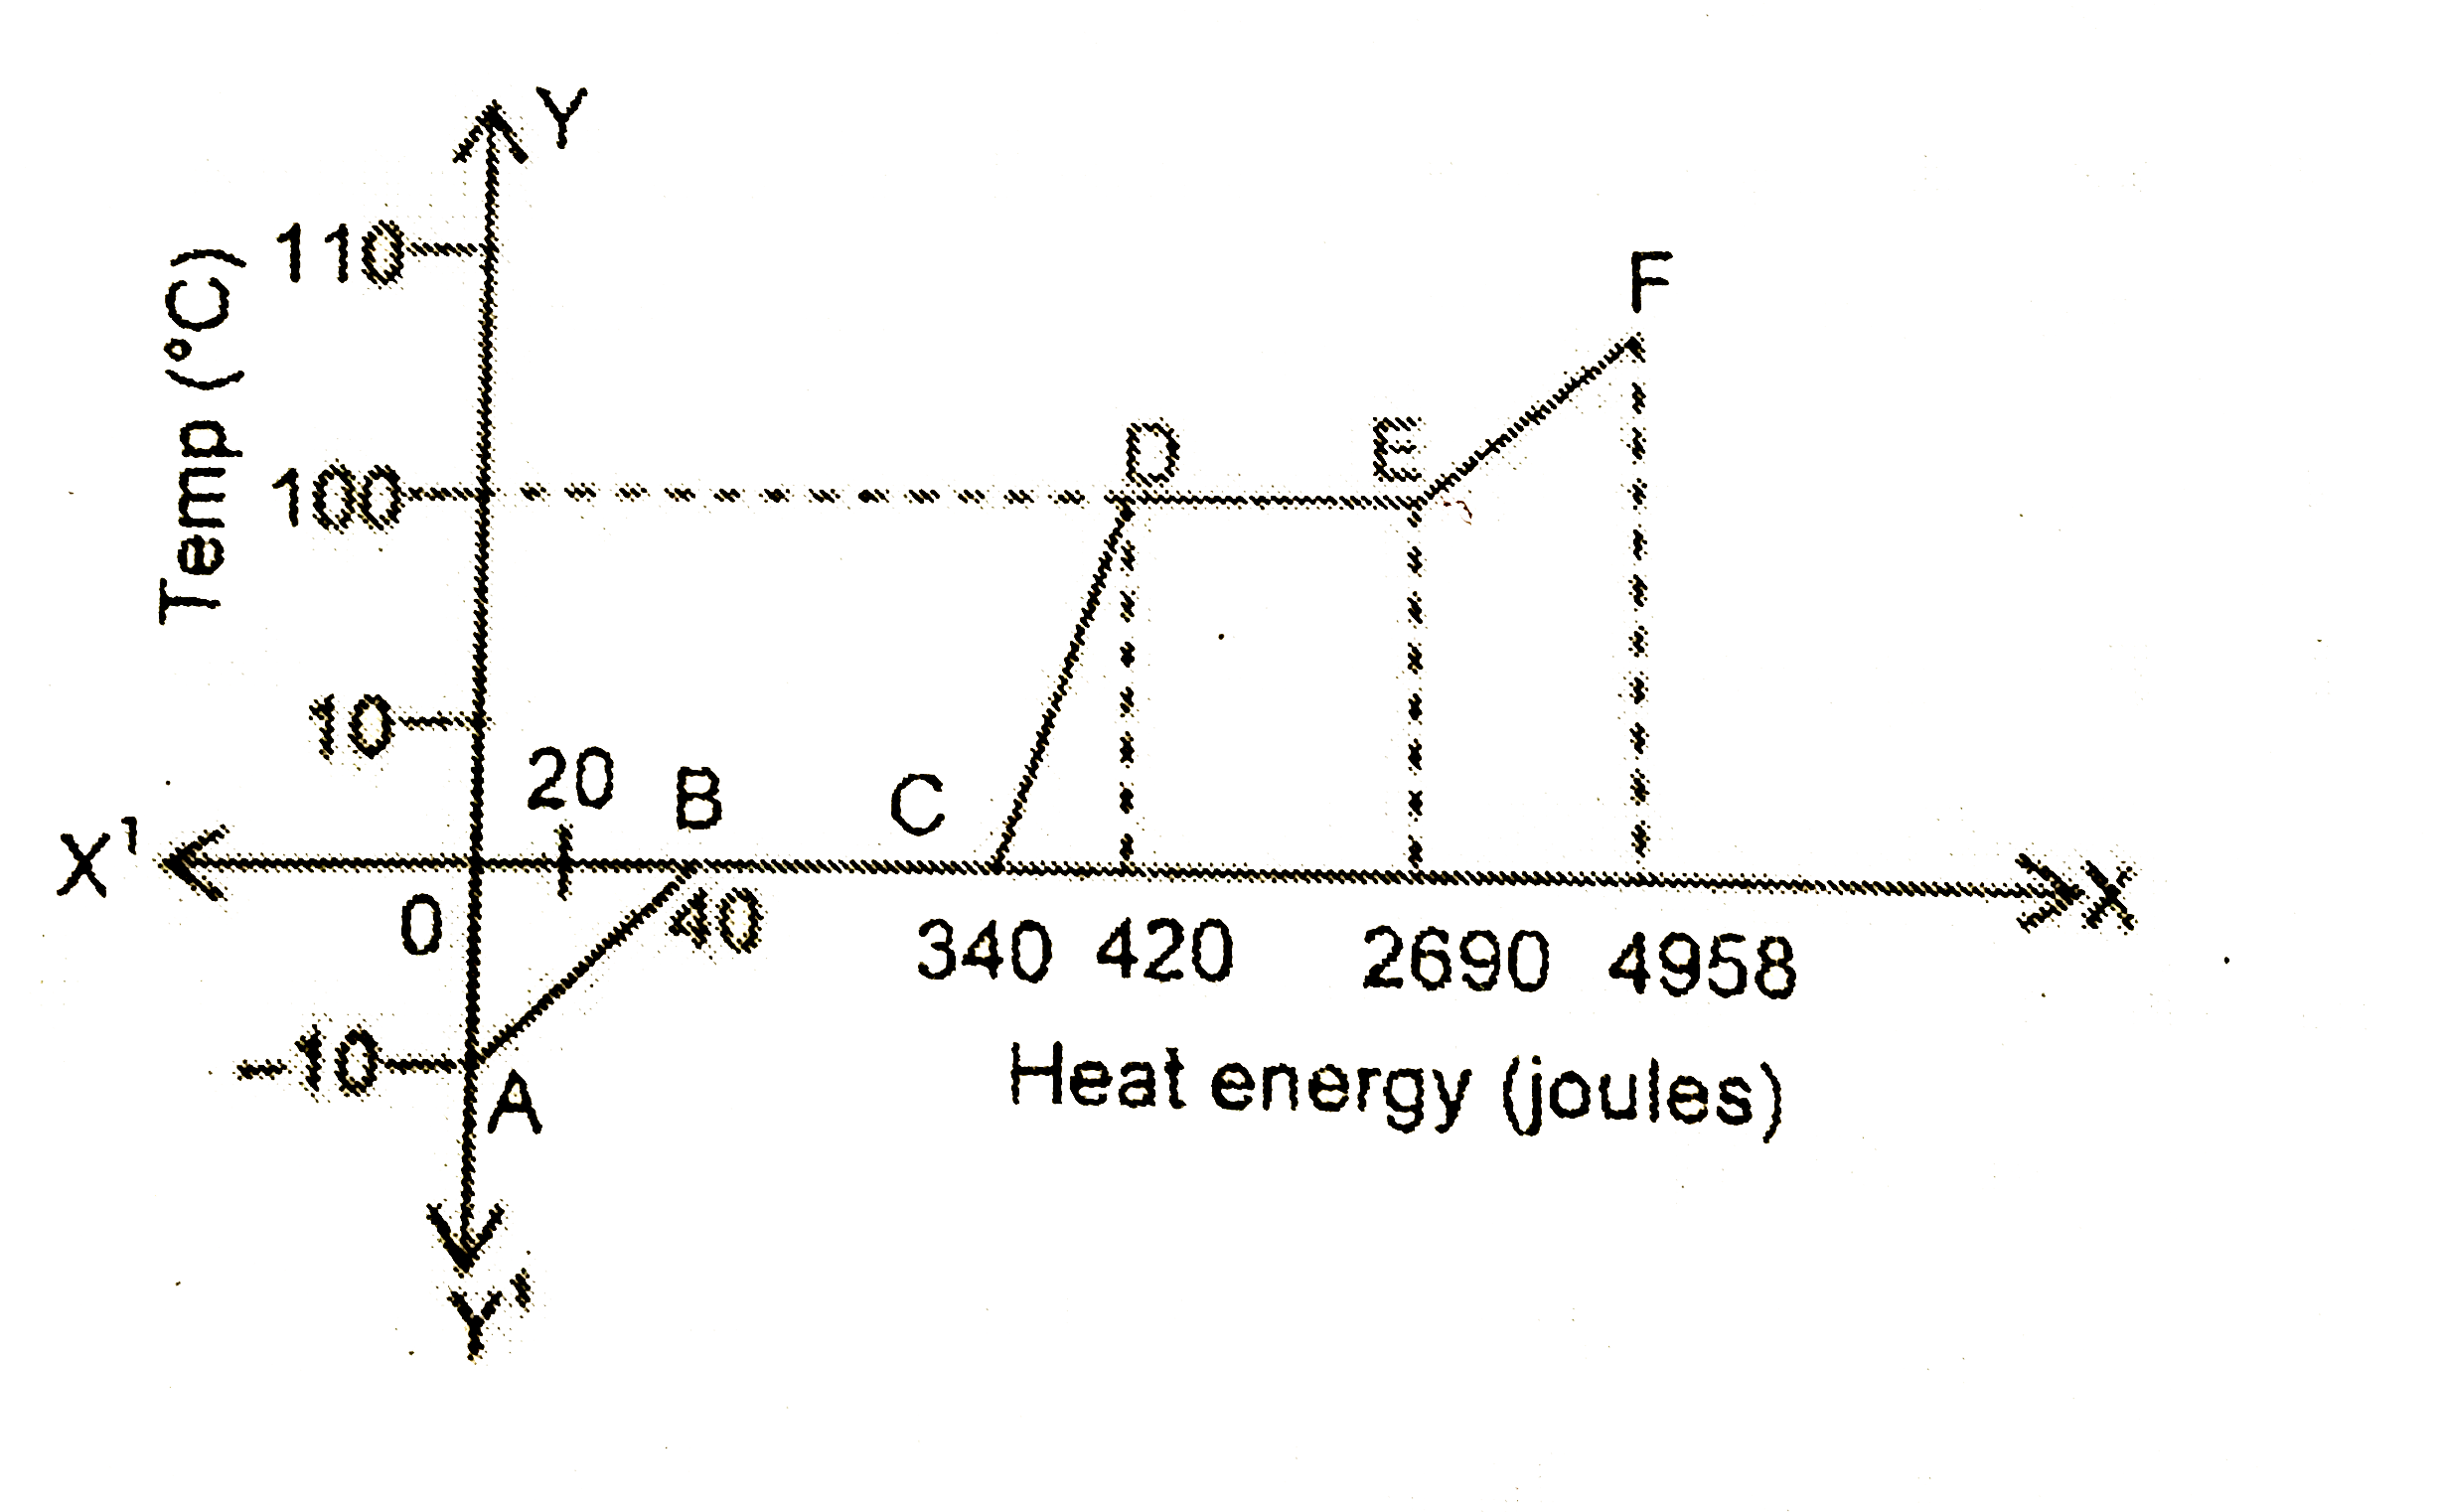
The change of state in the graph is represented by ________part.AABBBCCDEDBoth (b) and (c)The heating curve of a particular substance in solid state is as shows in the figure.Choose the correct alternative

The change of state in the graph is represented by ________part.AABBBCCDEDBoth (b) and (c )The heating curve of a particular substance in solid state is as shown in the figure: Choose the correct alternative.
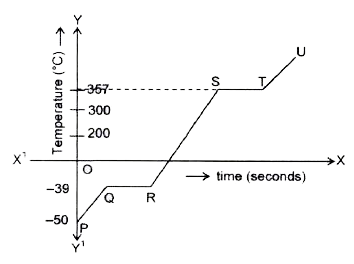
RS part of the graph indicates ___ state of substance.AsolidBliquidCgaseousDCannot be determined
The heating curve of a paritcular substance in solid state is as shown in the figure .choose the correct alternative

The porition QR of the graph indicates
View SolutionThe heating curve of a particular substance in solid state is as shown in the figure .choose the correct alternative
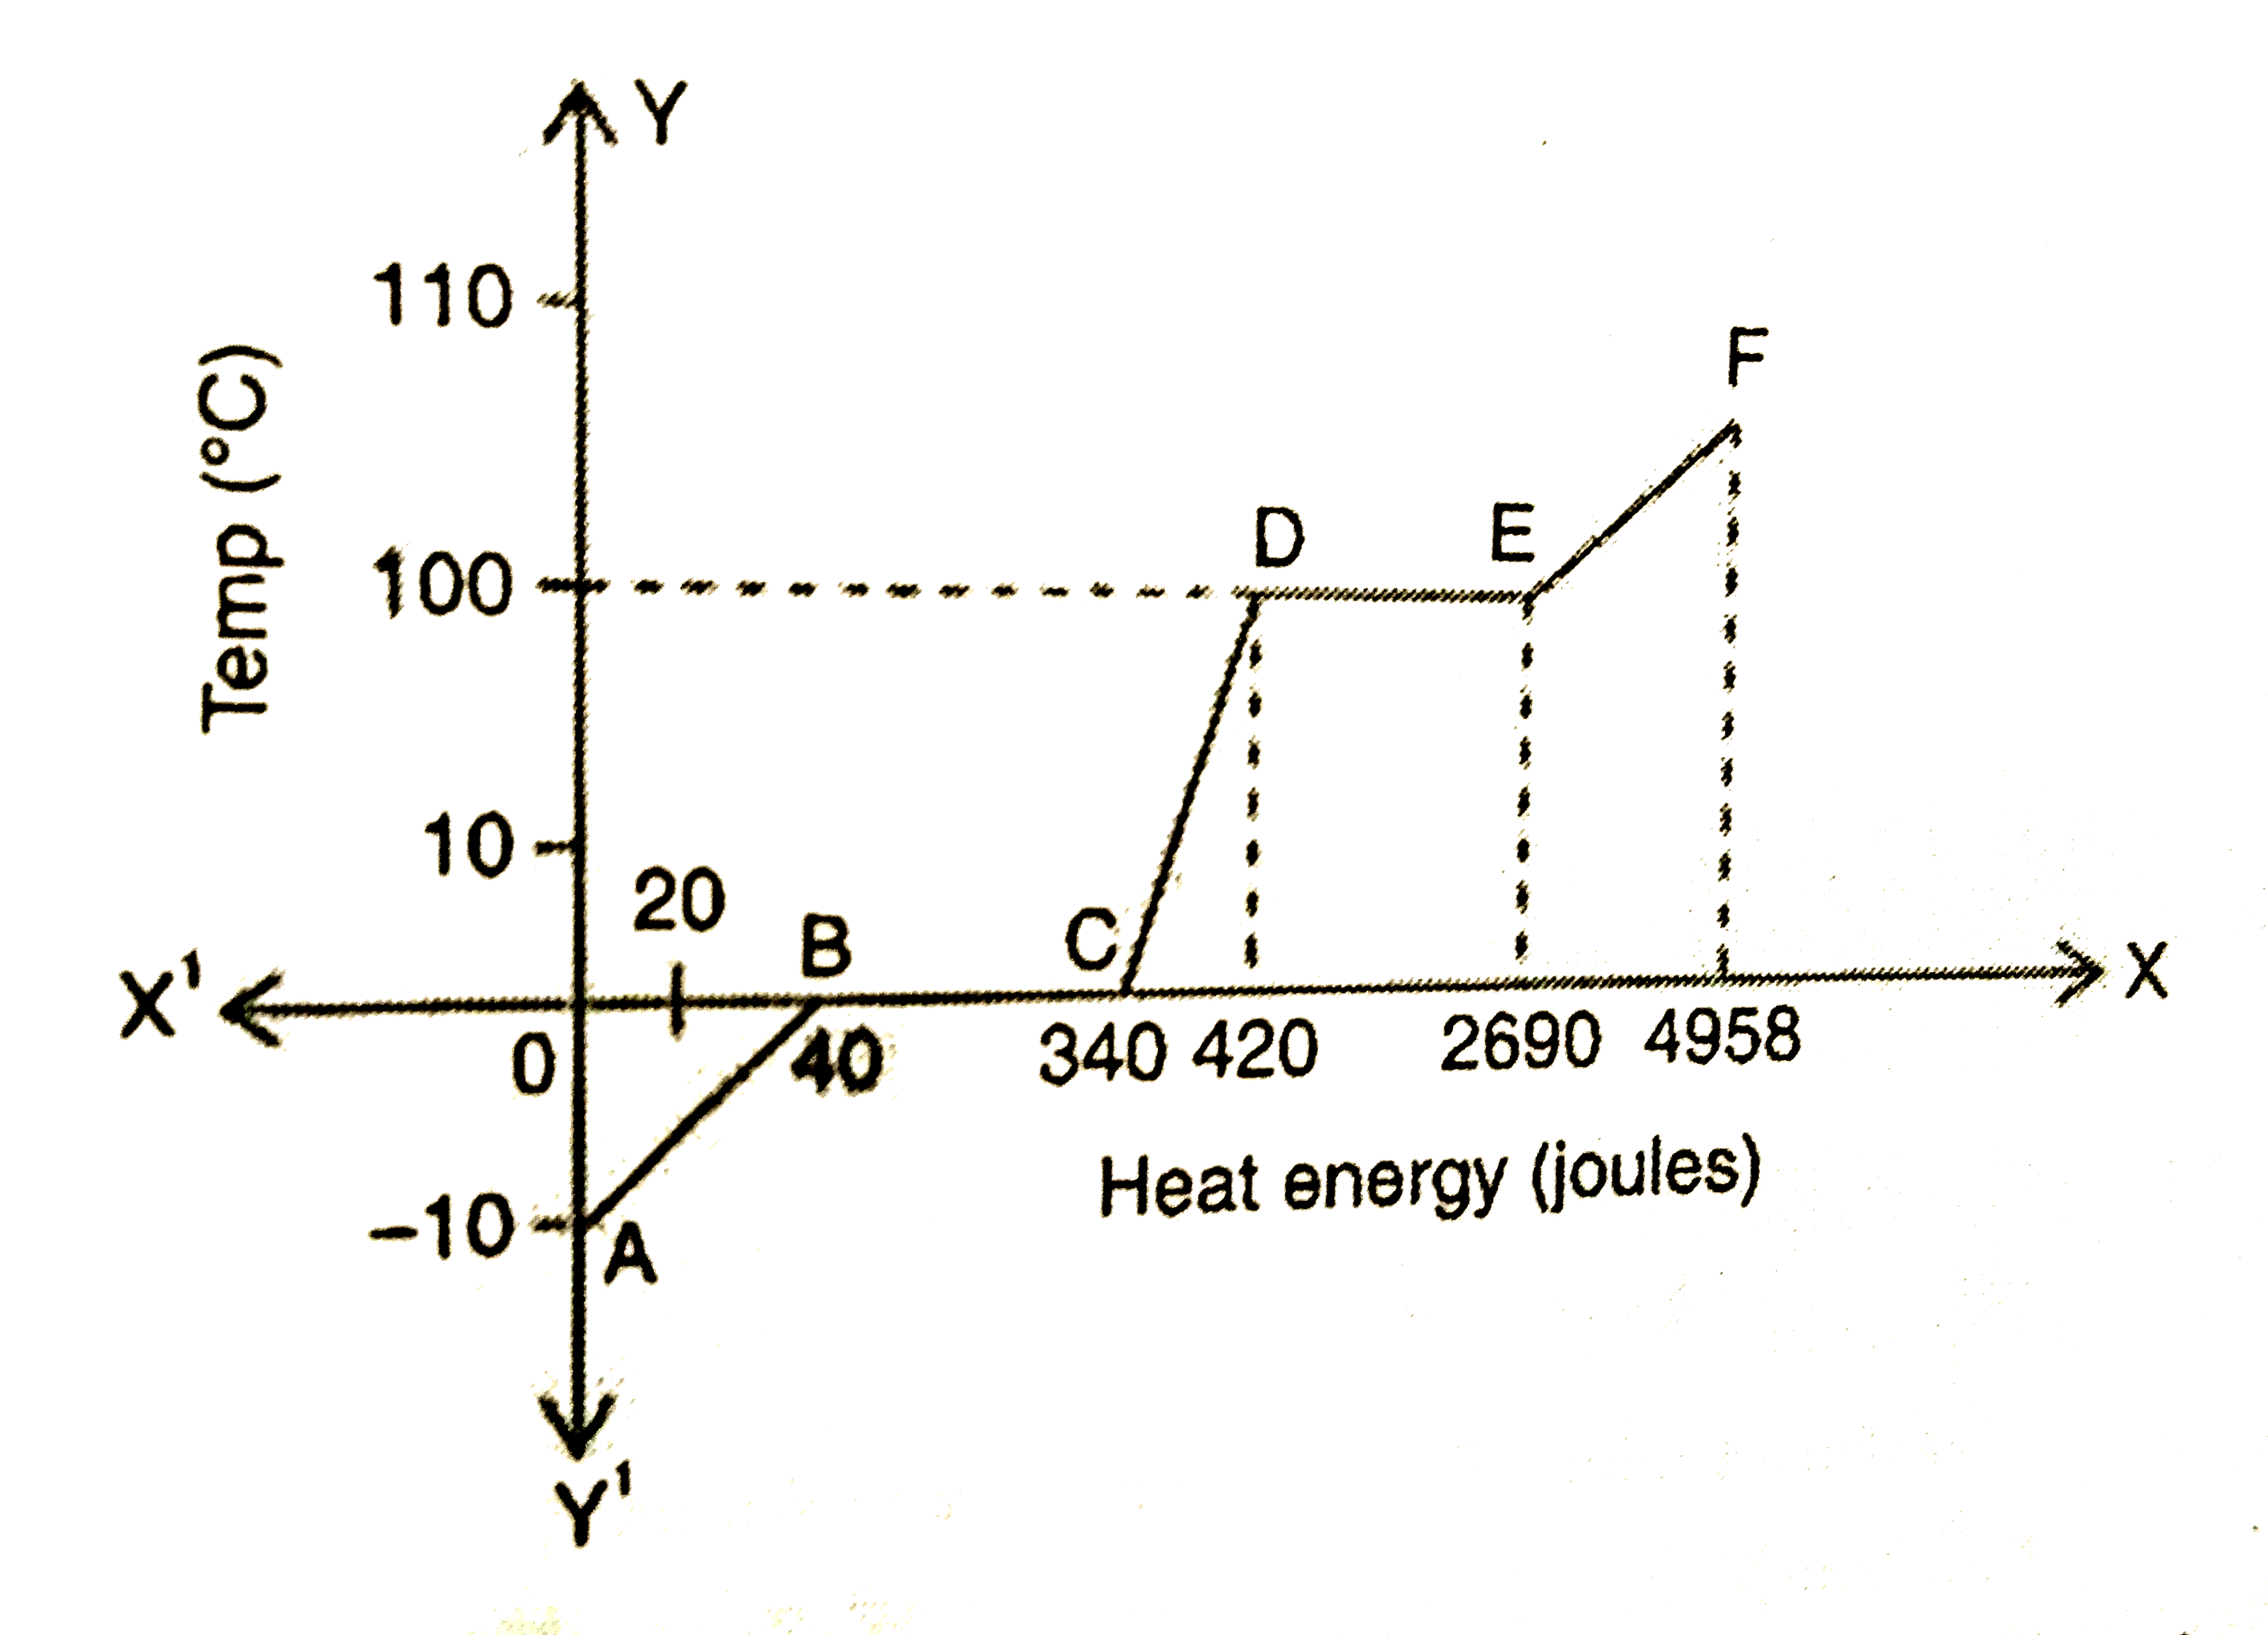
The change of state in the graph is represented by ________part.
View SolutionThe heating curve of a paritcular substance in solid state is as shown in the figure .choose the correct alternative

The porition QR of the graph indicates
View SolutionThe heating curve of a particular substance in solid state is as shows in the figure.Choose the correct alternative

The change of state in the graph is represented by ________part.
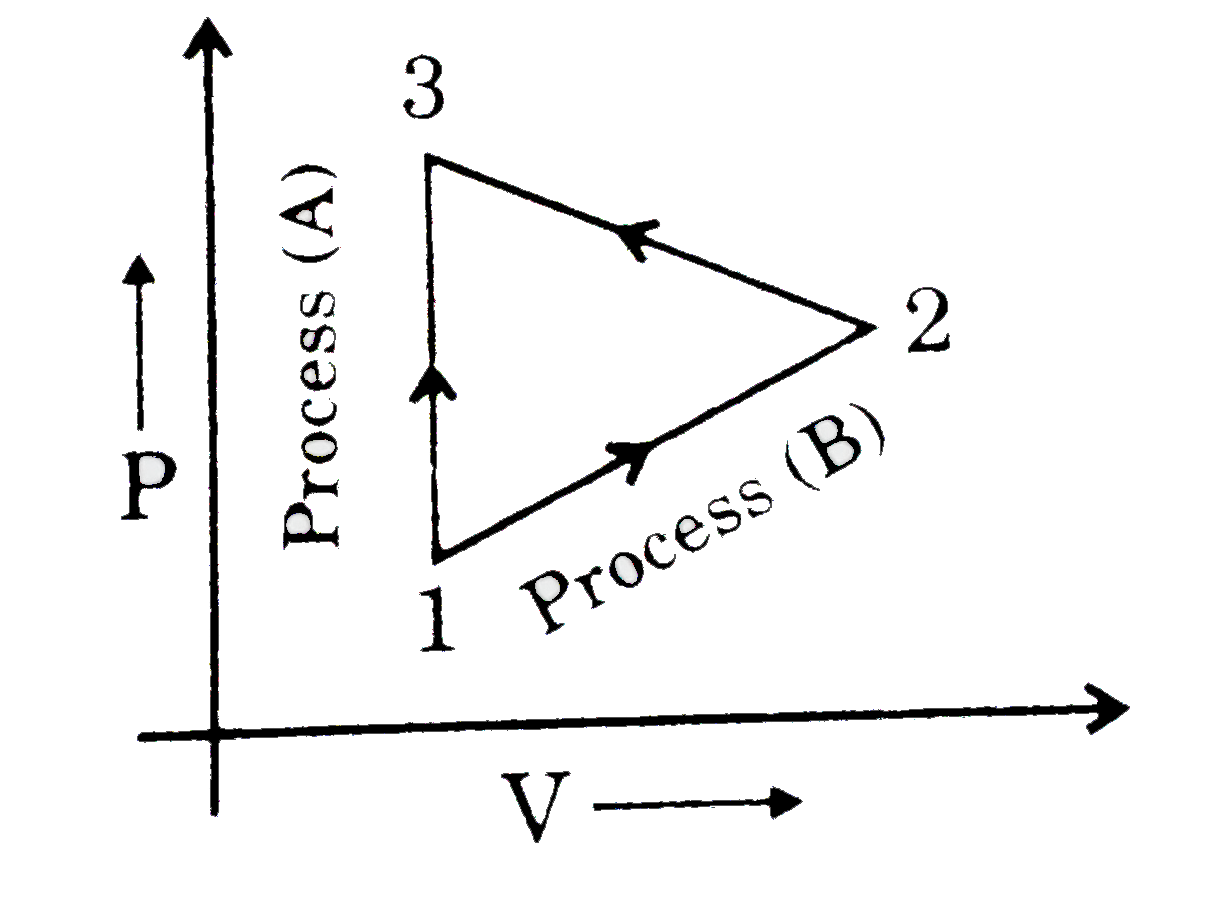
View SolutionTwo process are shown such that an ideal gas is taken from state 1 to state 3. Compare the following and choose the correct option(s).
View Solution
