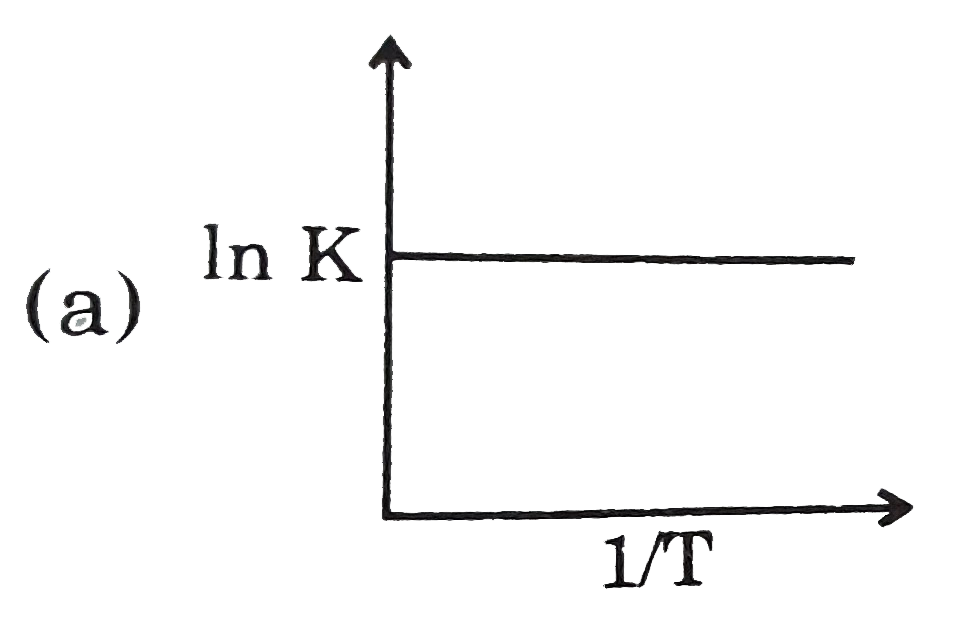
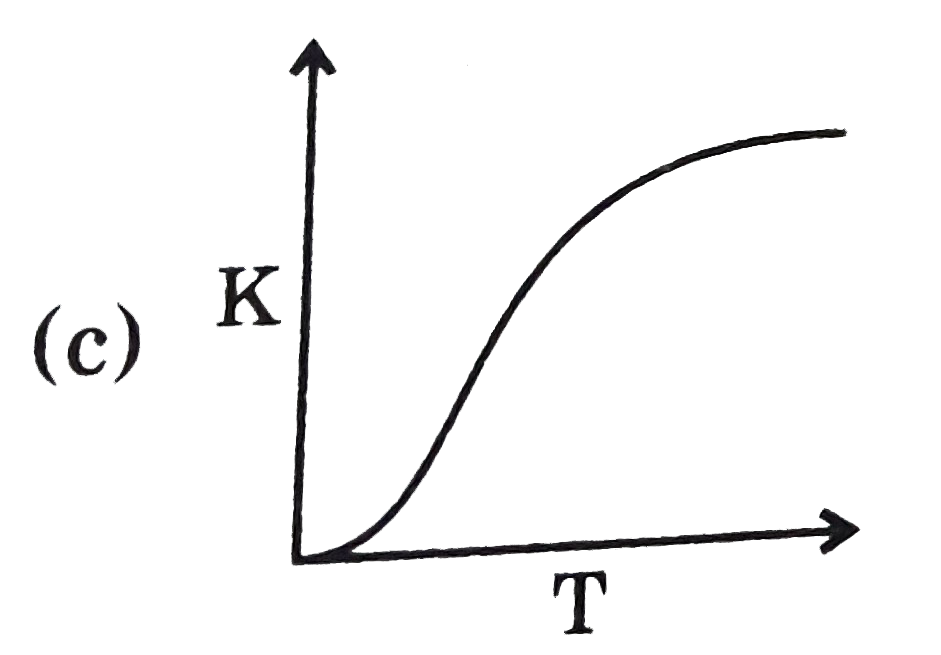
The variation of rate constant with temperature can be explained by Arrhenius equation. However , the can be explained by Activation energy is found to be temperature dependent/In such casesdinKdT=EaRT2 should be used to predict variation of rate constant with tempreature. On the basic of this information , answer the question that follow :
Which if the following statement is not correct ?
Temperature coefficient of a reaction at high temperature will be less
Reaction with no activation energy will have no change in rate constant due to temperature
The factor by which catalyst increase rate constant will be same at all the temperature
Greater the activation energy, more sanitive will the rate constant be cecause of temperature
The correct Answer is:C
Step by step video, text & image solution for The variation of rate constant with temperature can be explained by Arrhenius equation. However , the can be explained by Activation energy is found to be temperature dependent/In such cases(d"in"K)/(dT)=(E_(a))/(RT^(2)) should be used to predict variation of rate constant with tempreature. On the basic of this information , answer the question that follow : Which if the following statement is not correct ? by Chemistry experts to help you in doubts & scoring excellent marks in Class 12 exams.
Updated on:21/07/2023Topper's Solved these Questions
- GRAPHICAL INTERPRETATIONBOOK - GRB PUBLICATIONCHAPTER - GRAPHICAL INTERPRETATIONEXERCISE - Comprehension 2
1 Videos
- GRAPHICAL INTERPRETATIONBOOK - GRB PUBLICATIONCHAPTER - GRAPHICAL INTERPRETATIONEXERCISE - Comprehension 3
1 Videos
- GRAPHICAL INTERPRETATIONBOOK - GRB PUBLICATIONCHAPTER - GRAPHICAL INTERPRETATIONEXERCISE - Comprehension 1
1 Videos
- F-BLOCK ELEMENTSBOOK - GRB PUBLICATIONCHAPTER - F-BLOCK ELEMENTSEXERCISE - Subjective type
7 Videos
- HYDROCARBON (ALIPHATIC)BOOK - GRB PUBLICATIONCHAPTER - HYDROCARBON (ALIPHATIC)EXERCISE - Previous years jee questions
28 Videos
Similar Questions
Which one of the following given graphs represents the variation of rate constant (k) with temperature (f) for an endothermic reaction ?
View SolutionWhich one of the following given graphs represents the variation of rate constant (k) with temperature (t) for an endothermic reaction ?
View Solution
Knowledge Check
The variation of rate constant with temperature can be explained by Arrhenius equation. However , the can be explained by Activation energy is found to be temperature dependent/In such cases dinKdT=EaRT2 should be used to predict variation of rate constant with tempreature. On the basic of this information , answer the question that follow :
If Arrhenius constant and Ea (activation energy0 are assumed to be constant then which of the following graph will be correctA B
B C
C D
D
The variation of rate constant with temperature can be explained by Arrhenius equation. However , the can be explained by Activation energy is found to be temperature dependent/In such casesdinKdT=EaRT2 should be used to predict variation of rate constant with tempreature. On the basic of this information , answer the question that follow :
If for a reaction in K=20−20T+3 in T then Ea at 300 K will beA20 RB900 RC920 RD880 RThe temperature dependence of the rate of a chemical reaction can be explained by Arrhenius equaiton which is
Ak=AeEa/RTBk=Ae−Ea/RTCk=Ae×EaRTDk=Ae×RTEa
If K1= Rate constant at temperature T1 and k2 rate constant at temperature T2 for a first order reaction, then which of the following relation is correct ?
View SolutionWhich of the following graph is incorrect for variation of rate constant (K) with temperature for a reaction obeying Arrhenius equation ?
View SolutionPlots showing the variation of the rate constant (k) with temperature (T) are given below. The plot that follows the Arrhenius equation is
View SolutionPlots showing the variation of the rate constant (k) with temperature (T) are given below. The plot that follows the Arrhenius equation is
View SolutionPlots showing the variation of the rate constant (k) with temperature (T) are given below. The plot that follows Arrhenius equations is
View Solution
