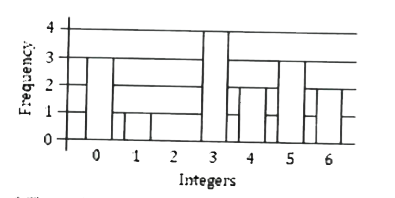
The graph abvoe shows the frequencu distribution of a list of randomly generated integers between 0 and 6. What is the mean of the last of numbers?
The correct Answer is:3.2
Step by step video, text & image solution for The graph abvoe shows the frequencu distribution of a list of randomly generated integers between 0 and 6. What is the mean of the last of numbers? by Maths experts to help you in doubts & scoring excellent marks in Class 12 exams.
Similar Questions
Find two irrational numbers between 0.6 and 0.66.
View Solution
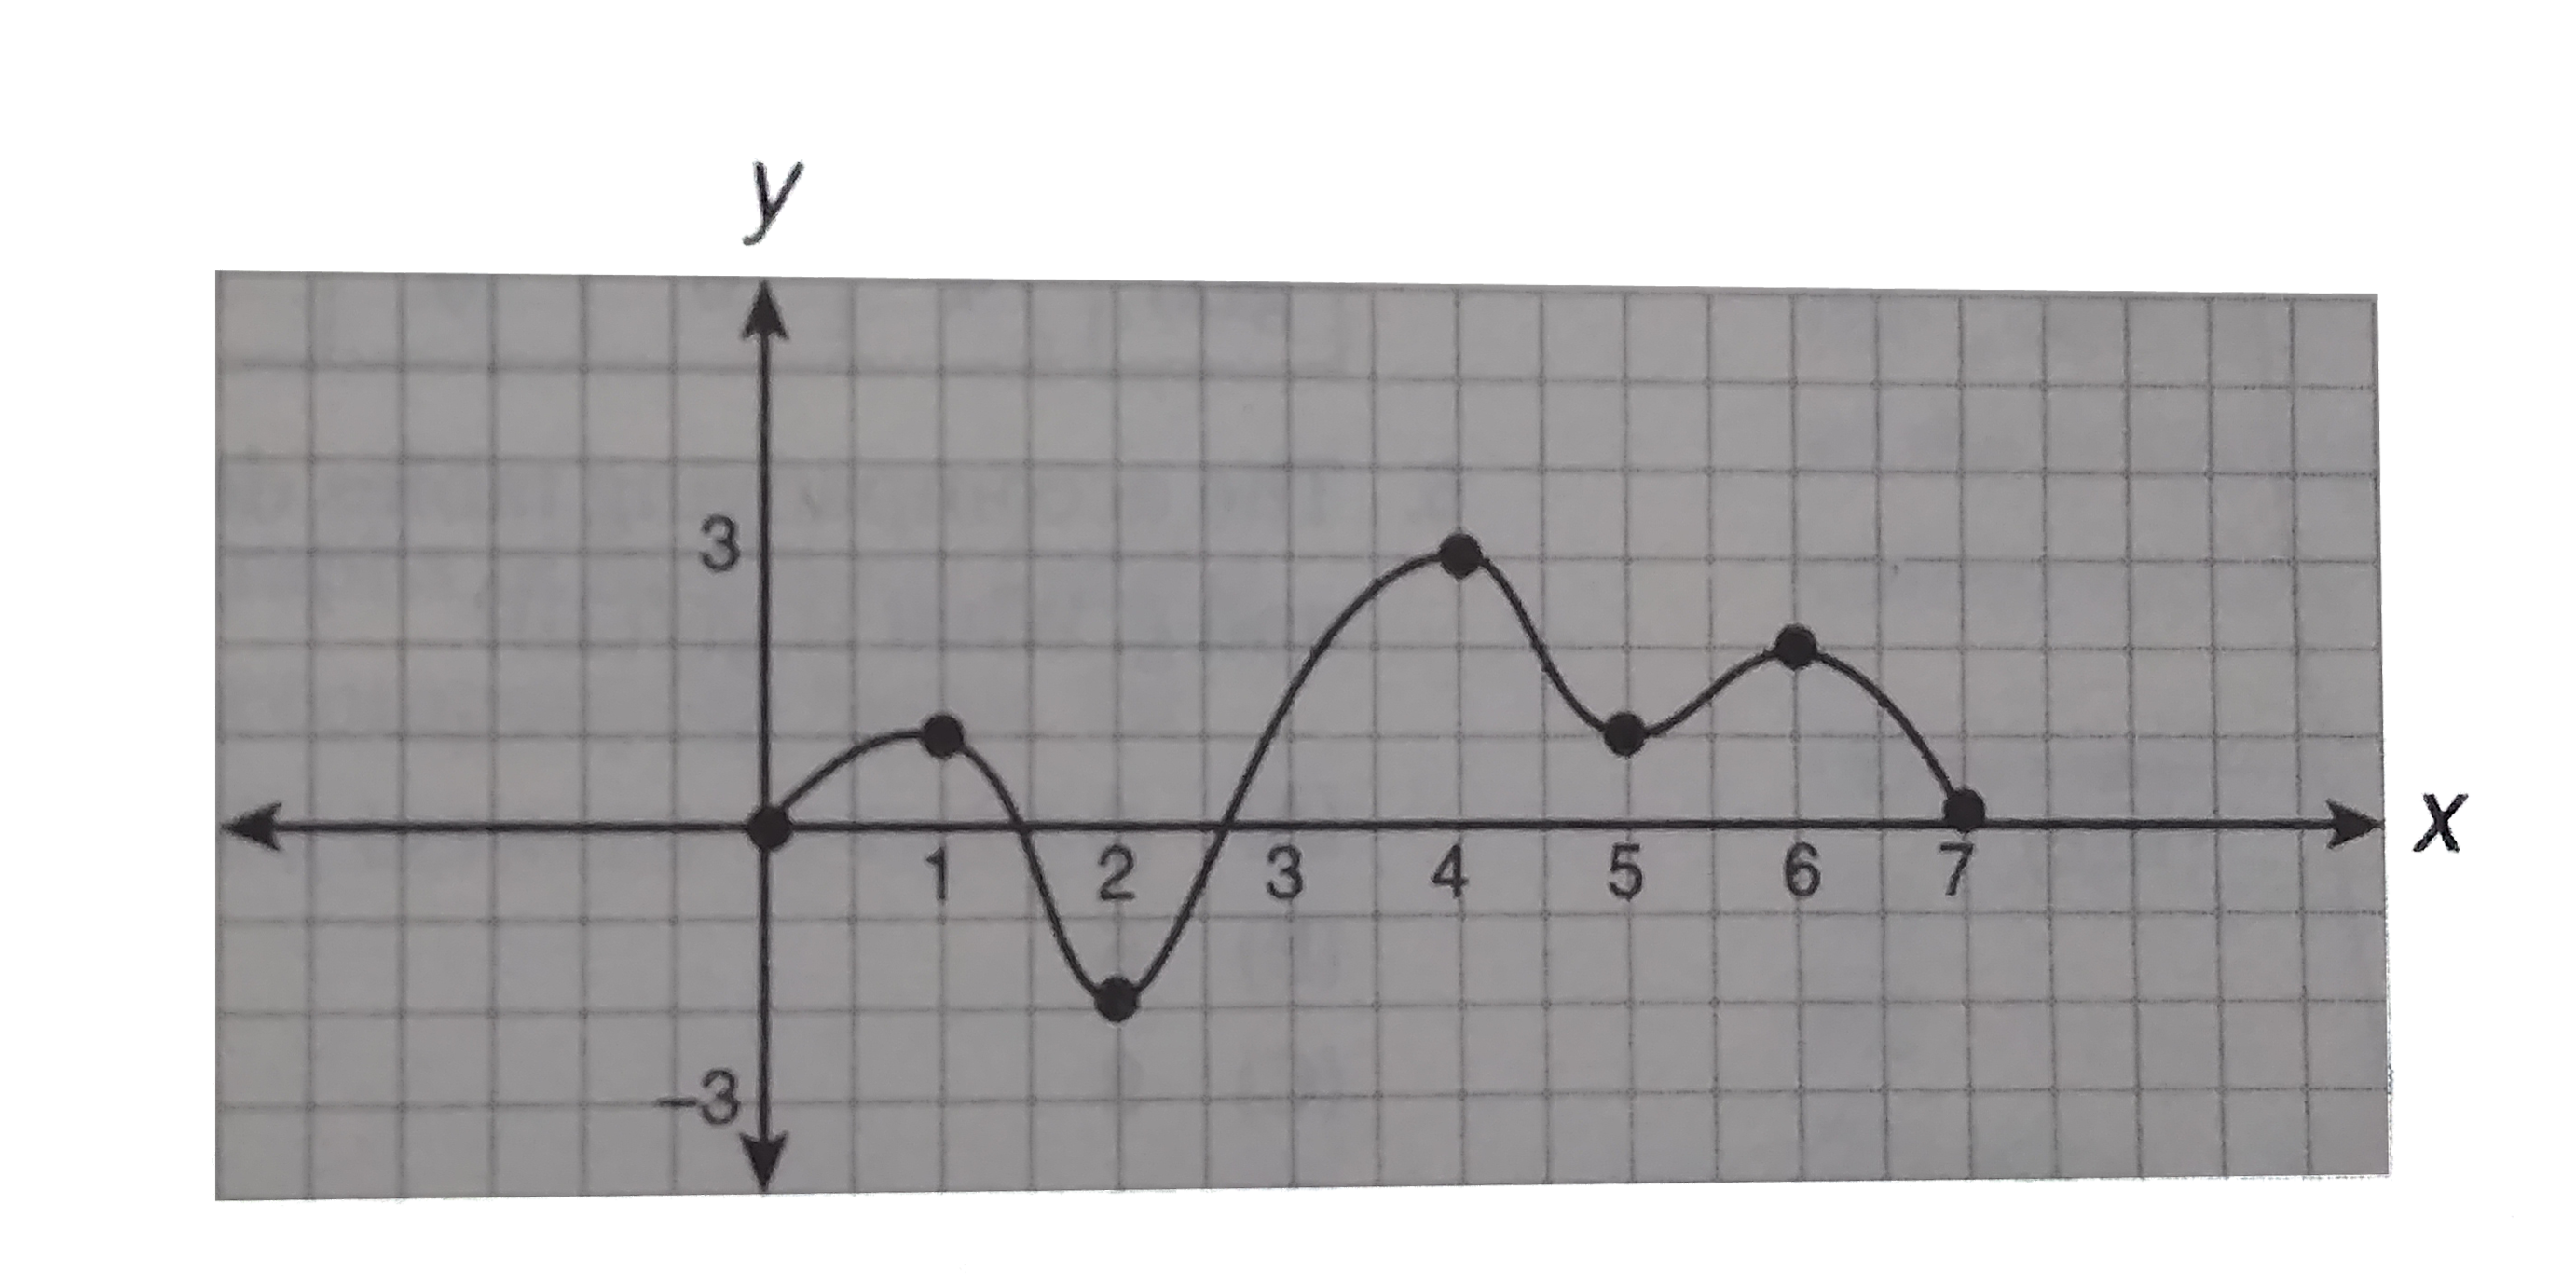
The graph above shows the function y=f(x) over the interval 0≤x≤7. What is the value of f(f(6))?View SolutionWhich graph(s) show(s) the correct distribution of potential (at the points between them) due to two like point charges. [X= distance from the charge on left]
View SolutionSix faces of a balanced die are numbered from integers 1 to 6. This die is tossed 60 times and the frequency distriction of the integers obtained is given below. Then the mean of the grouped data is
Integer123456Frequency89101698View Solution100 surnames were randomly picked up from a local telephone directly and the frequency distribution of the number of letters in the English alphabets in the surnames was obtained as follows: Number of letters: 1-4 4-7 7-10 10-13 13-16 16-19 Number surnames 6 30 40 16 4 4 Determine the median number of letters in the surnames. Find the mean number of letters in the surnames. Also, find the modal size of the surnames.
View SolutionIf the sum of the last 3 integers in a set of 6 consecutive integers is 624, what is the sum of the first 3 integers of the set?
View Solution
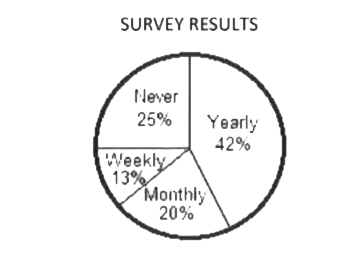
The circle graph abvoe shows the distribution of responses to a survey in which a group of people were asked how often they donate to charity. What fraction of those surveyed reported that they donate at least yearly?View SolutionFind the number of integers which lie between 1 and 106 and which have the sum of the digits equal to 12.
View SolutionConsider a collection of a large number of particles each with speed v. The direction of velocity is randomly distributed in the collection. Show that the magnitude of the relative velocity between a pair of particles averaged over all the pairs in the collection is greater than v.
View SolutionFor the given distribution showing the number of runs scored by 50 batsmen. Extimate the mode of the data :
 View Solution

