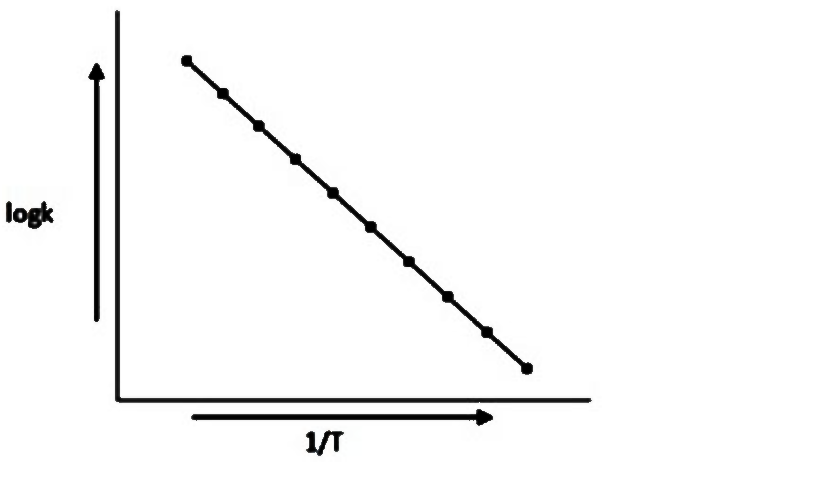
According to Arrhenius equation, the slope of the plot of logk against 1/T is .........Solution in Bengali
−Ea2.303R
Topper's Solved these Questions
- BOOK - CHHAYA PUBLICATIONCHAPTER - CHEMICAL KINETICSEXERCISE - EXERCISE (SHORT ANSWER-TYPE QUESTIONS)36videos
CHEMICAL KINETICS
- BOOK - CHHAYA PUBLICATIONCHAPTER - CHEMICAL KINETICSEXERCISE - EXERCISE (NUMERICAL PROBLEMS)37videos
CHEMICAL KINETICS
- BOOK - CHHAYA PUBLICATIONCHAPTER - CHEMICAL KINETICSEXERCISE - EXERCISE (VERY SHORT ANSWER -TYPE QUESTIONS)19videos
CHEMICAL KINETICS
- BOOK - CHHAYA PUBLICATIONCHAPTER - BIOMOLECULESEXERCISE - Practic Set 291videos
BIOMOLECULES
- BOOK - CHHAYA PUBLICATIONCHAPTER - CHEMICAL THERMODYNAMICSEXERCISE - Practice Set 615videos
CHEMICAL THERMODYNAMICS
Similar Questions
What do you mean by average rate and instantaneous rate of a reaction ? Give their mathematical expression.
02:13View Solution2A→4B+D , in this reaction, concentration of B increases to 2×10⁻³mol.L−1 after 10s from the start of the reaction . Calculate : rate of formation of B
01:22View SolutionGive two examples each of very fast and very slow reactions.
View SolutionWrite down the structure of tripeptide Gly-Ala-Val.
View SolutionThe condition for spontaneity of process is
02:47View SolutionAccording to the Arrhenius equation k = Ae^(-E_(a)//RT) a plot of ln k against 1//T yields:
03:13View SolutionIn accordance to Arrhenius equation, the plot of log k against (1)/(T) is a straight line. The slope of the line is equal to
View SolutionThe slope in Arrhenius plot, is equal to,
View SolutionWhich of the following plot is in accordance with the Arrhenius equation ?
02:05View SolutionWhen a plot between logk and 1/T is plotted we get the graph as shown.

What is the value of slope in the graph?01:46View SolutionIn Arrehenius equation if a graph is plotted between logK and 1/T, the slope of the curve will be:
03:19View SolutionRate constant k of a reaction varies with temperature T according to the following Arrhenius equation.
logklogAEa2.303R(1T) where Ea is the activation energy . When a graph is plotted is or logk Vs 1T a straight line with a slope of −400K is obtained . Calculate the activation energy .02:31View SolutionAccording to Arrhenius equation,the slope of log K→1T plot is………
01:14View SolutionFor the Arrhenius equation, the slope for the plot ln k vs 1T is
03:44View SolutionThe slope of line plotted between In k versus (1/T) Arrhenius equation is given by
View Solution

