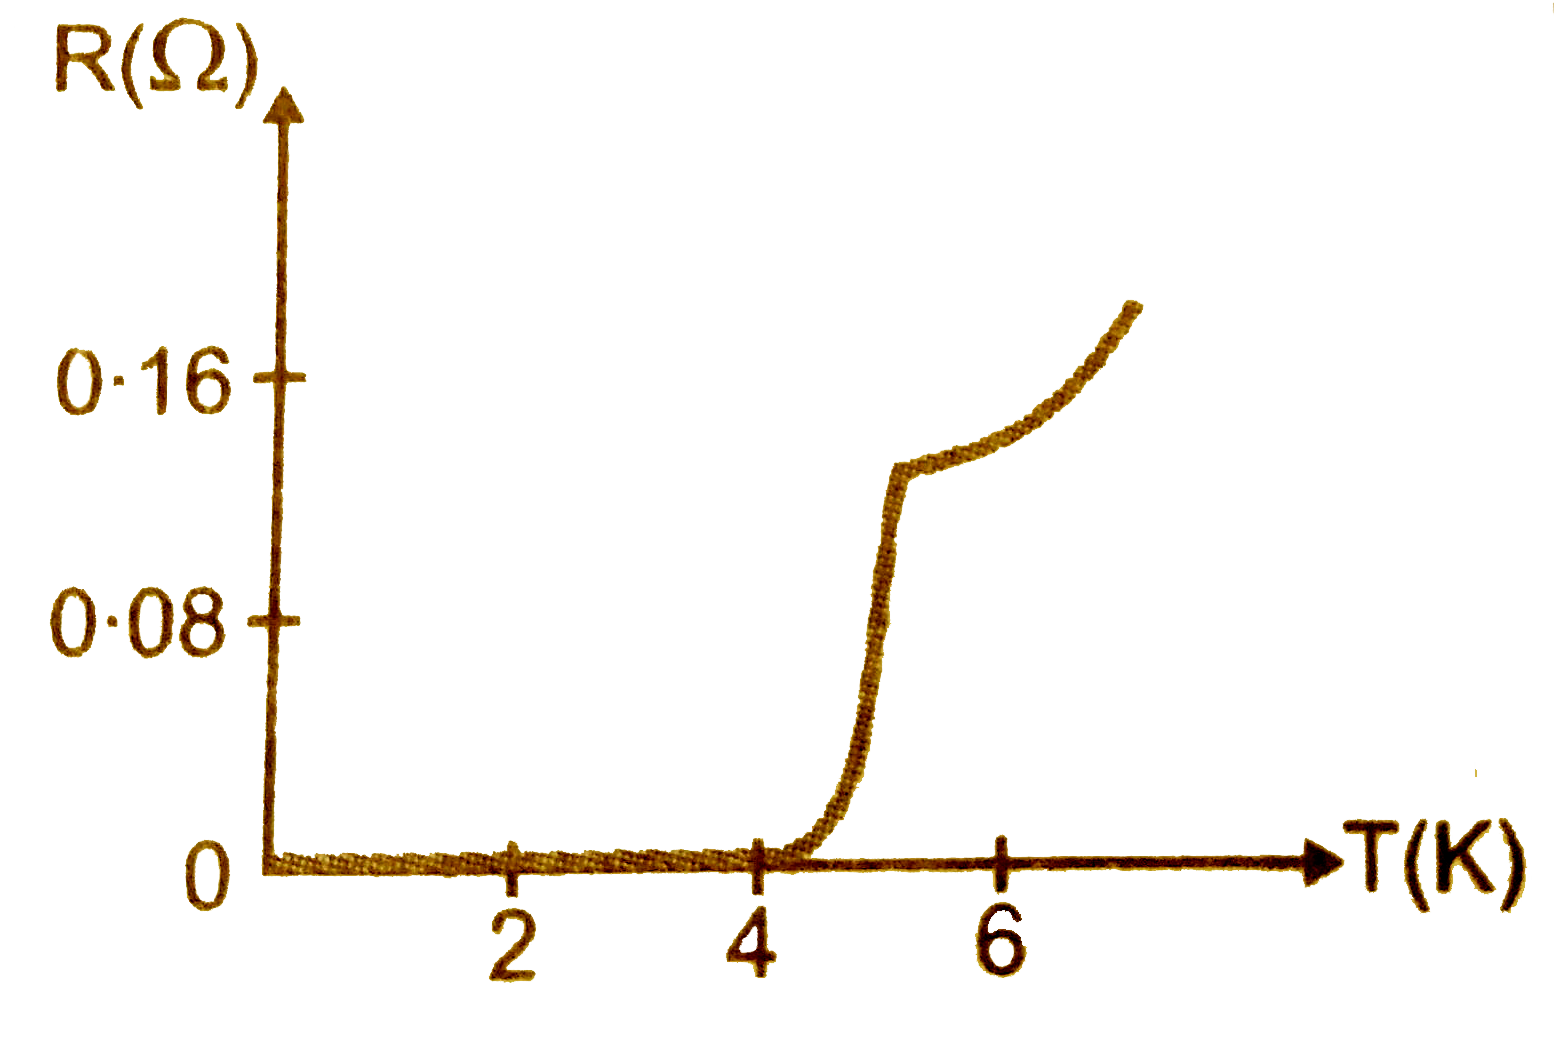
The graph given below shows the variation of resistance of mercury in the temperature range 0<T<4K. Name the phenomenon shown in the graph.

Text Solution
Super conductivity
|
Topper's Solved these Questions
- CURRENT ELECTRICITYBOOK - MODERN PUBLICATIONCHAPTER - CURRENT ELECTRICITYEXERCISE - REVISION EXERCISES (ADDITIONAL QUESTIONS)
11 Videos
- CURRENT ELECTRICITYBOOK - MODERN PUBLICATIONCHAPTER - CURRENT ELECTRICITYEXERCISE - REVISION EXERCISES (FILL IN THE BLANKS)
10 Videos
- CURRENT ELECTRICITYBOOK - MODERN PUBLICATIONCHAPTER - CURRENT ELECTRICITYEXERCISE - HIGHER ORDER THINKING SKILLS & ADVANCED LEVEL
10 Videos
- ATOMS BOOK - MODERN PUBLICATIONCHAPTER - ATOMS EXERCISE - Chapter Practice Test
16 Videos
- DUAL NATURE OF RADIATION AND MATTER BOOK - MODERN PUBLICATIONCHAPTER - DUAL NATURE OF RADIATION AND MATTER EXERCISE - CHAPTER PRACTICE TEST
15 Videos
Similar Questions
Knowledge Check
The correct graph which shows the variation of paramagnetic susceptibility S with temperature T is
A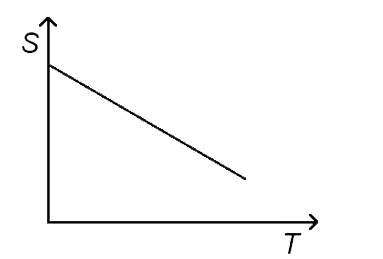 B
B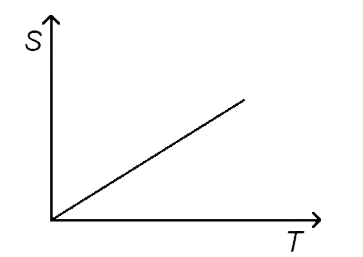 C
C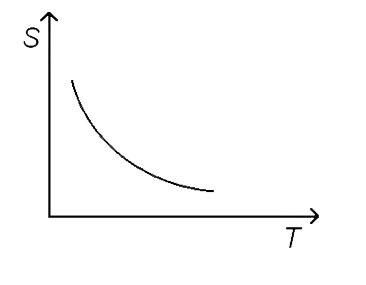 D
D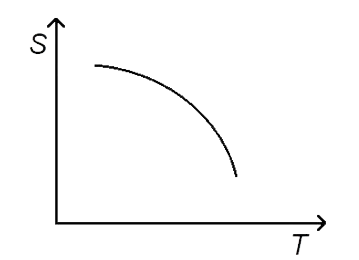
Show variation of resistivity of copper as a function of temperature in a graph.
View SolutionShow variation of resistivity of copper as a function of temperature in a graph.
View SolutionShow variation of resistivity of copper as a function of temperature in a graph.
View SolutionShow variation of resistivity of copper as a function of temperature in a graph.
View SolutionDraw a graph to show the variation in density of water with temperature in the temperature range from 0∘C to 10∘C.
View SolutionThe correct graph which shows the variation of paramagnetic susceptibility S with temperature T is
View SolutionShow on a graph the variation of resistivity with temperature for a typical semiconductor
View Solution

