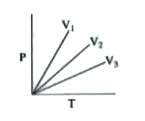
Under isochoric condition, graphs between P and T are shown below.Then volumes of gases are related as
 Solution in Telugu
The correct Answer is:C
Step by step video, text & image solution for Under isochoric condition, graphs between P and T are shown below.Then volumes of gases are related as by Chemistry experts to help you in doubts & scoring excellent marks in Class 12 exams.
Updated on:21/07/2023Topper's Solved these Questions
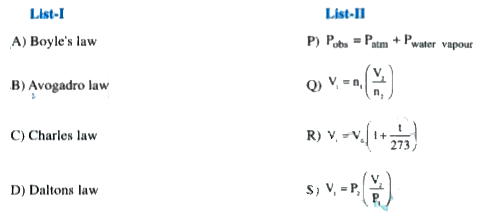
- STATES OF MATTER BOOK - AAKASH SERIESCHAPTER - STATES OF MATTER EXERCISE - LECTURE SHEET (EXERCISE-I) (MATRIX MATCHING TYPE QUESTIONS)
2 Videos
- STATES OF MATTER BOOK - AAKASH SERIESCHAPTER - STATES OF MATTER EXERCISE - LECTURE SHEET (EXERCISE-I) (INTEGER TYPE QUESTIONS)
3 Videos
- STATES OF MATTER BOOK - AAKASH SERIESCHAPTER - STATES OF MATTER EXERCISE - ADDITIONAL PRACTICE EXERCISE -PRACTICE SHEET (ADVANCED) (LINKED COMPREHENSION TYPE QUESTIONS) (PASSAGE- IV)
2 Videos
- SOLUTIONS BOOK - AAKASH SERIESCHAPTER - SOLUTIONS EXERCISE - Objective Exercise -4
50 Videos
- STOICHIOMETRYBOOK - AAKASH SERIESCHAPTER - STOICHIOMETRYEXERCISE - PRACTICE SHEET (ADVANCED) (INTEGER TYPE QUESTION)
2 Videos
Similar Questions
View SolutionTwo flasks of equal volumes have been joined by a narrow tube of negligible volume. Initially both the flasks are 300 K and totally 9 mole of gas is present. One of the flasks is then placed in a thermostat at 600K. How many moles of gas is present in hot bulb.
View SolutionAt a particular temperature and pressure for a real gas Van der Waal's equation can be written as:
(P+aV2m)(Vm−b)=RT
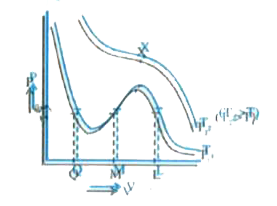
where Vm is molar volume of gas. This is cubic equation in the variable Vm and therefore for any single value of P & T there should be 3 values of Vm. Which are shown in graph as Q, M and L.
As temperature is made to increase at a certain higher temperature the three values of Vm becomes identical. The temperature, pressure & molar volume at point X are called Tc, Pc & Vc for real gas. The compressibility factor in terms of Pc, Vc and T is called Zc.
The expression of Van dcr Waal's constant 'a' can be given as
View SolutionAssertion : Molarity of a solution decreases with an increase of temperature
Reason : As temperature increases volume of the solution increases.
View SolutionAmmonia is oxised by oxygen to give nitric oxide and water. The weight of water produced per gram of nitric oxide is 0.1×xg. What is value of d.
View SolutionStraight line on (p - T) graph for an ideal gas represents isochoric process.
If p∝T,V=constant.
View SolutionThe P-T graph for the given mass of an ideal gas is shown in figure. Then the volume
View SolutionP-T graph for same number of moles of two ideal gases are shown . Find the path along which volume decreases .
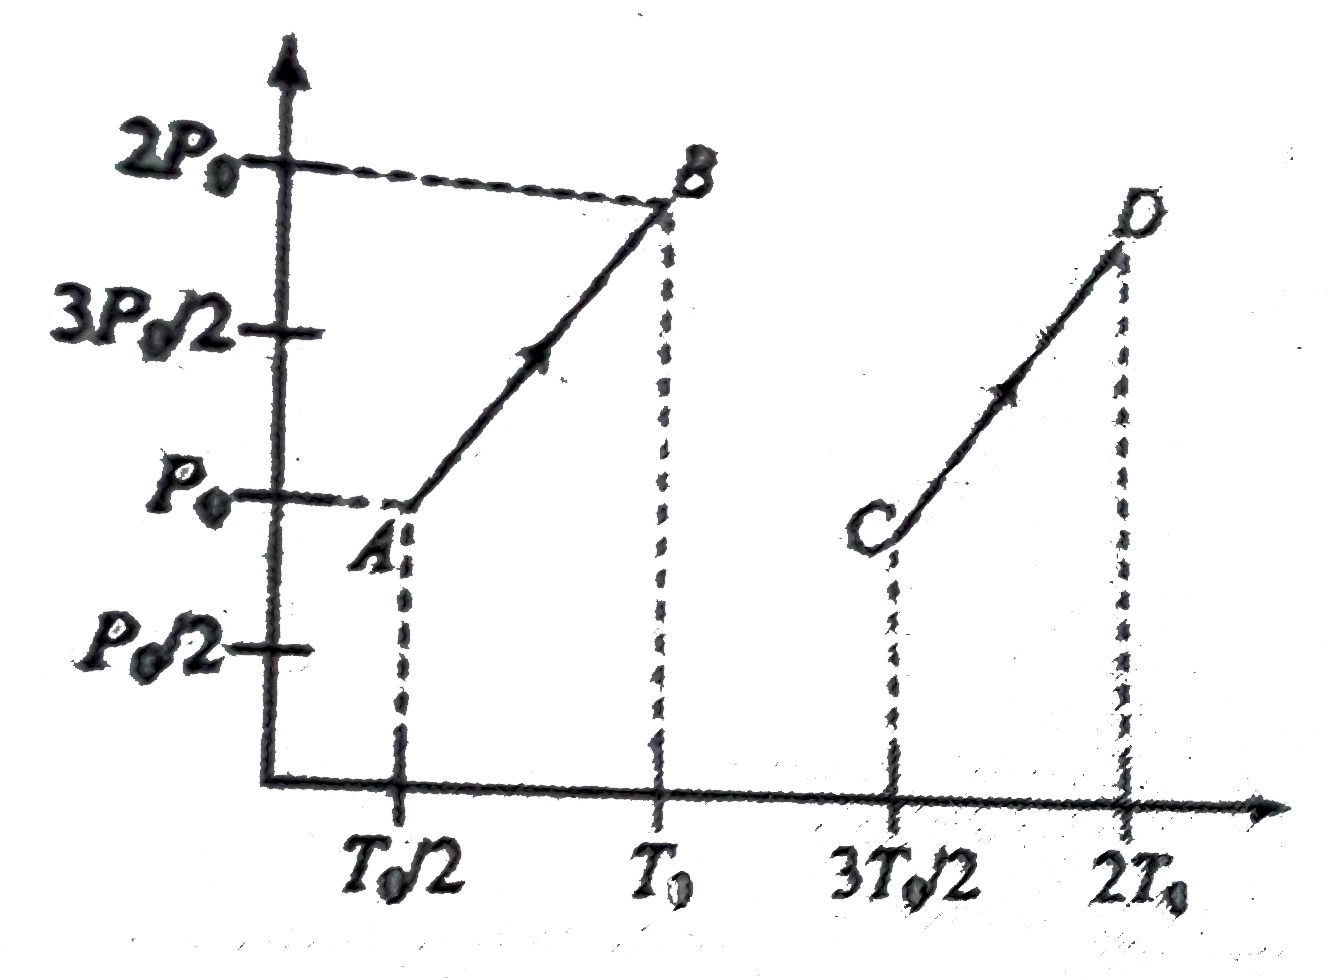
View SolutionA gas has been subjected to a cycle of isochoric, isothermal process 1-2-3-4-1 as shown in the figure. The graph for this cycle on P-T diagram is
View SolutionThe graph between (P/T) and T for a gas at constant volume will be:
View SolutionThe ideal gas equation for 1 mol of ideal gas is PV = nRT
graph between P and T at constant volume, i.e. isochores are plotted as under
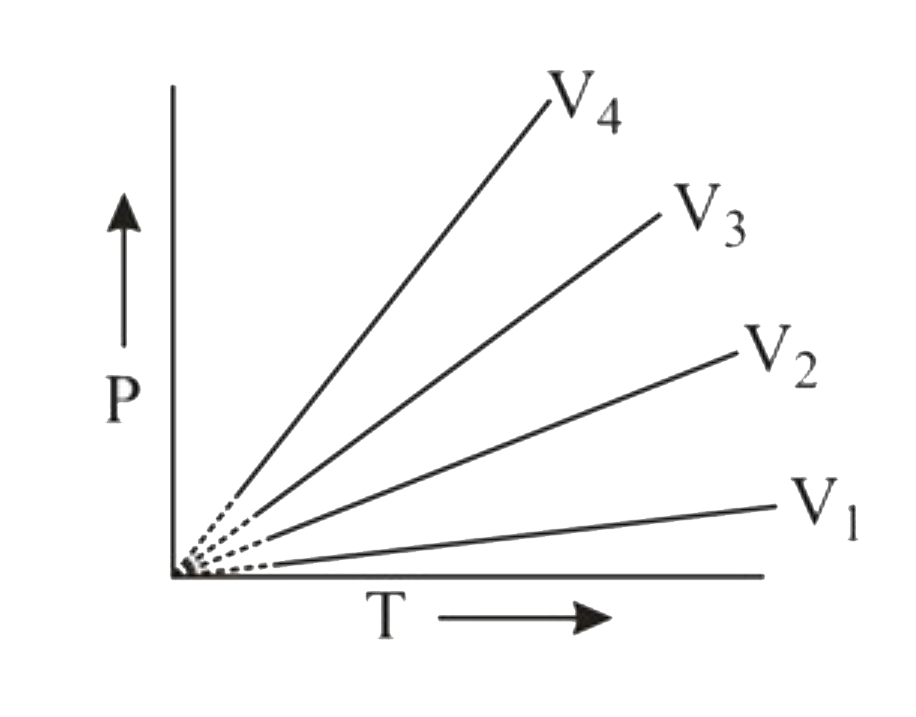
Which of the following order of volume is correct ?
View SolutionExplain relation between pressure - volume and density of gases.
View SolutionPlot P-V, V-T and p-T graph correspongidng to the P-T graph for an ideal gas shown in figure.
View SolutionThe P-T graph for the given mass of an ideal gas is shown in figure. Then the volume
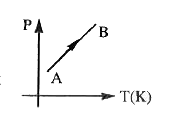
View SolutionThe slope of P-V graph for isochoric process is
View Solution
