
Frequency curves for the distribution of blood pressure readings of certain anthletes before exercise (A) and after exercise (B) are plotted together as shown in the figure above. From the frequency curves, which one of hte following can be concluded?
Both distributions are identical
Both distributions have the same mean value
Both distributions have the same bean value but different variance
Both distributions have the same variance but different mean values
The correct Answer is:D
From observation of the graph it is noted the nature is similar, but are centered around different values, hence, they have same variance, but different mean values.
Topper's Solved these Questions
- SETS, RELATIONS, FUNCTIONS AND NUMBER SYSTEM BOOK - NDA PREVIOUS YEARSCHAPTER - SETS, RELATIONS, FUNCTIONS AND NUMBER SYSTEM EXERCISE - MCQ
271 Videos
- TRIGONOMETRY - RATIO & IDENTITY , TRIGONOMETRIC EQUATIONSBOOK - NDA PREVIOUS YEARSCHAPTER - TRIGONOMETRY - RATIO & IDENTITY , TRIGONOMETRIC EQUATIONSEXERCISE - MCQ
238 Videos
Similar Questions

The frequency curve for the distribution of income in a region is positively skewed as shown in the figure above. Then, for this distribution
View SolutionA lake filled with water has depth H, A pipe of length slightly less than H lies at the bottom of the lake. It contains an ideal gas filled up to a length of H10 A smooth an ideal gas filled up to a length gas in place. Now the pipe is slowly raised to vertical position (see figure). Assume that temperature of the gas remains Constant and neglect the atmospheric pressure.
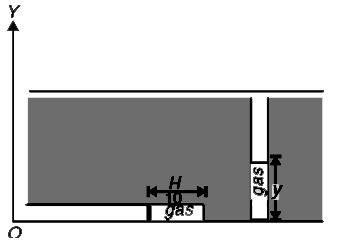
(a) Plot the variation of pressure inside the lake as a function of height y from the base. Let the height of piston frm the base, after the pipe is made vertical, by y. plot the variation of gas pressure as a function of y in the first graph itself.
(b) In equilibrium the gas pressure and the pressure due to water on the piston must be equal. Using this solve for equilibrium height y0 of the piston. You get two answers. Which one is correct and why?
View Solution
Knowledge Check
The functional declines of advancing age are depressing. The heart's ablity to pump blood drops about one per cent: blood flow to arms and legs decreases by thirty to forty per cent in old age. The amount of air a person can exhale after a deep breath lessens and the chest wall stiffens with age. However, recent studies have shown that most of these age-associated eclines can be delayed by exercise. Exercise lowers the resting heart-rate and increases the amount of blood pumped with each beat in older people. When stress is placed on bones through exercise, calcium content rises, with the result that resistance to fracture is improved.
'Which one of the following statements is correct?AExercise delays natural decay of old ageBOld age problems increase due to exerciseCExercise increases the heart-beat which is dangerousDExercise creates stress which is harmful to bonesThe following questions are based on the diagram given below showing four persons stationed at the four corners of a square piece of plot as shown.
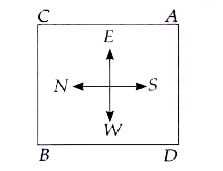
From the original position given in the above figure, A and B move one arm length clockwise and then cross over to the comer diagonally opposite, C and D move one arm.length anti-clockwise and cross over the corner diagonally opposite. The original configuration ADBC has now changed toACBDABBDACCDACBDACBDSketch shows the plot of Z v/s P for a hypothetical gas for one mole at three distint temperature.
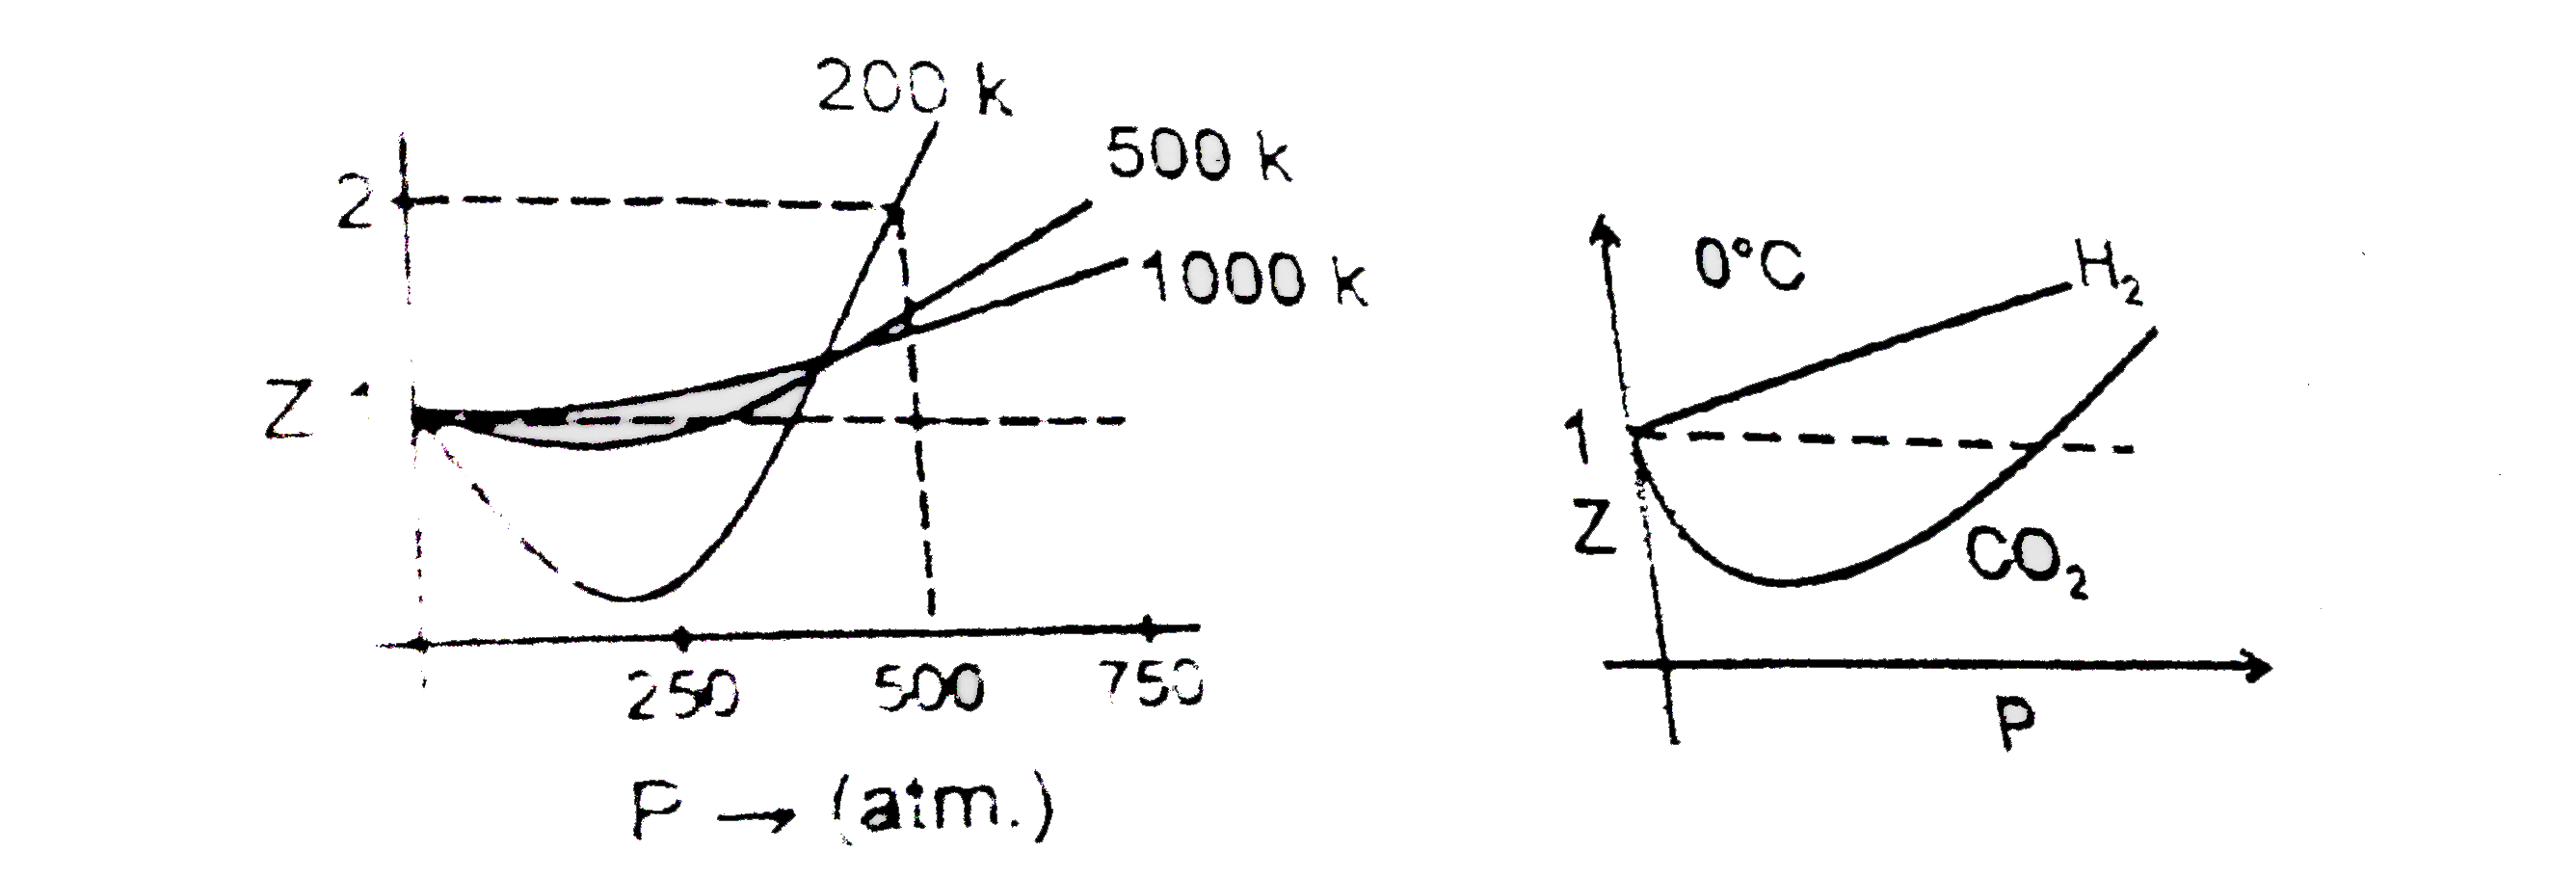
Boyle's temperature is the temperature at which gas shows ideal behaviour over a pressure range in the low pressure region.Boyle's temperature (Tb)=aRb.If a plot is obtained at temperature well below Boyle's temperature then the curve will show negative deviation, in low pressure region and positive deviation in the high pressure region. Near critical temperature the curve is more likely as CO2 and the temperature well above critical temperature curve is more like H2 at 0∘C as shown above.At high pressure suppose all the constant temperature curve varies linearly with pressure according to the following equation : Z=1+PbRT (R=2calmol−1K−1)
As shown in the figure at 200 K and 500 atm value of compressibility factor is 2 (approx).Then volume of the gas at the point will beA0.01 LB0.09LC0.065 LD0.657 L
Consider the following statements pertaining to a frequency polygon of a frequency distribution of a continuous variable with seven class intervals of equal width:
1. The original frequency distribution can be reconstructed from the frequency polygon.
2. The frequency polygon touches the x-axis in its extreme right and extreme left.
Which of the above statements is/are correct?
View SolutionSketch shows the plot of Z v/s P for a hypothetical gas for one mole at three distint temperature.
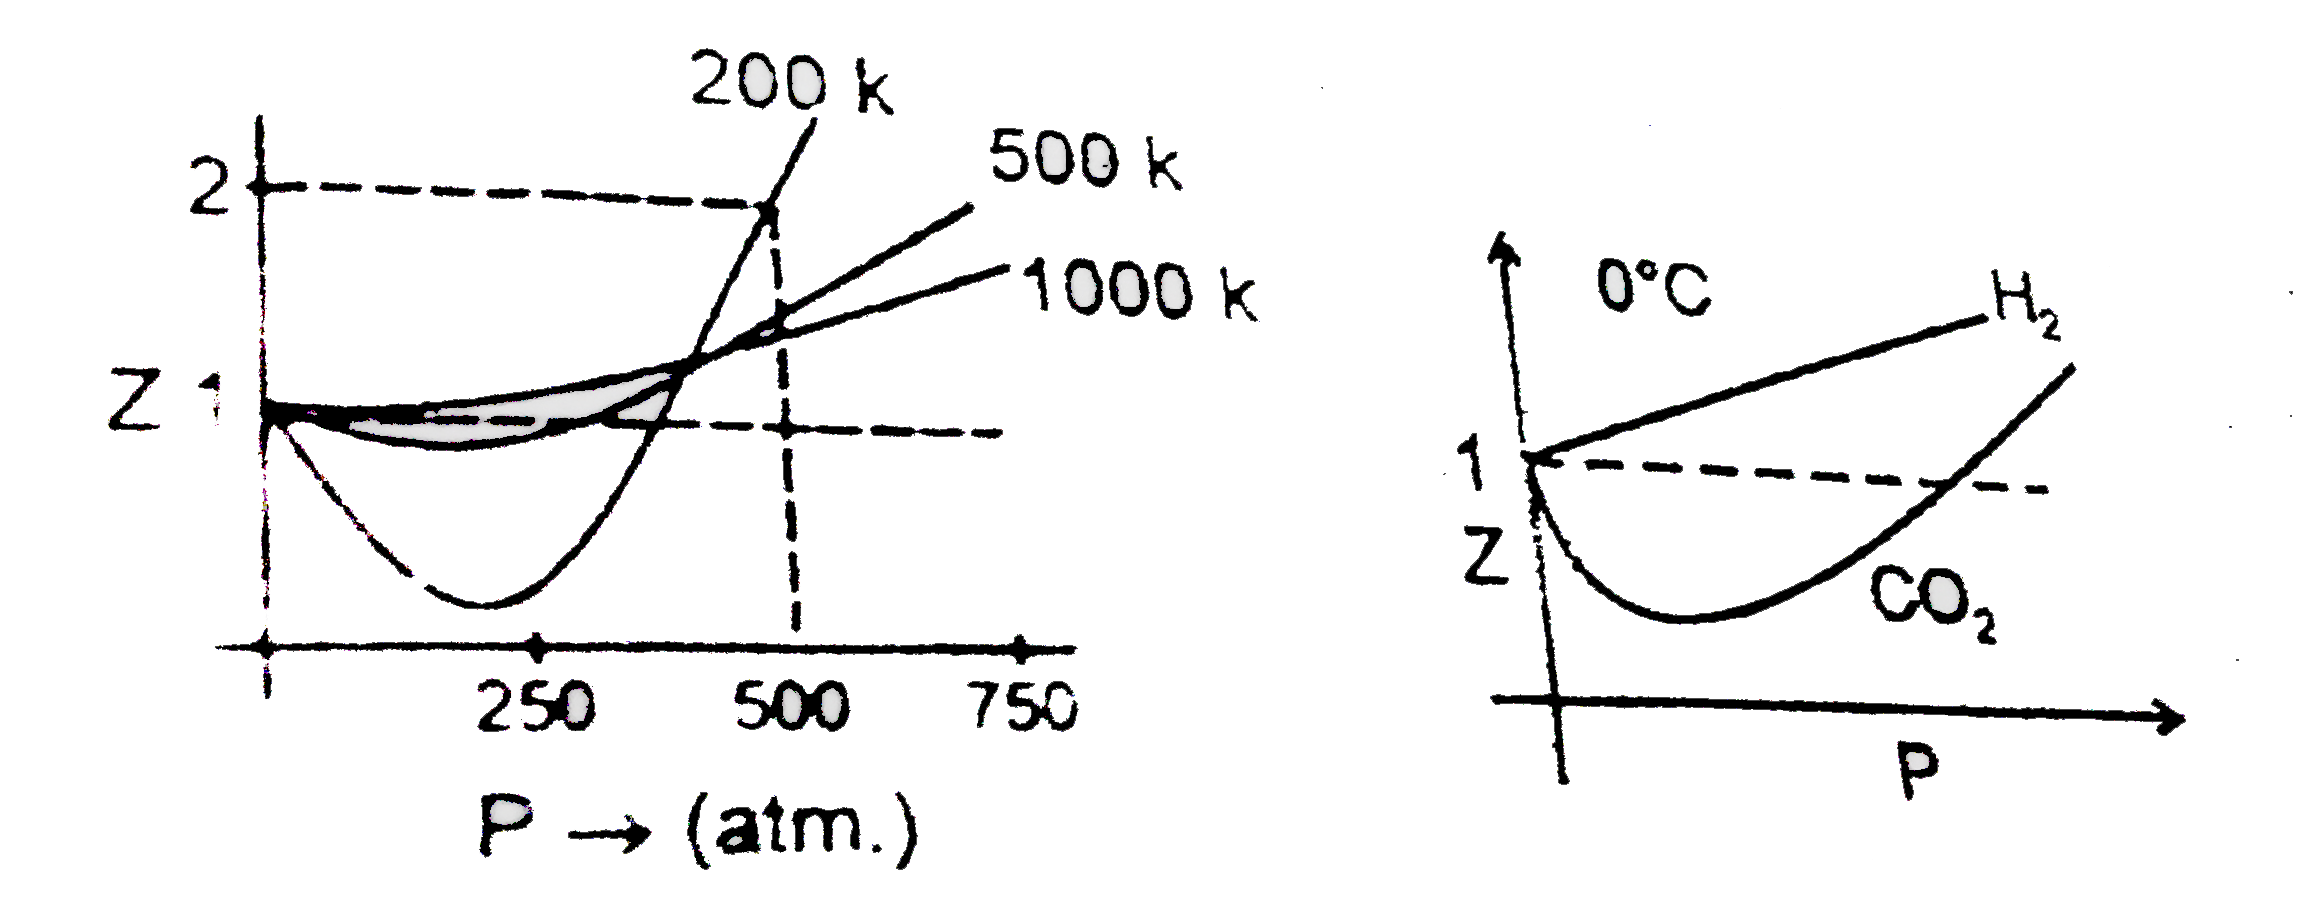
Boyle's temperature is the temperature at which gas shows ideal behaviour over a pressure range in the low pressure region.Boyle's temperature (Tb)=aRb.If a plot is obtained at temperature well below Boyle's temperature then the curve will show negative deviation, in low pressure region and positive deviation in the high pressure region. Near critical temperature the curve is more likely as CO2 and the temperature well above critical temperature curve is more like H2 at 0∘C as shown above.At high pressure suppose all the constant temperature curve varies linearly with pressure according to the following equation : Z=1+PbRT (R=2calmol−1K−1)
Plot at Boyle's temperature for the gas will be
View SolutionSketch shows the plot of Z v/s P for a hypothetical gas for one mole at three distint temperature.
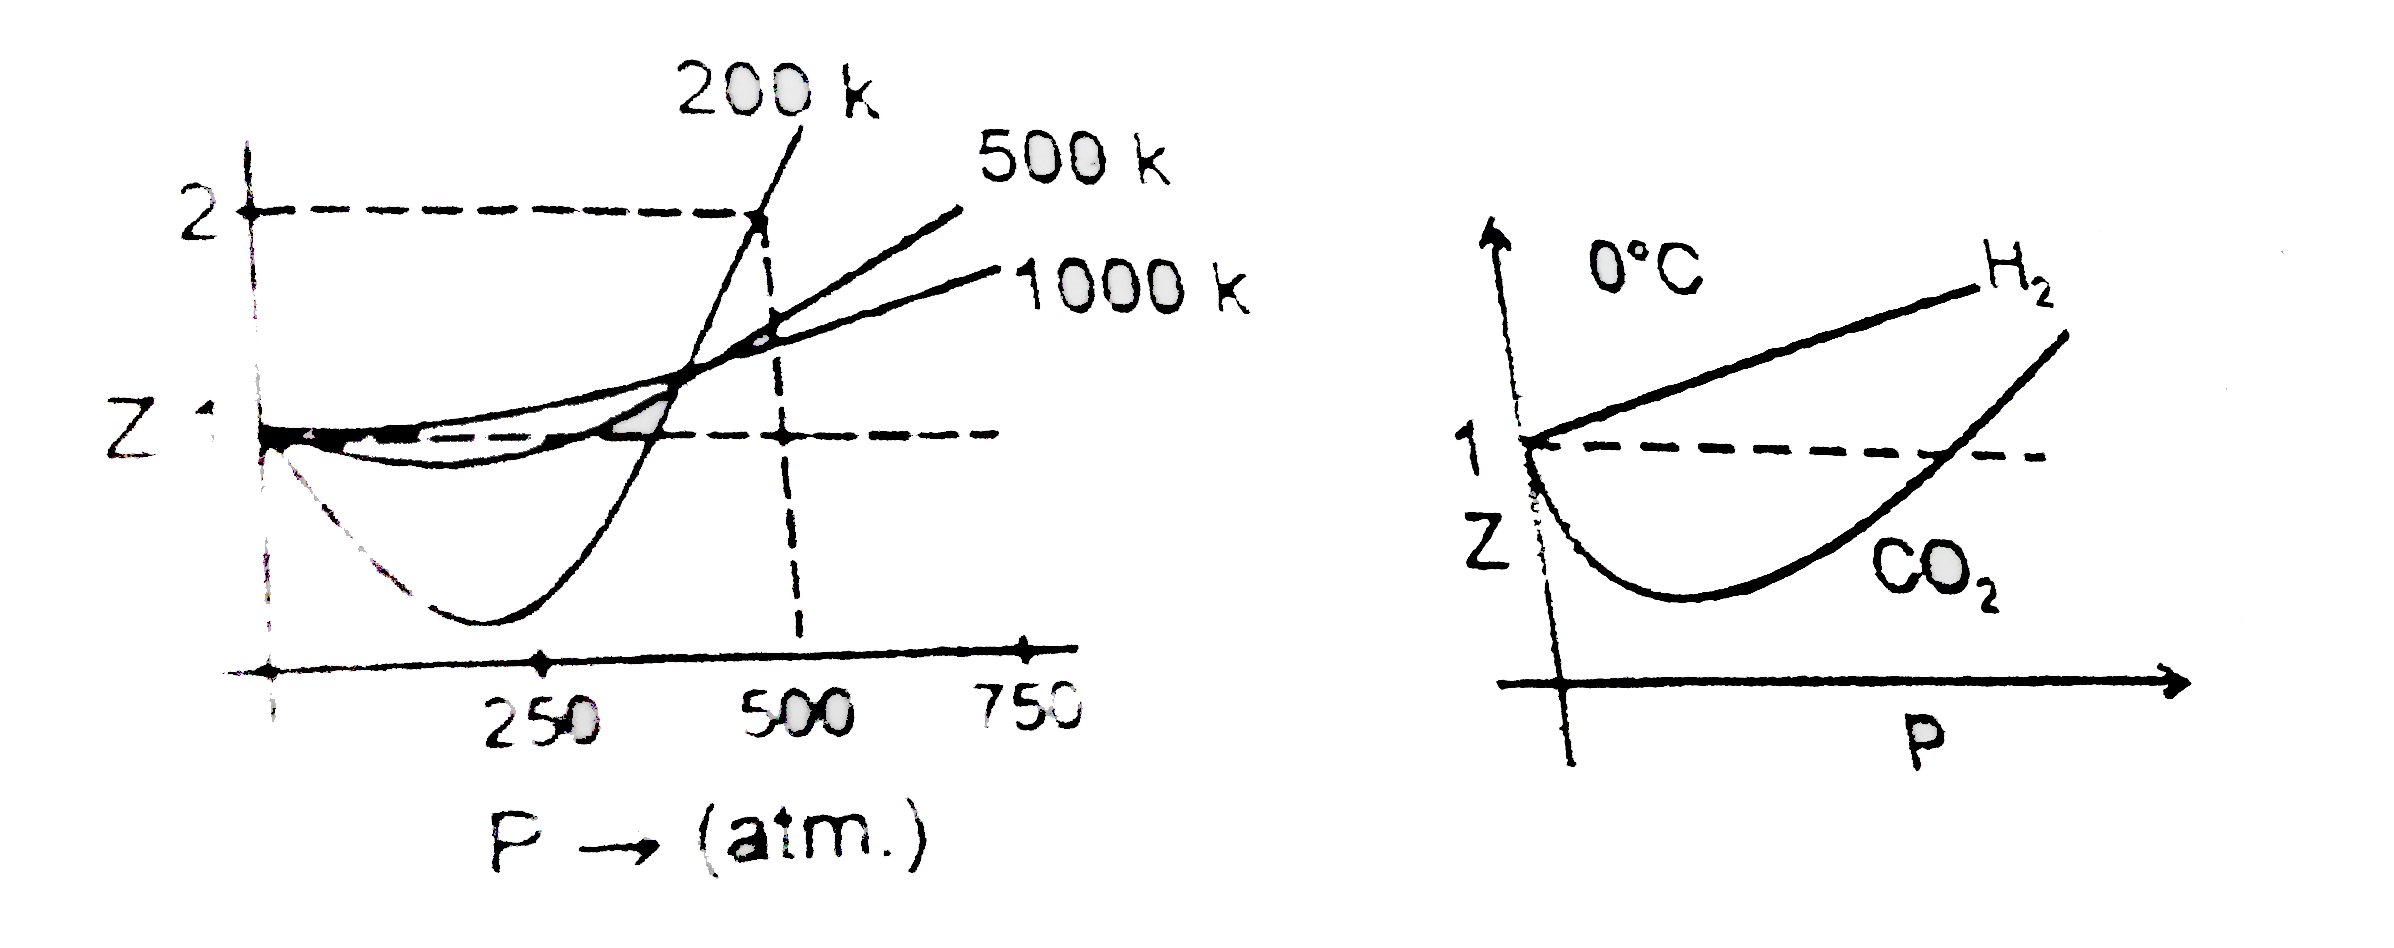
Boyle's temperature is the temperature at which gas shows ideal behaviour over a pressure range in the low pressure region.Boyle's temperature (Tb)=aRb.If a plot is obtained at temperature well below Boyle's temperature then the curve will show negative deviation, in low pressure region and positive deviation in the high pressure region. Near critical temperature the curve is more likely as CO2 and the temperature well above critical temperature curve is more like H2 at 0∘C as shown above.At high pressure suppose all the constant temperature curve varies linearly with pressure according to the following equation : Z=1+PbRT (R=2calmol−1K−1)
Which of the following is correct :
View SolutionSketch shows the plot of Z v/s P for a hypothetical gas for one mole at three distint temperature.
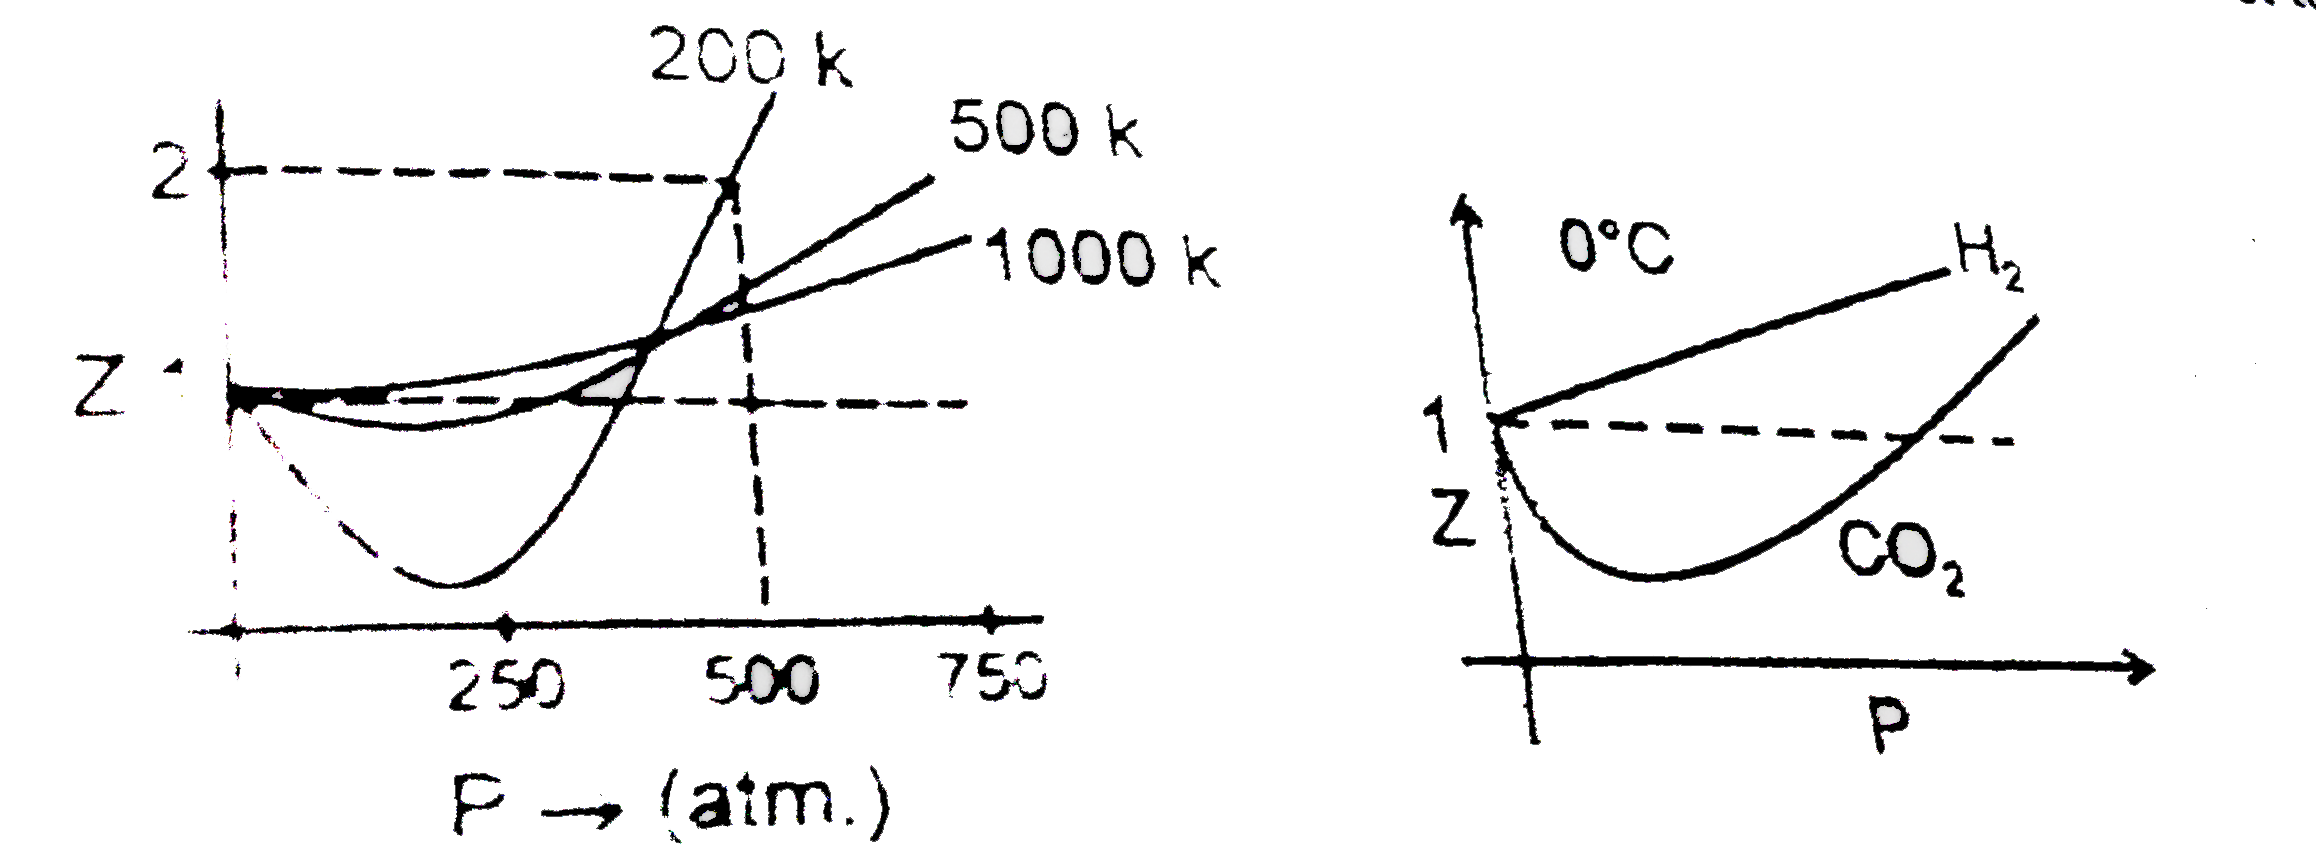
Boyle's temperature is the temperature at which gas shows ideal behaviour over a pressure range in the low pressure region.Boyle's temperature (Tb)=aRb.If a plot is obtained at temperature well below Boyle's temperature then the curve will show negative deviation, in low pressure region and positive deviation in the high pressure region. Near critical temperature the curve is more likely as CO2 and the temperature well above critical temperature curve is more like H2 at 0∘C as shown above.At high pressure suppose all the constant temperature curve varies linearly with pressure according to the following equation : Z=1+PbRT (R=2calmol−1K−1)
For 500 K plot value of Z changes from 2 to 2.2 if pressure is varied from 1000 atm to 1200 atm (high pressure ) then the value of bRT will be
View SolutionSketch shows the plot of Z v/s P for a hypothetical gas for one mole at three distint temperature.
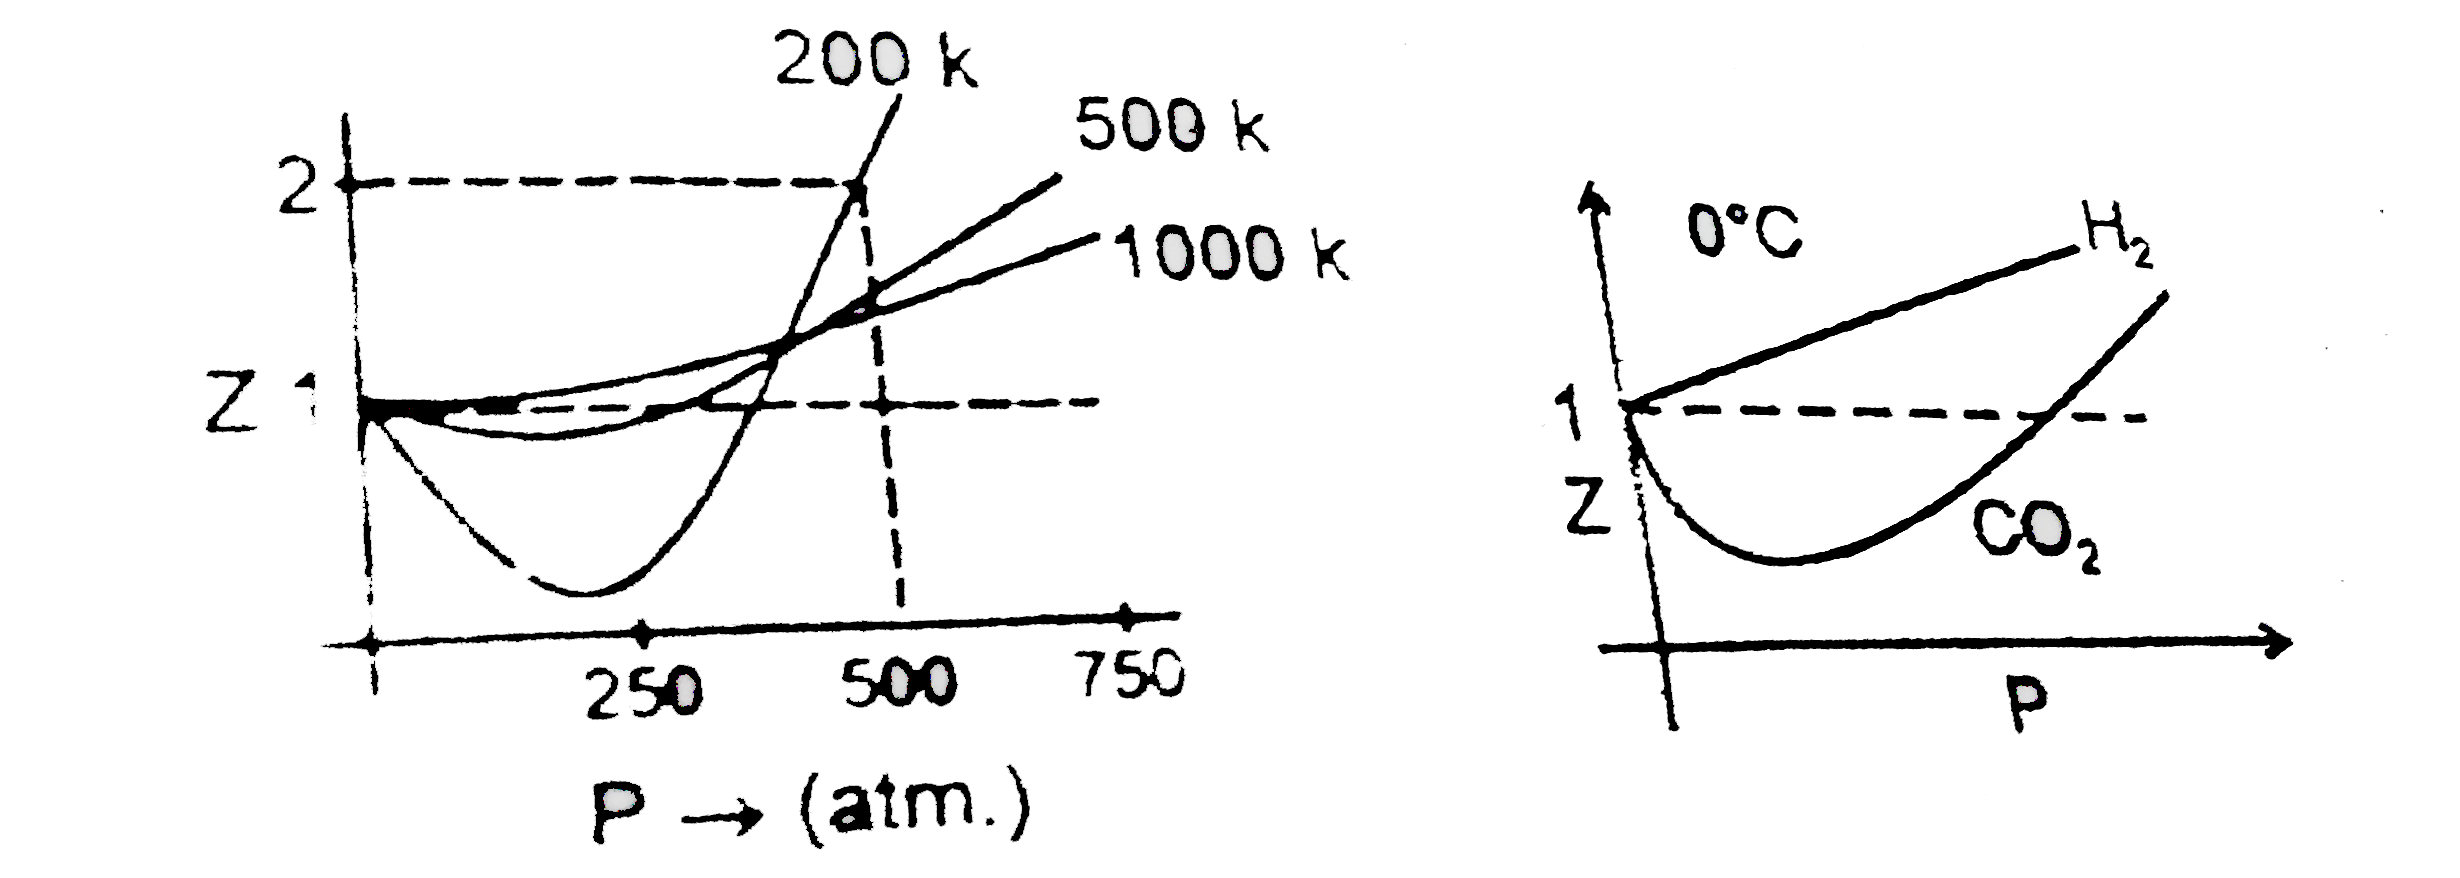
Boyle's temperature is the temperature at which gas shows ideal behaviour over a pressure range in the low pressure region.Boyle's temperature (Tb)=aRb.If a plot is obtained at temperature well below Boyle's temperature then the curve will show negative deviation, in low pressure region and positive deviation in the high pressure region. Near critical temperature the curve is more likely as CO2 and the temperature well above critical temperature curve is more like H2 at 0∘C as shown above.At high pressure suppose all the constant temperature curve varies linearly with pressure according to the following equation : Z=1+PbRT (R=2calmol−1K−1)
In very high pressure region if Z v/s P is plotted at 1200 K for the above gas then it will have greatest slope.
View Solution
