For 8g of helium gas (assume ideal behaviour), what is the slope of the straight line in PV VS T graph Solution in Telugu
1 lt. atm. K−1
0.0821 lt. atm. K−1
0.1642 lt. atm .K−1
2 lt. atm . K−1
The correct Answer is:C
PV=nRT.
PV = vs T slop = nR = 84×0.0821
=2×0.0821=0.1642.
Topper's Solved these Questions
- BOOK - AAKASH SERIESCHAPTER - STATES OF MATTEREXERCISE - PRACTICE SHEET (EXERCISE -I) (LEVEL -II ADVANCED)(MORE THAN ONE CORRECT ANSWER TYPE QUESTIONS)4videos
STATES OF MATTER
- BOOK - AAKASH SERIESCHAPTER - STATES OF MATTEREXERCISE - PRACTICE SHEET (EXERCISE -I) (LEVEL -II ADVANCED)(LINKED COMPREHENSION TYPE QUESTIONS)3videos
STATES OF MATTER
- BOOK - AAKASH SERIESCHAPTER - STATES OF MATTEREXERCISE - PRACTICE SHEET (EXERCISE -I) (LEVEL -I MAINS)(STRAIGHT OBJECTIVE TYPE QUESTIONS)9videos
STATES OF MATTER
- BOOK - AAKASH SERIESCHAPTER - SATURATED HYDROCARBONSEXERCISE - QUESTIONS FOR DESCRIPTIVE ANSWERS10videos
SATURATED HYDROCARBONS
- BOOK - AAKASH SERIESCHAPTER - STOICHIOMETRYEXERCISE - QUESTIONS FOR DESCRIPTIVE ANSWERS59videos
STOICHIOMETRY
Similar Questions
Which of the following shows correct relation between volume and temperature at constant pressure for a given amount of gas
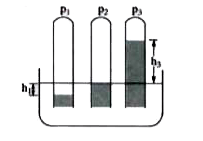
03:28View SolutionConsider gases confined by a liquid, as shown below. Density of the liquid = d.gmL−1h1andh3 in mm and p1,p2andp3 in mm Hg.

Barometric pressure is equal to03:21View SolutionWhen the pressure of 2 litres of O2 gas is doubled and its temperature is also doubled from 300K to 600K, the final volume of the gas is
01:07View SolutionWhy boiling and melting points of hydrocarbons are low ?
View SolutionDistinguish between element and compound?
05:23View SolutionWhich of the following graphs is inconsistent with ideal gas behaviour ? (Assume n = constant)
02:54View SolutionWhich graph is not a straight line for an ideal gas ?
02:39View SolutionIf the graph of concentration of [A] vs T for completion of reaction is a straight line, then the order of reaction is
05:32View SolutionA graph is plotted between p (atm) vs t^(@)C for 10 mol of an ideal gas as follows: Then slope of curve and volume of container (L) respectively, are:
02:12View SolutionWhich of the following graphs is not a straight line for an ideal gas ?
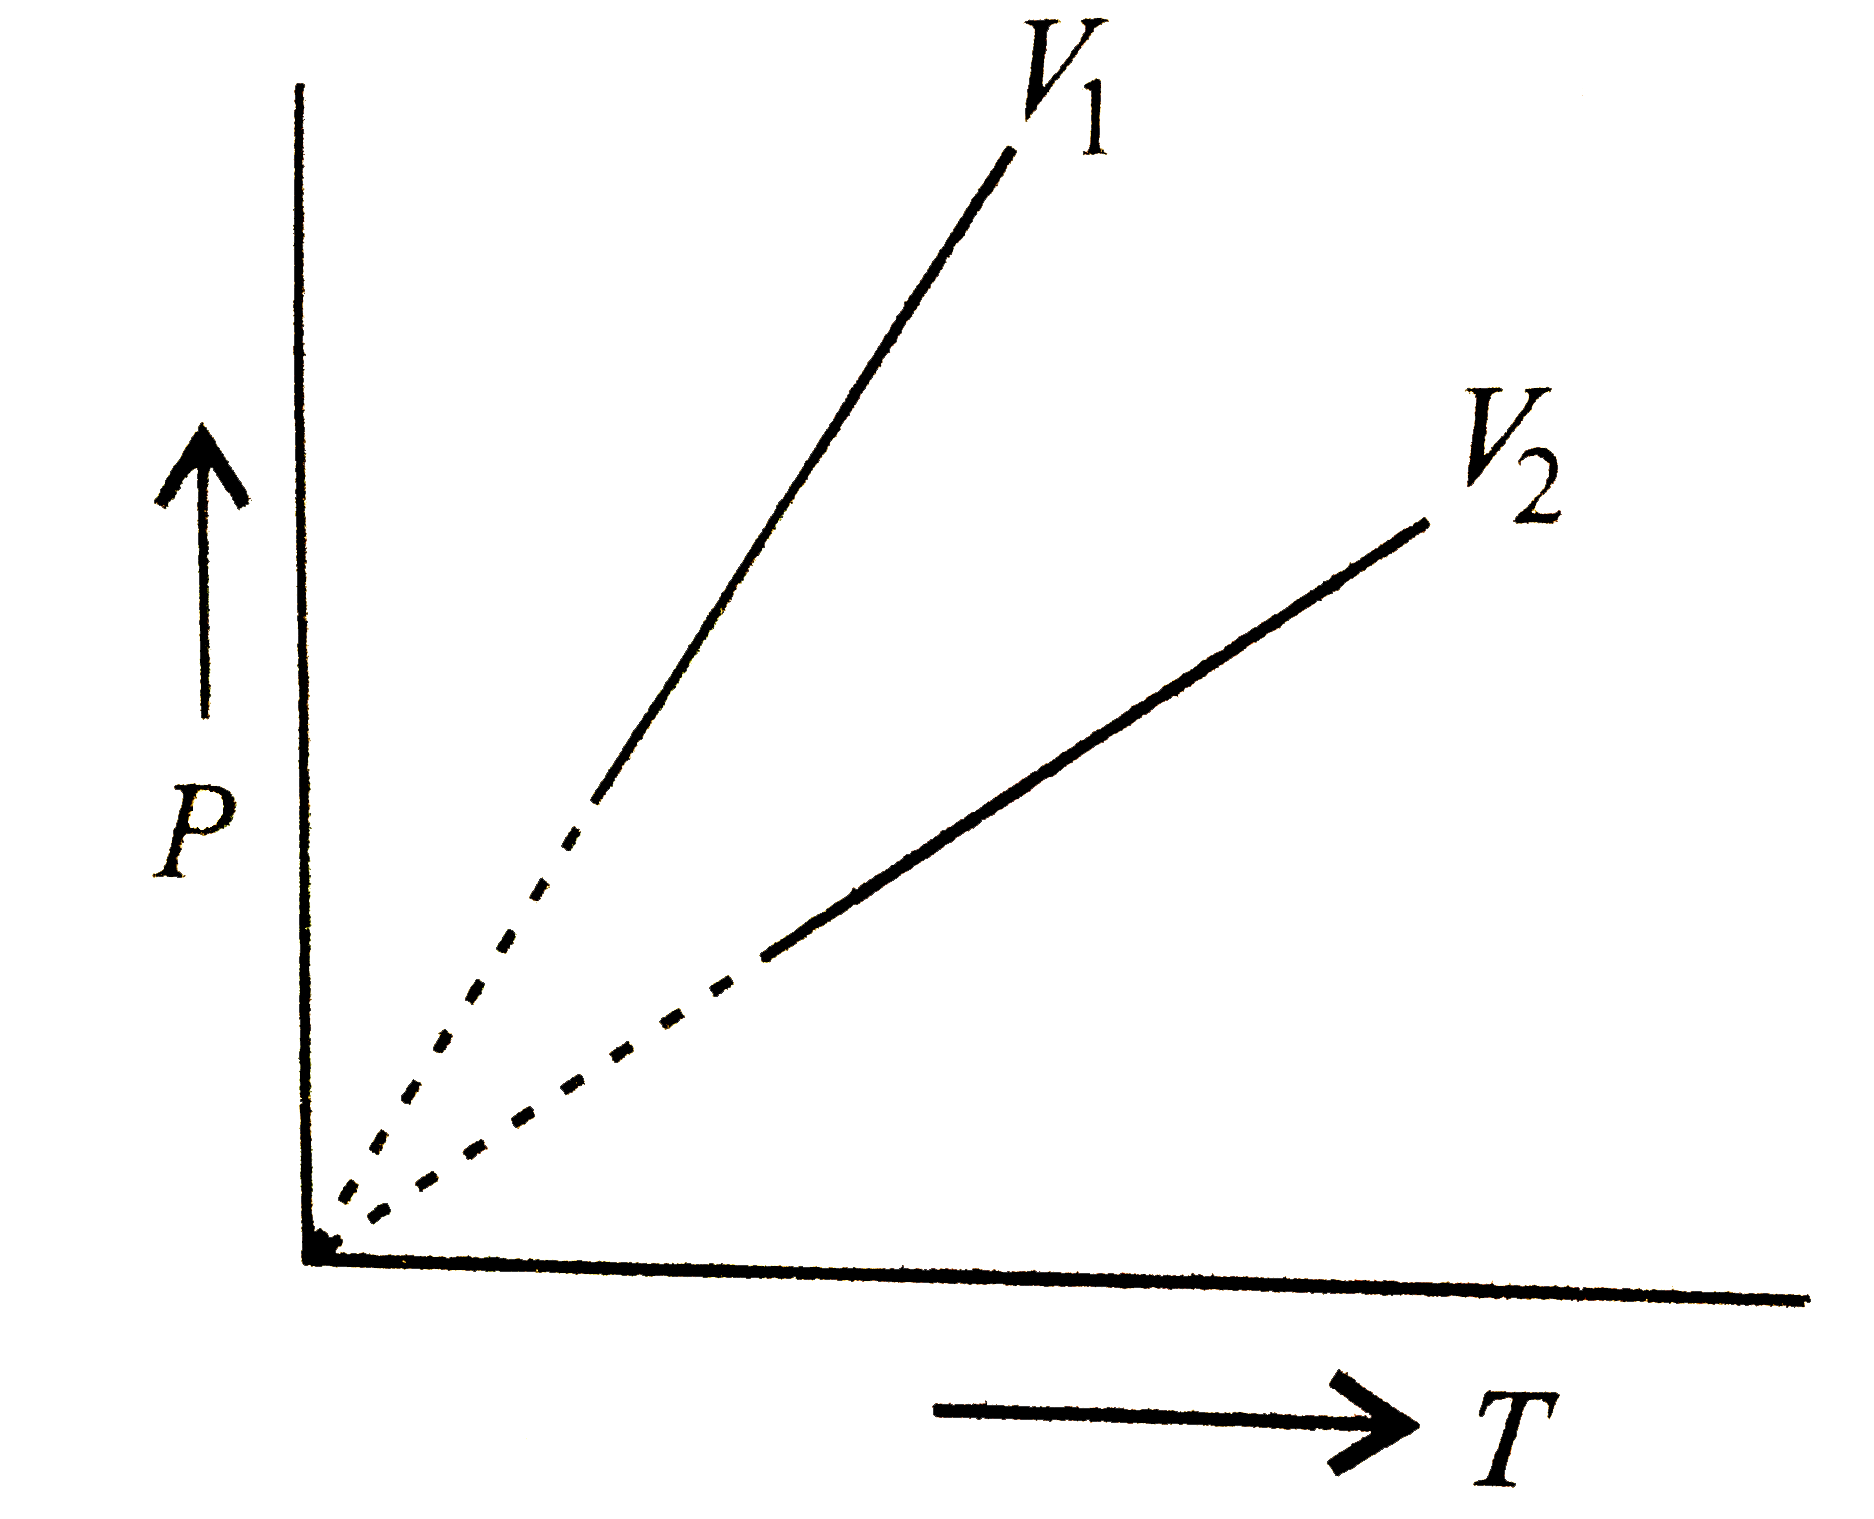
02:45View SolutionA plot of P vs T for a given mass of gas at constant volume is a straight line . P vs T at constant volumes V1 and V2 for an ideal gas are shown below :
Which of the following is correct ?
 01:29View Solution
What will the nature of PV vs P graph be for a real gas at Boyle temperature?
04:01View Solutionfor a given mass of an ideal gas at constant temperature draw and explain the graphs (i) PV^(2) vs V (ii) P^(2)V vs V.
00:59View SolutionpV-p graph of an ideal gas in
02:12View SolutionThe graph of P vs T is a straight line for a given mass of a gas at a fixed volume. Fixed volume for an ideal gas V_(1) "व" V_(2) But P vs T is shown Which of the following is correct ?
02:36View Solution

