Draw the graph of
Video Solution
Text Solution
We have
Clearly, the domain of is R.
Also the period of is R.
Let us first draw the graph of for
or
or
, for and , for
Now
or
or
Now we can draw the graph of for
For , we reflect the graph of for in the x-axis as
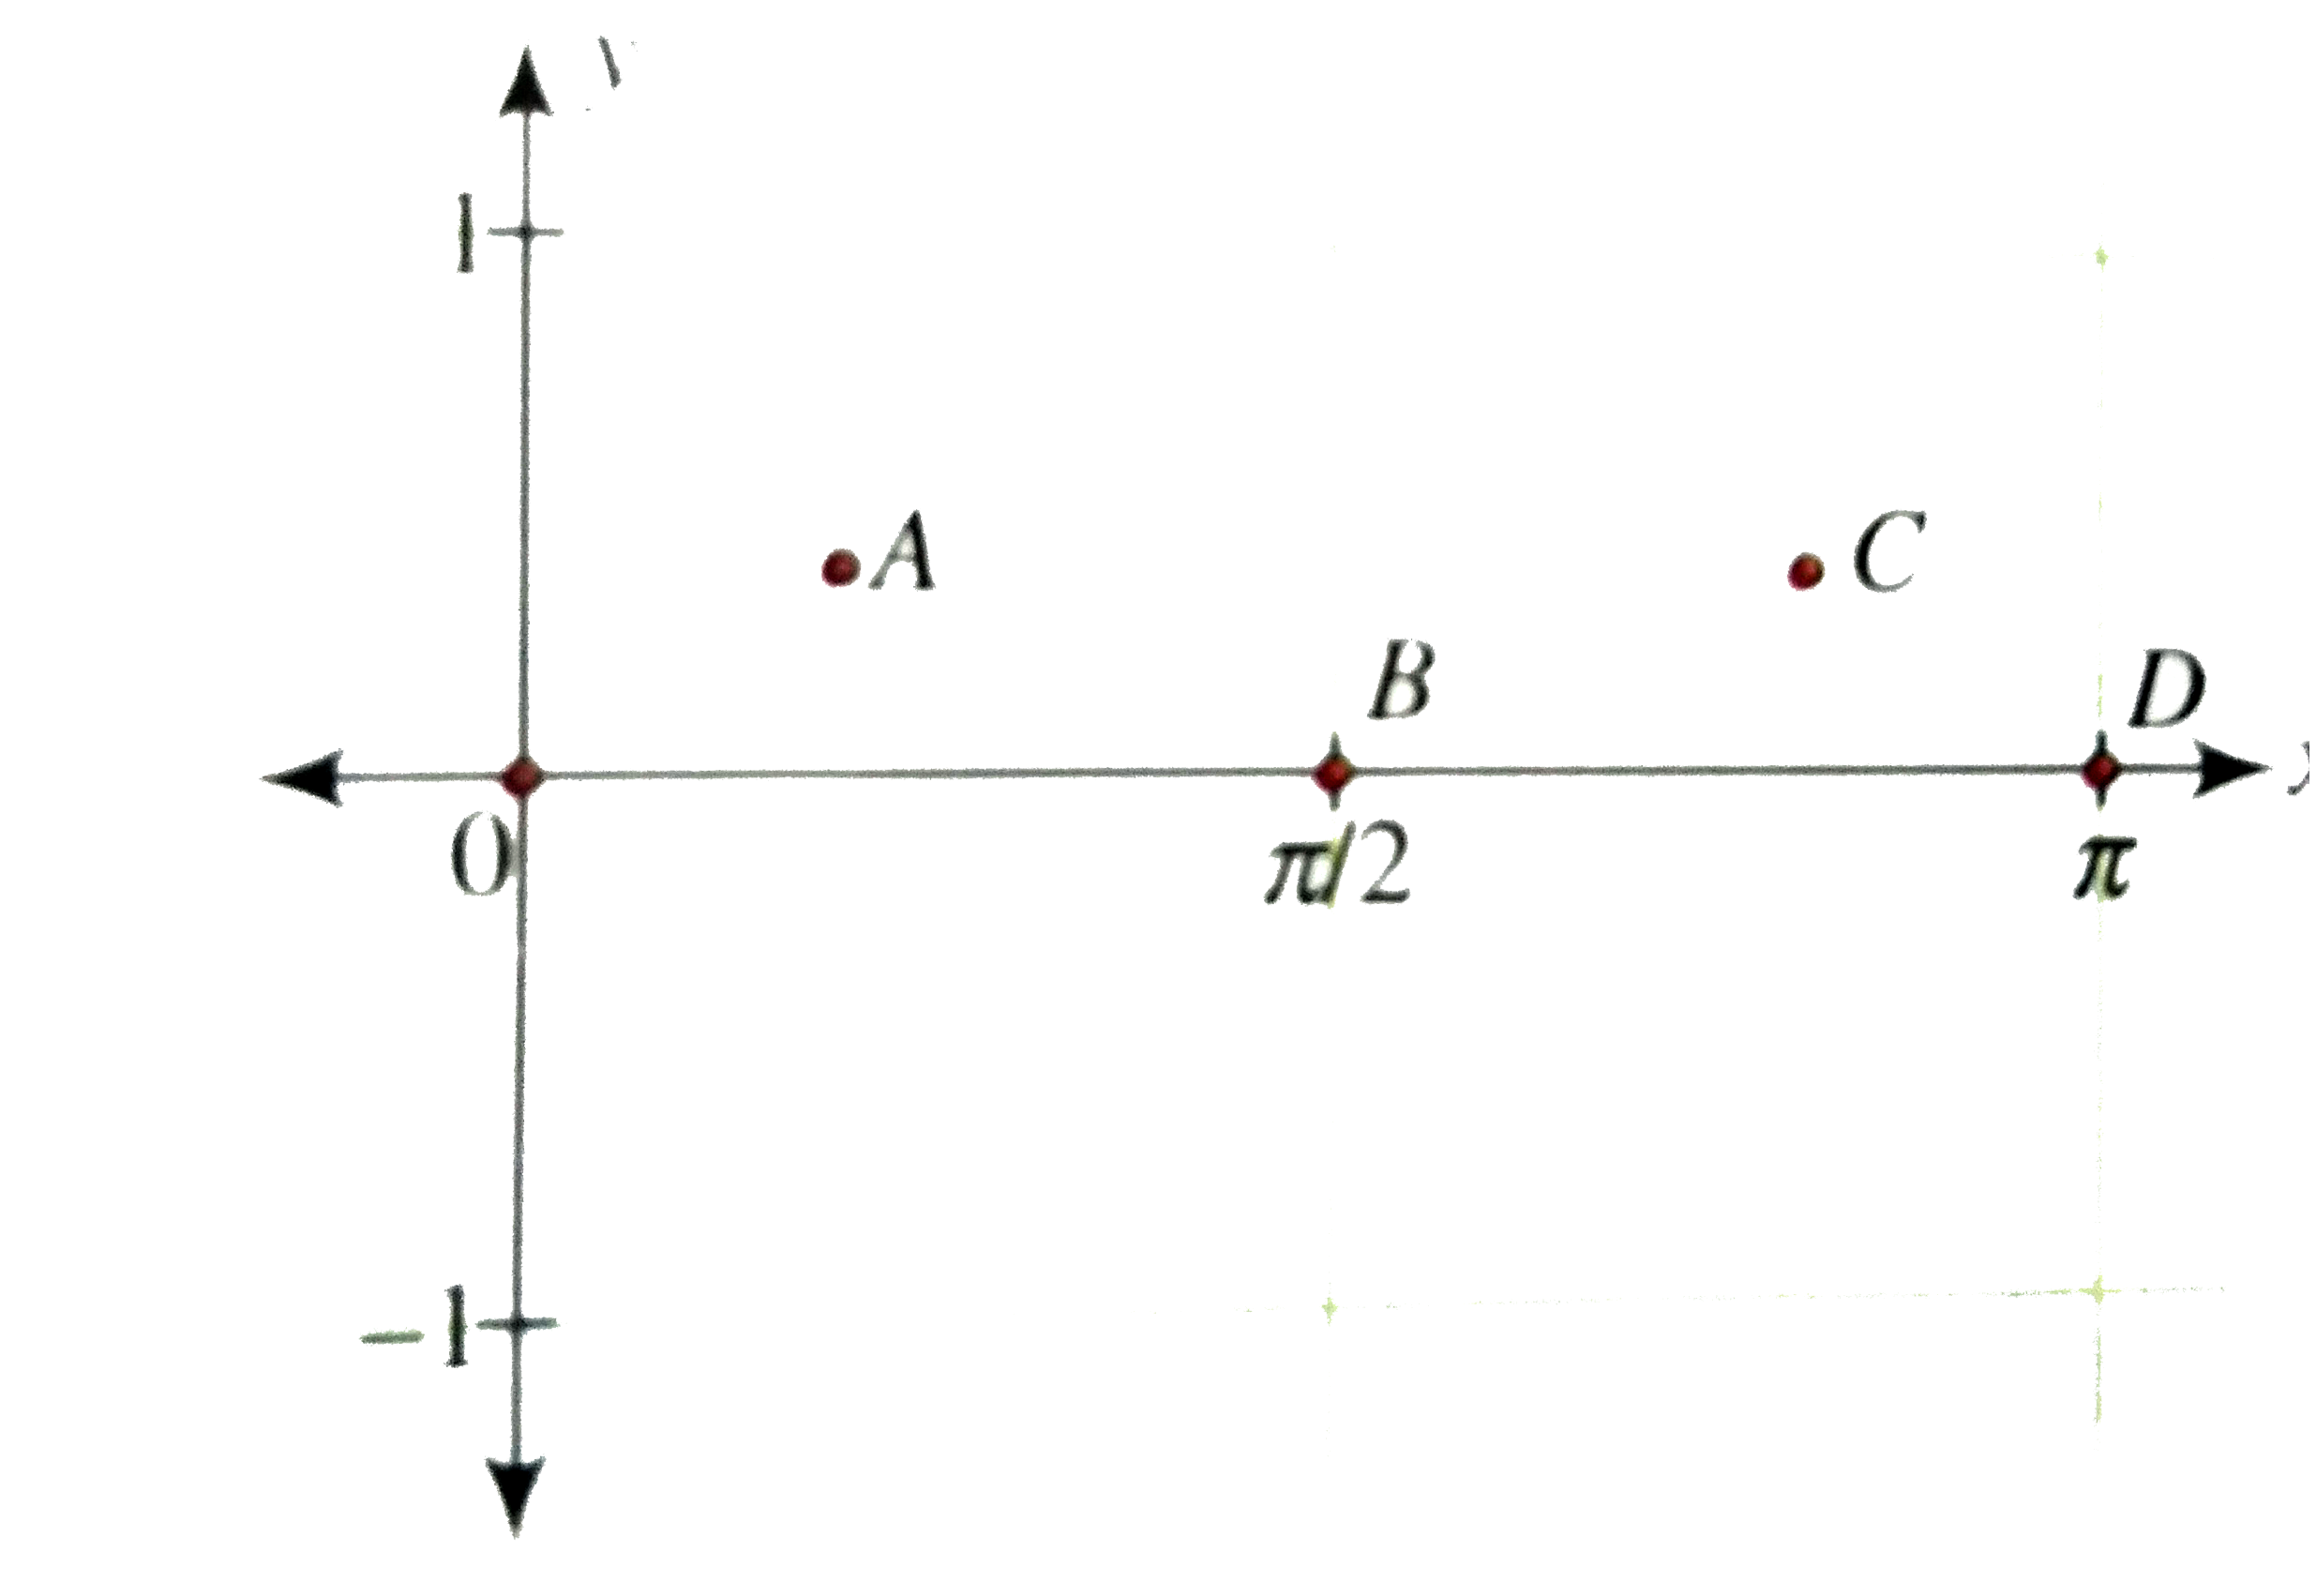
From the above discussion, we have, following important points on graph paper.

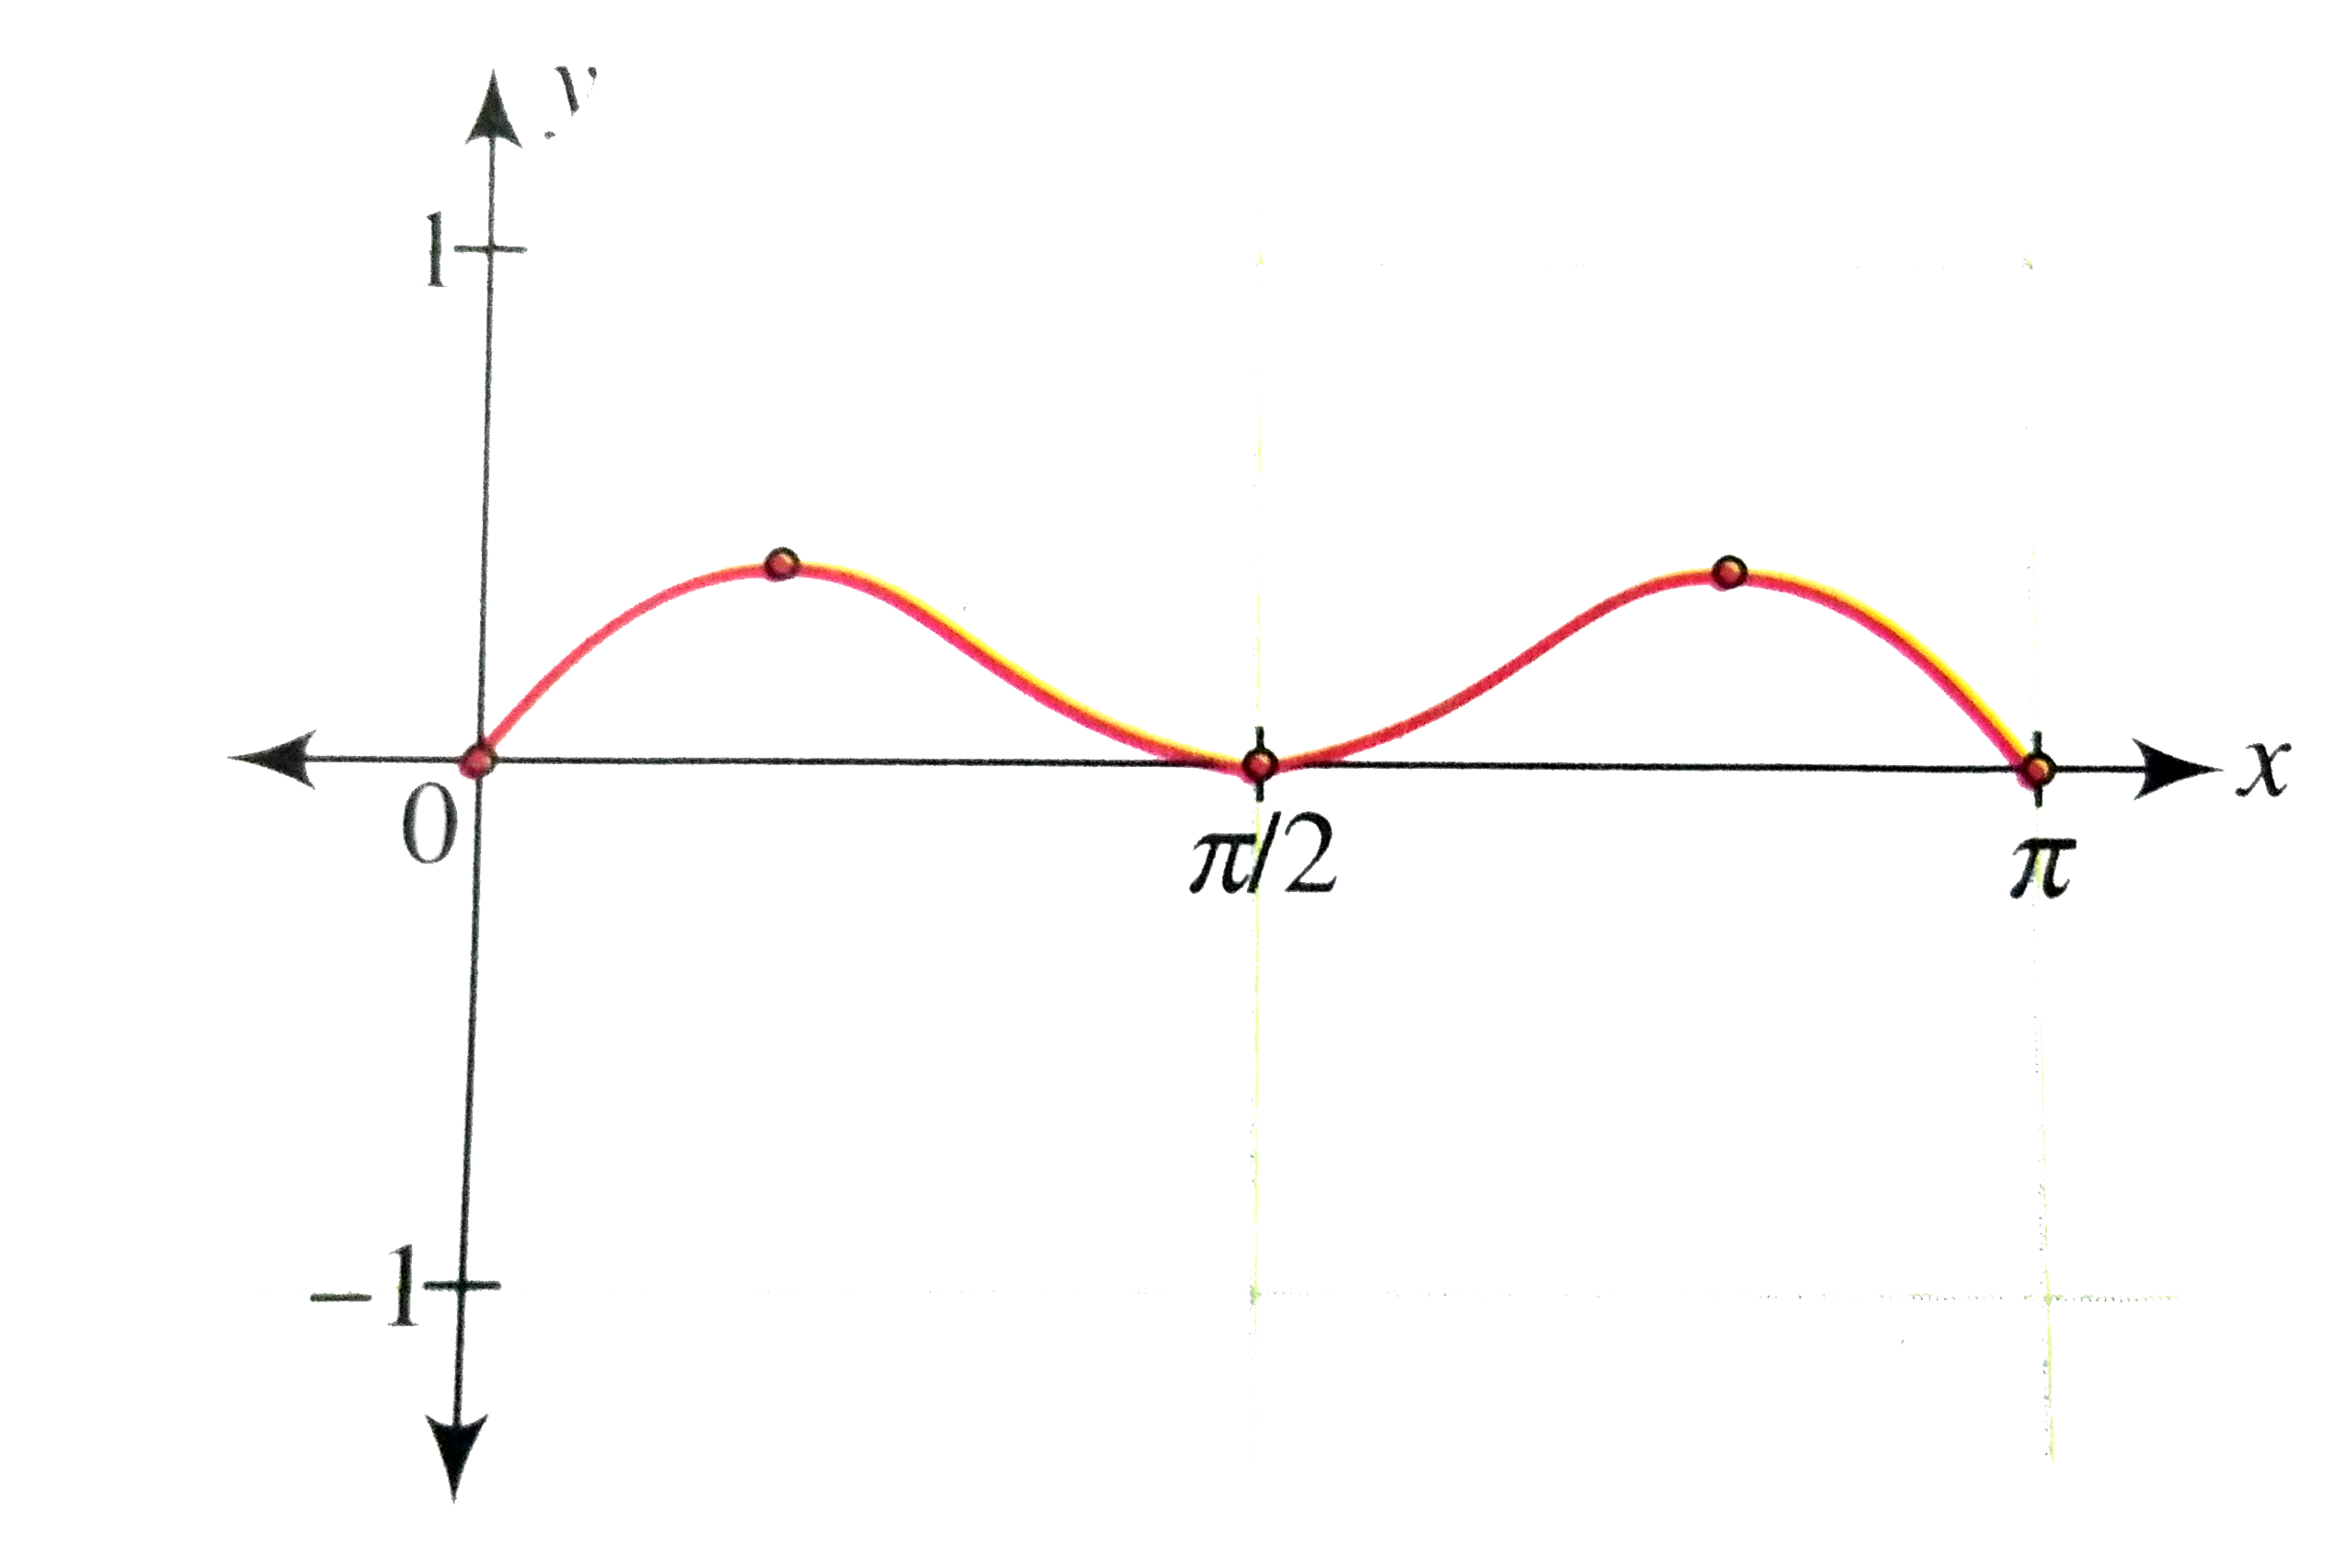
increases from O to A, decreases from A to B, increases from B to C, decreases from C to D.
Hence the graph of for is as shown in the following figure.

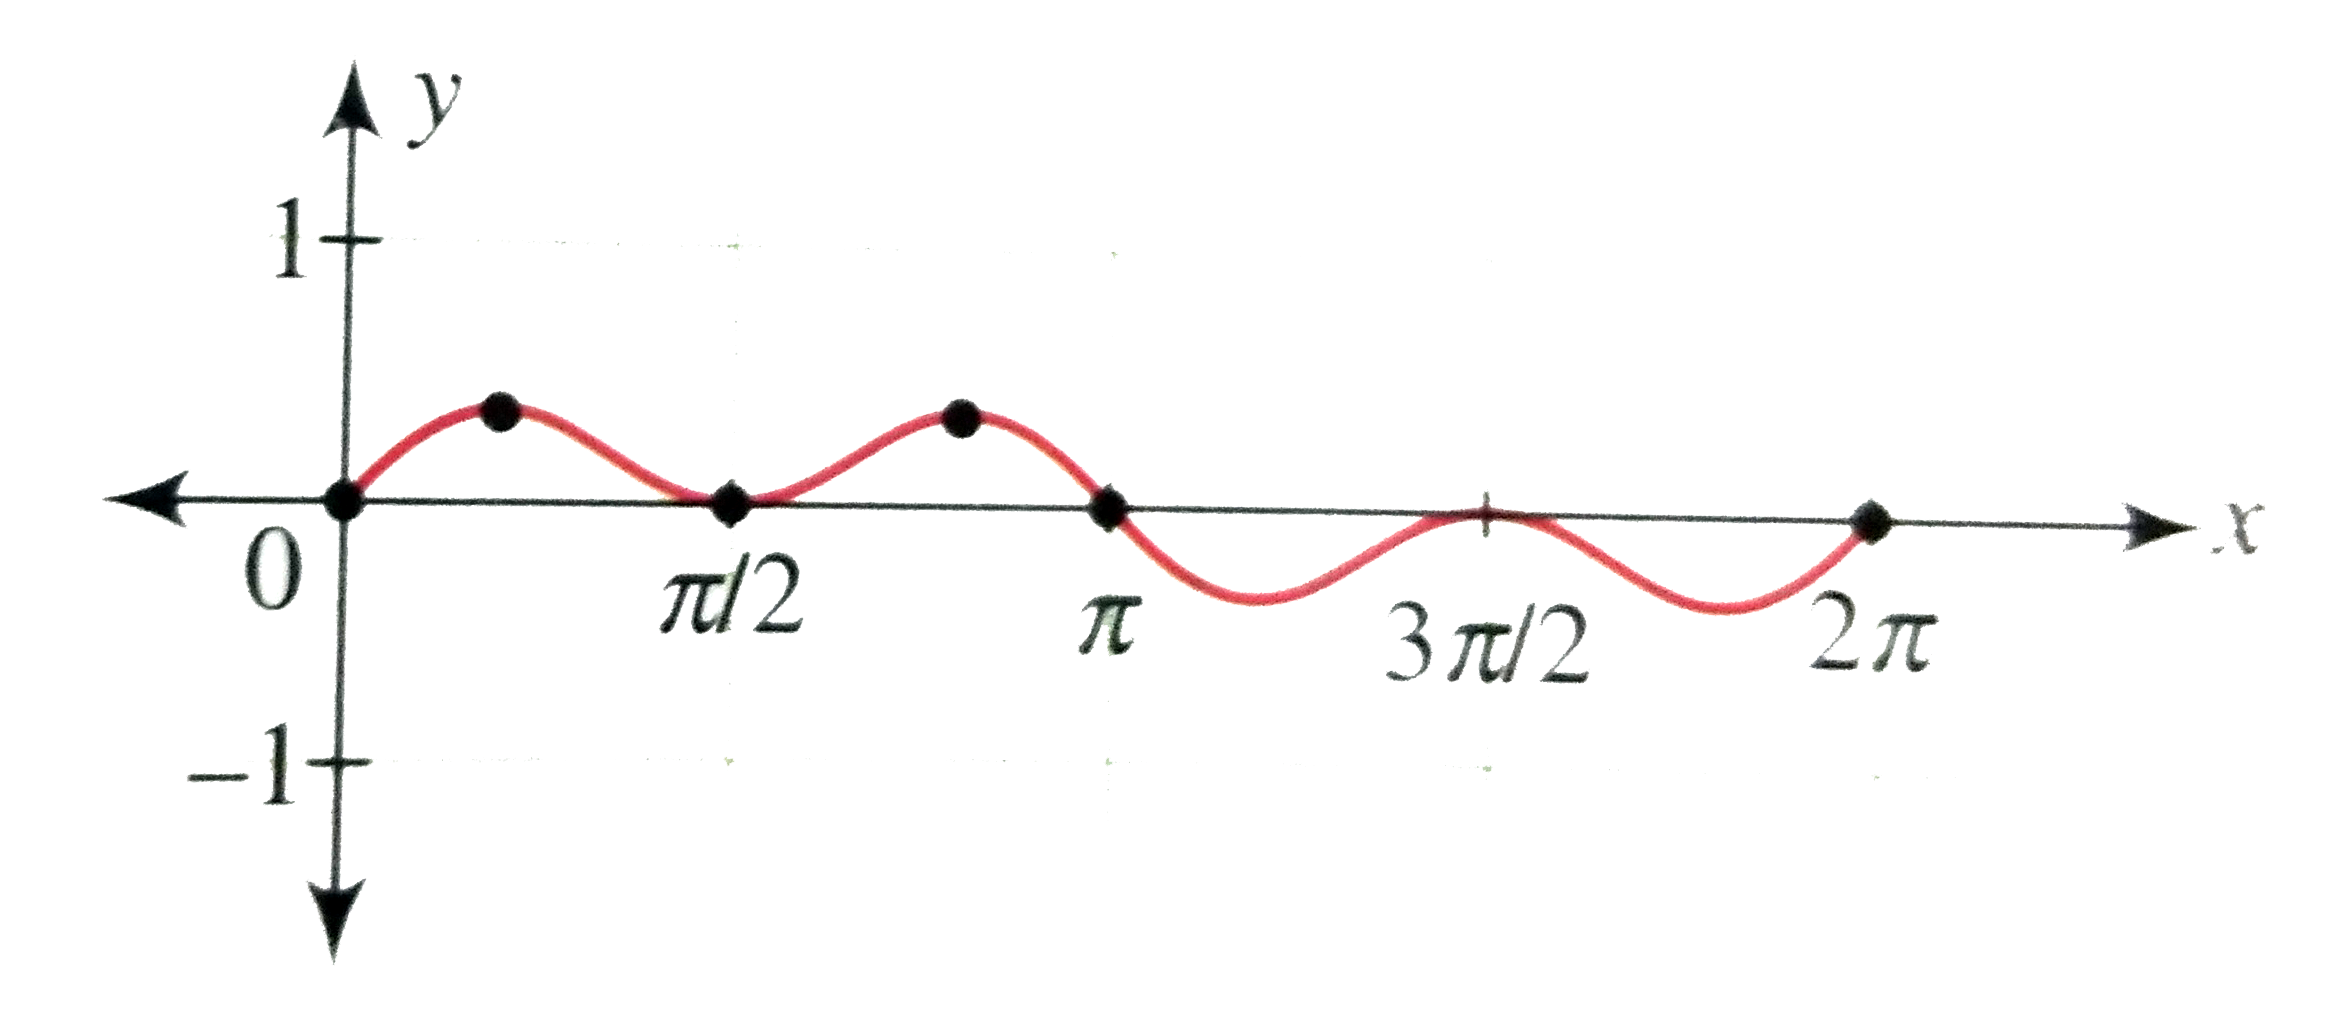
For , the graph of lies below the x-axis.
Hence, the graph of for is as shown in the following figure.

Since the period of is , the graph for R is as follows:

|
Topper's Solved these Questions
Similar Questions
Draw the graph of y=x−sinx
View SolutionDraw the graph of y=2x.
View SolutionDraw the graph of y=|x|
View SolutionDraw the graph of y=3sin2x
View SolutionDraw th graph of y=−2x
View SolutionDraw the graph of y=sin|x|.
View SolutionDraw the graph of y=sin2x−cosx
View SolutionDraw the graph of y=|x|+2
View SolutionDraw the graph of y=cos2x.
View SolutionDraw the graph of y=x+1x
View Solution
