Draw and discuss the graph of f(x)=x2/3−x4/3
To draw and discuss the graph of the function f(x)=x23−x43, we will follow these steps:
Step 1: Identify the function
We start with the function:
f(x)=x23−x43
Step 2: Find the critical points
To find the critical points, we need to differentiate the function and set the derivative equal to zero.
1. Differentiate f(x):
f′(x)=23x−13−43x13
2. Set the derivative equal to zero:
23x−13−43x13=0
3. Solve for x:
23x−13=43x13
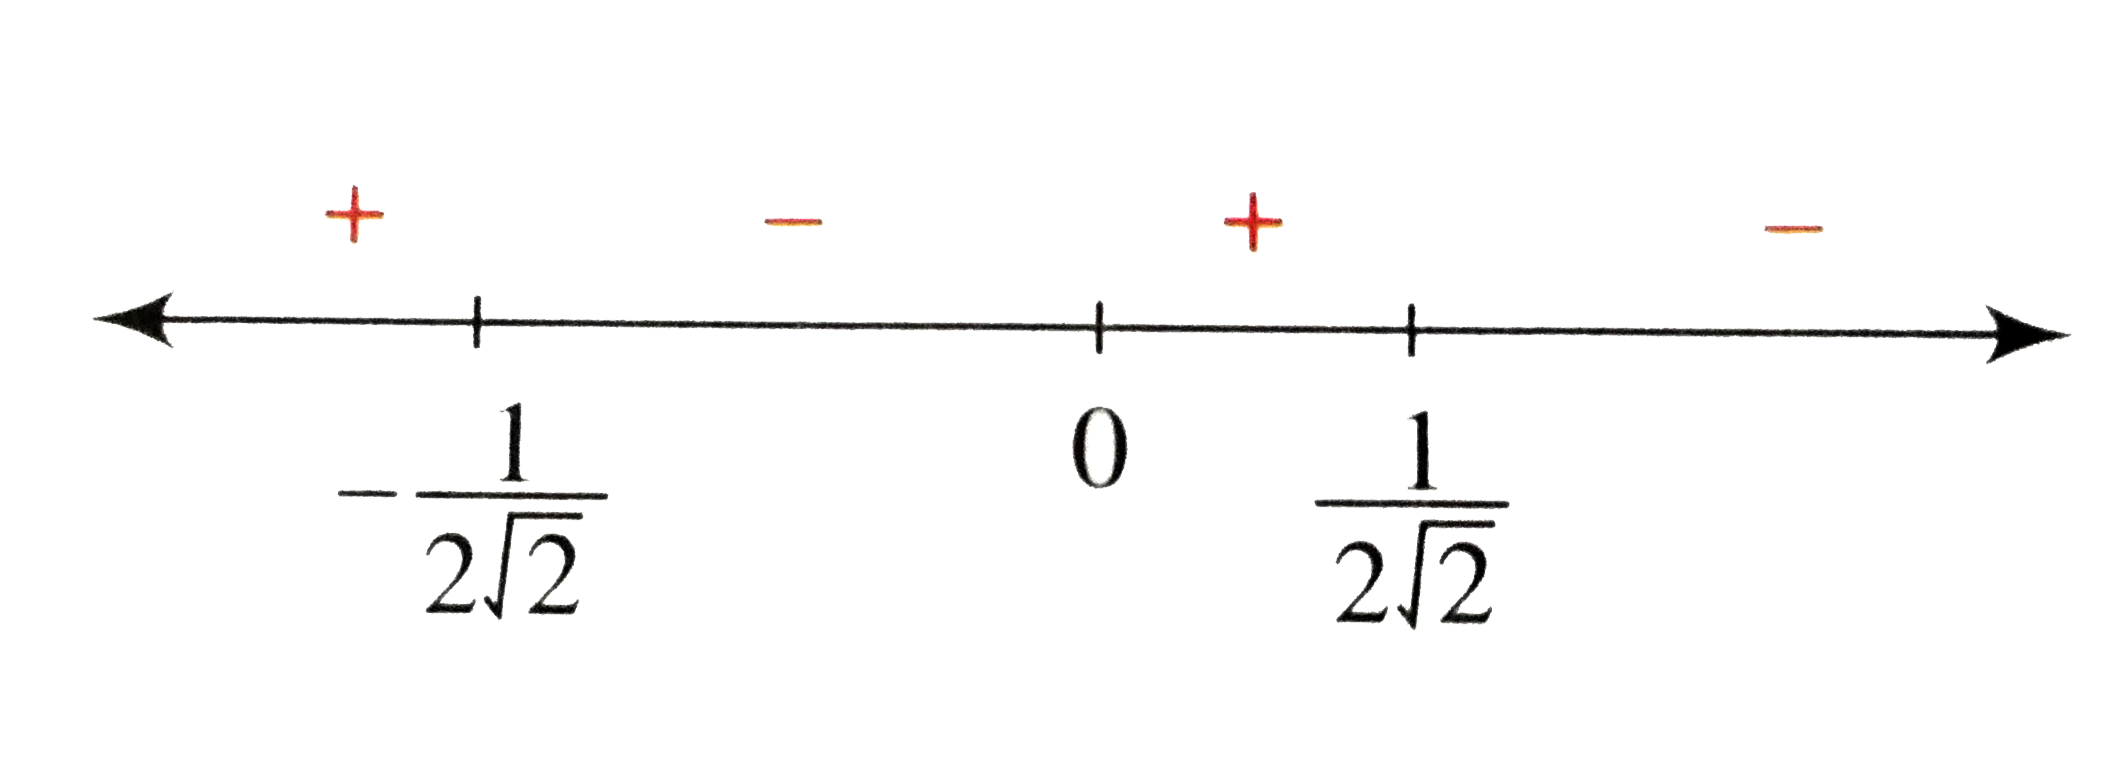
2=4x23⟹x23=12⟹x=±(12)32=±√22
4. Also, check for x=0 since the derivative is undefined there.
Step 3: Evaluate the function at critical points
Now evaluate f(x) at the critical points:
- At x=0:
f(0)=023−043=0
- At x=√22:
f(√22)=(√22)23−(√22)43=213223−223243=1213−1223
- At x=−√22:
f(−√22)=(−√22)23−(−√22)43=213223−1223=1213−1223
Step 4: Analyze the behavior of the function
- As x→∞, f(x)→−∞ because the term −x43 dominates.
- As x→−∞, f(x)→−∞ for the same reason.
Step 5: Determine symmetry
The function is even because:
f(−x)=(−x)23−(−x)43=x23−x43=f(x)
This means the graph is symmetric about the y-axis.
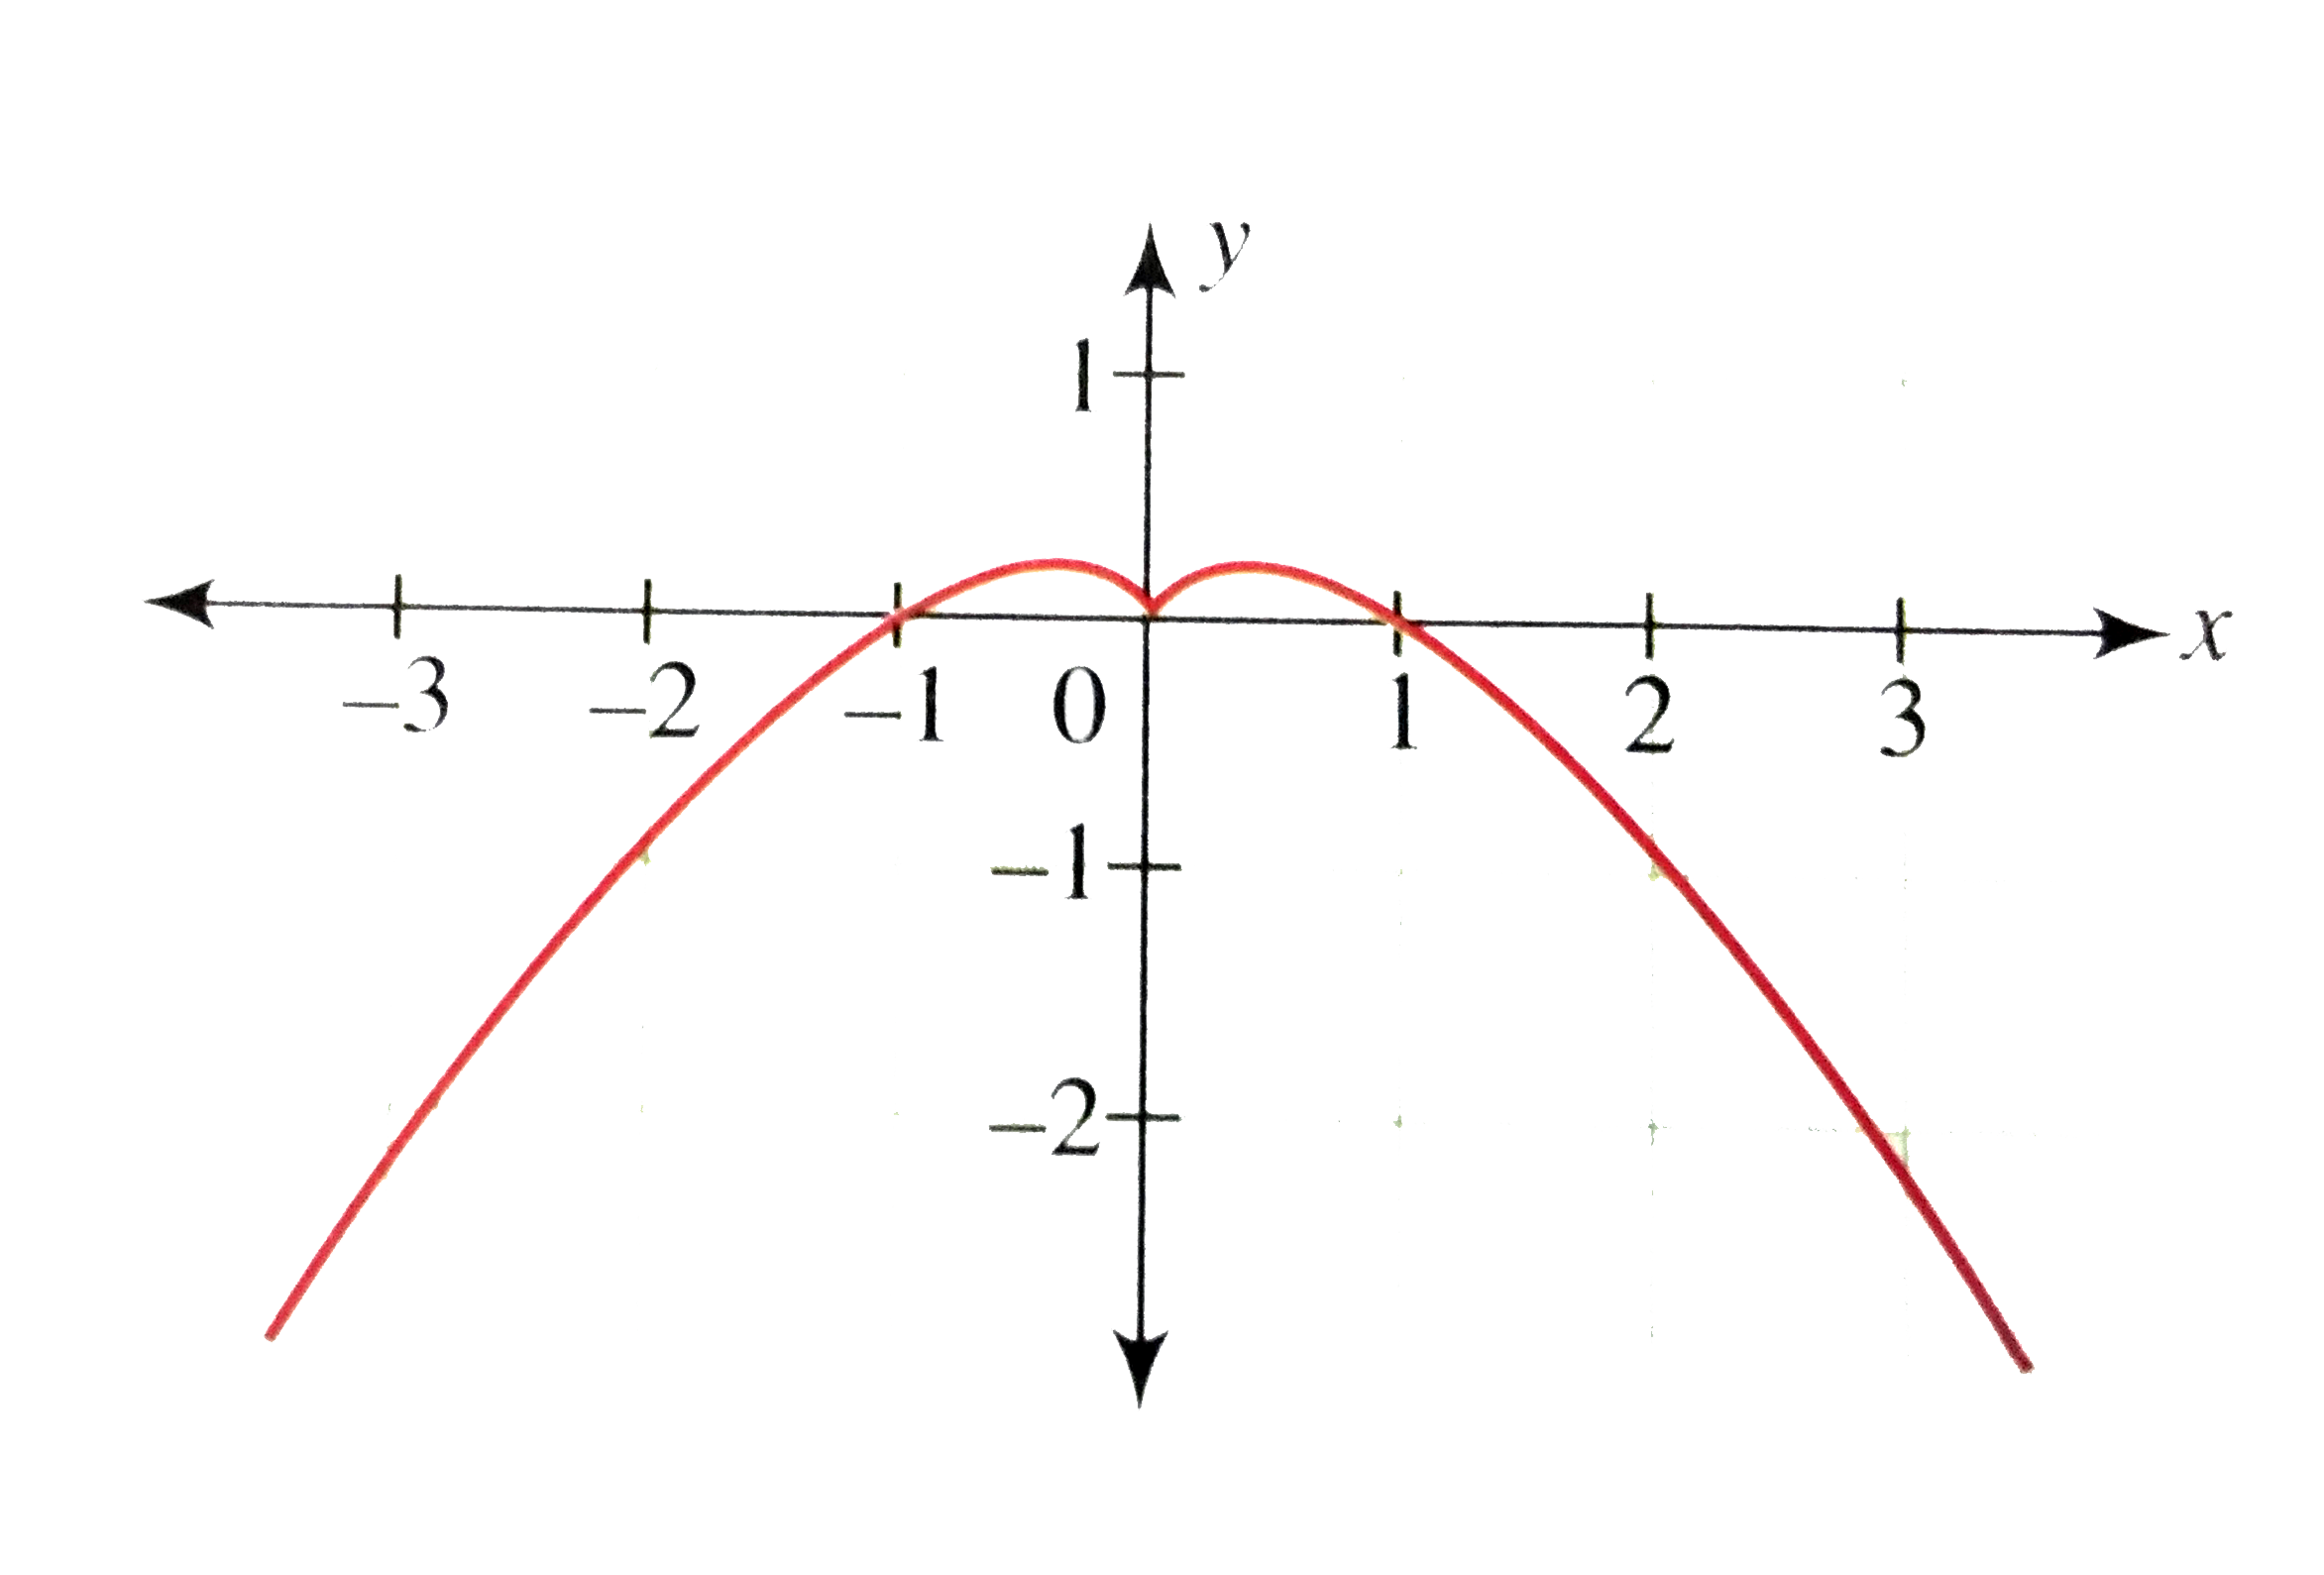
Step 6: Sketch the graph
Using the information gathered:
- Plot the critical points: (0,0), (√22,1213−1223), and (−√22,1213−1223).
- The graph will approach −∞ as x approaches ±∞.
- The graph will be symmetric about the y-axis.
Final Graph
The graph will look like a curve that starts from −∞, rises to a maximum at x=±√22, and then falls back to −∞.
We start with the function:
f(x)=x23−x43
To find the critical points, we need to differentiate the function and set the derivative equal to zero.
f′(x)=23x−13−43x13
23x−13−43x13=0
23x−13=43x13
2=4x23⟹x23=12⟹x=±(12)32=±√22
Now evaluate f(x) at the critical points:
- At x=0:
f(0)=023−043=0
f(√22)=(√22)23−(√22)43=213223−223243=1213−1223
f(−√22)=(−√22)23−(−√22)43=213223−1223=1213−1223
- As x→∞, f(x)→−∞ because the term −x43 dominates.
- As x→−∞, f(x)→−∞ for the same reason.
The function is even because:
f(−x)=(−x)23−(−x)43=x23−x43=f(x)
This means the graph is symmetric about the y-axis.
Using the information gathered:
- Plot the critical points: (0,0), (√22,1213−1223), and (−√22,1213−1223).
- The graph will approach −∞ as x approaches ±∞.
- The graph will be symmetric about the y-axis.
The graph will look like a curve that starts from −∞, rises to a maximum at x=±√22, and then falls back to −∞.
Topper's Solved these Questions
Similar Questions
Draw and discuss the graph of f(x)=x+√x−1
View SolutionDraw the graph of f(x)=12x43−6x13
View SolutionDraw and discuss the graph of the function f(x)=e1/x
View SolutionDraw the graph of f(x)=sgn(x3−x).
View SolutionDraw the graph of f(x)=x|x|.
View SolutionDraw the graph of f(x)=x3−xx2−1.
View SolutionDiscuss the extremum of f(x)=2x+3x23
View SolutionDraw the graph of f(x)=esinx.
View SolutionDraw the graph of f(x)=√1−e−x2
View Solution