Explain the reading and interpretation of bar graphs.
Step by step video & image solution for Explain the reading and interpretation of bar graphs. by Maths experts to help you in doubts & scoring excellent marks in Class 6 exams.
Updated on:21/07/2023Topper's Solved these Questions
Similar Questions
Knowledge Check
The given graph shows how much nitrate (NO−3) is exported from the continent towards the ocean by 16 major rivers in the world rivers in the world compared to the density of human populations living along those drainage basins (i.e., along these rivers). What interpretation can be drawn from this graph ?
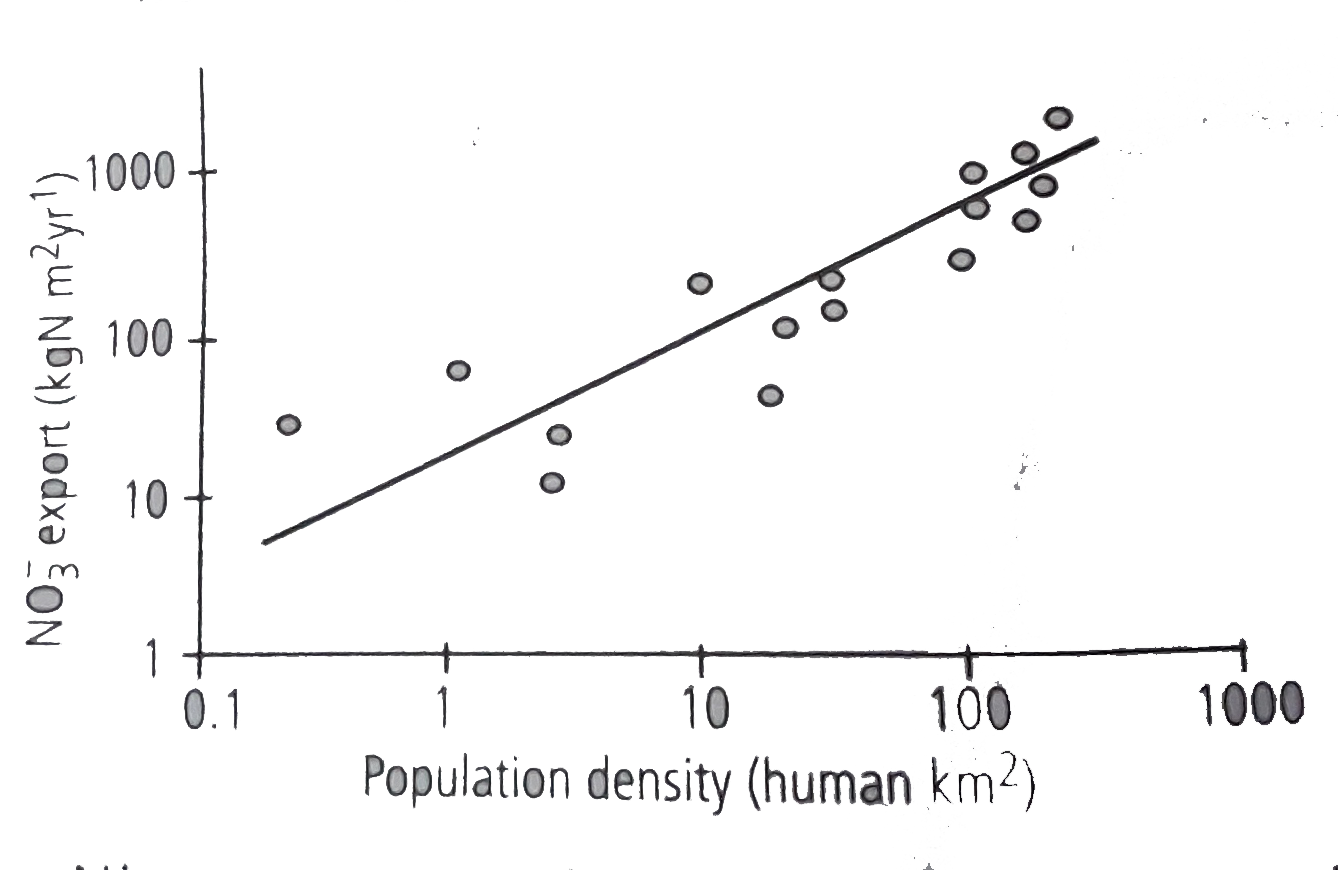 ANitrate exported through rivers from heavily populated cities can cause eutrophication and toxic algal bloom in marine coastal regions.BSmall drainage basins export more NO−3.CDrainage basins with higher populstion densities export lesser NO−3.Dboth (a) and (c )
(a) Hershey and Chase carried their experiment in three steps : infection, blending, centrifugation. Explain each step.
(b) Write the conclusion and interpretation of the result they obtained.
View SolutionWhat is the kinetic interpretation of temperature?
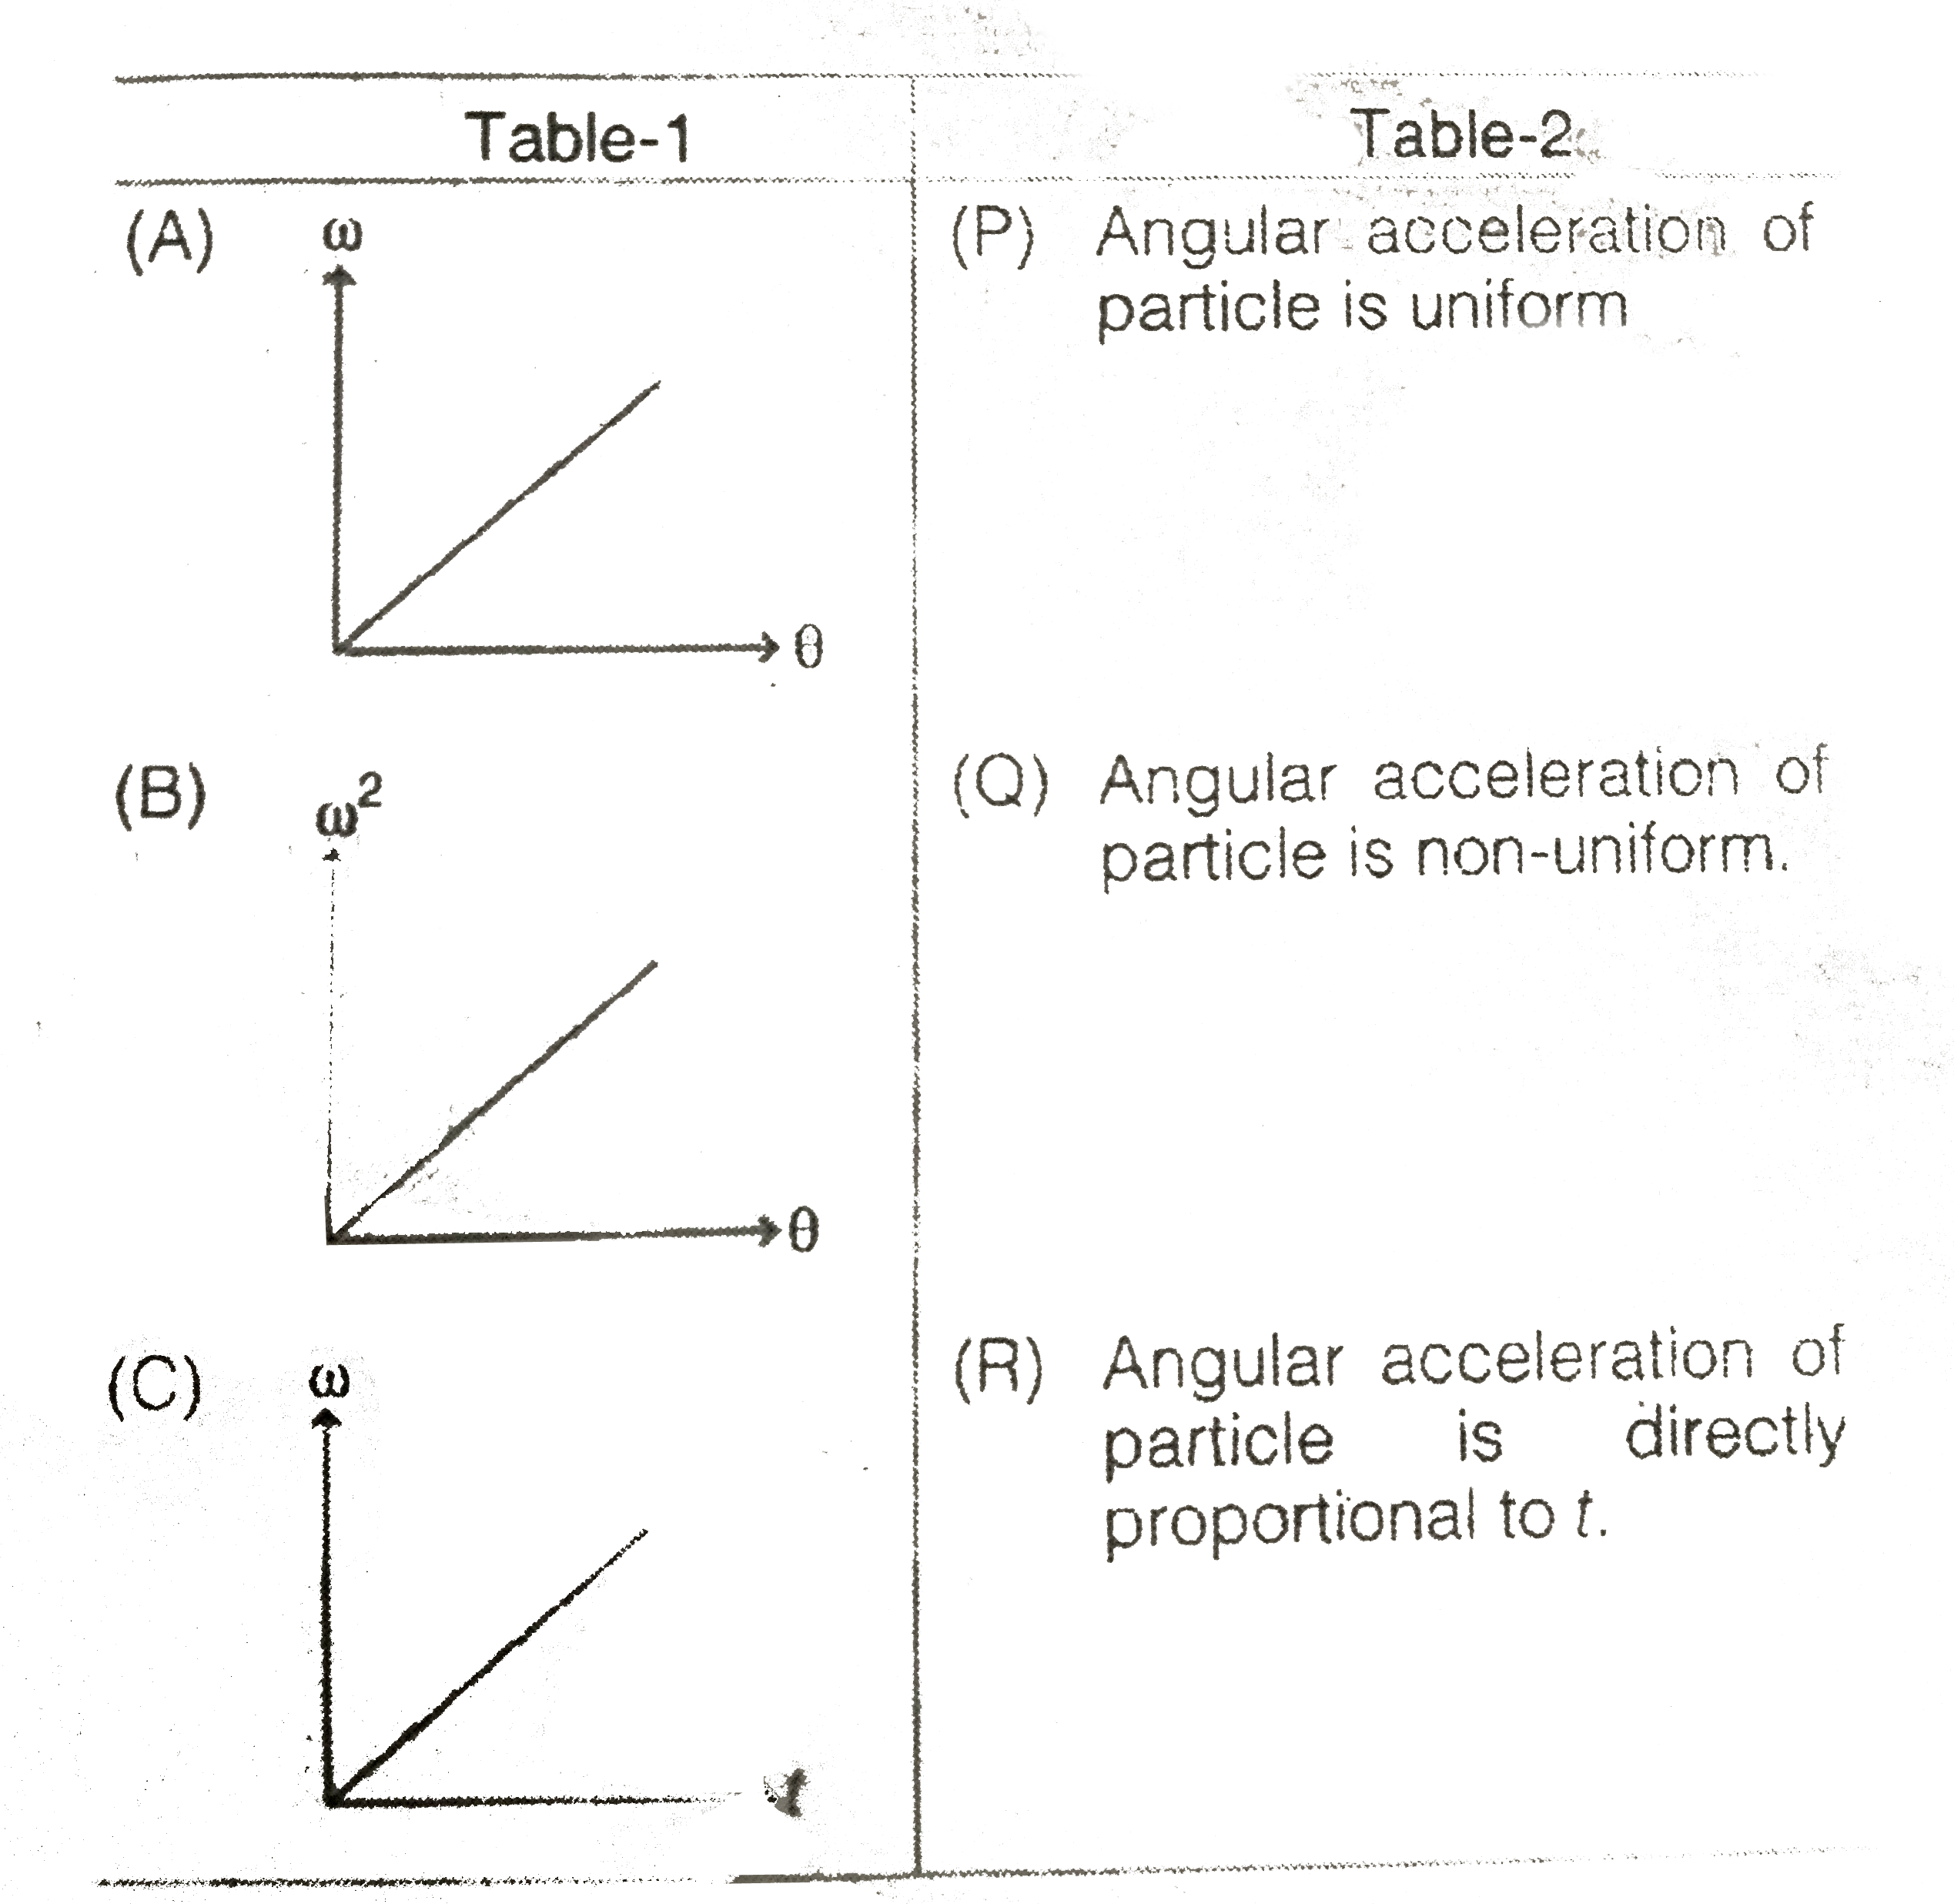
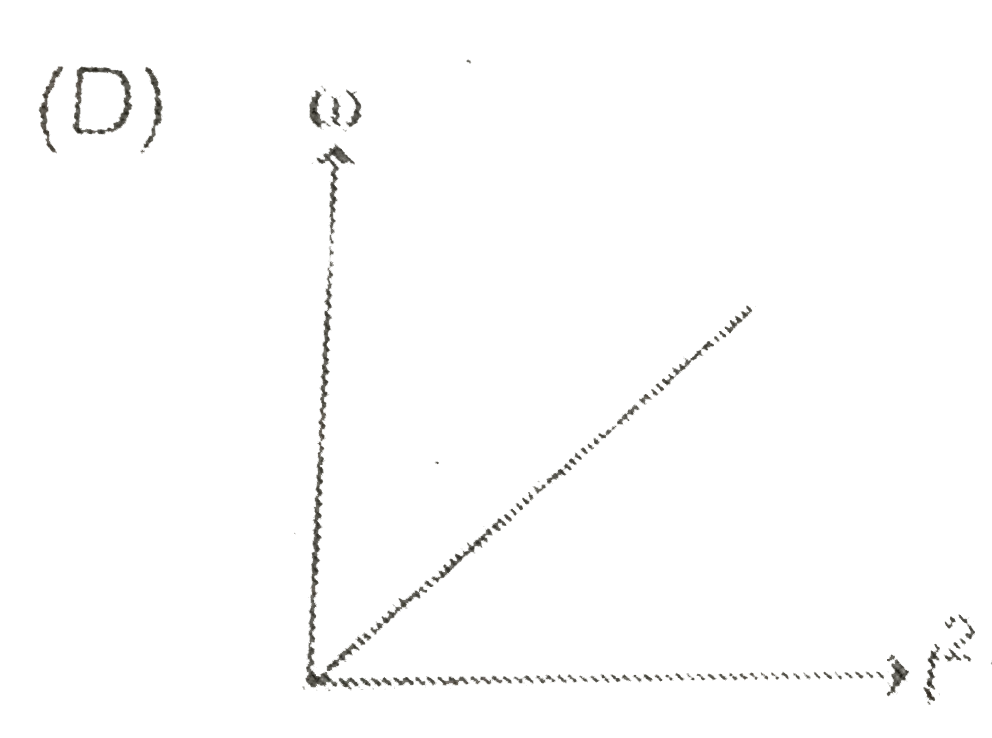
View SolutionEach situation in Table-1 gives graph of a particle moving in circular path. The variables ω,θ and t represent angular speed (at any time t), angular displacement (in time t) and time respectively. Table-2 gives certain resulting interpretation. Match the graphs in Table-1 with statements in Table-2.
 0
0
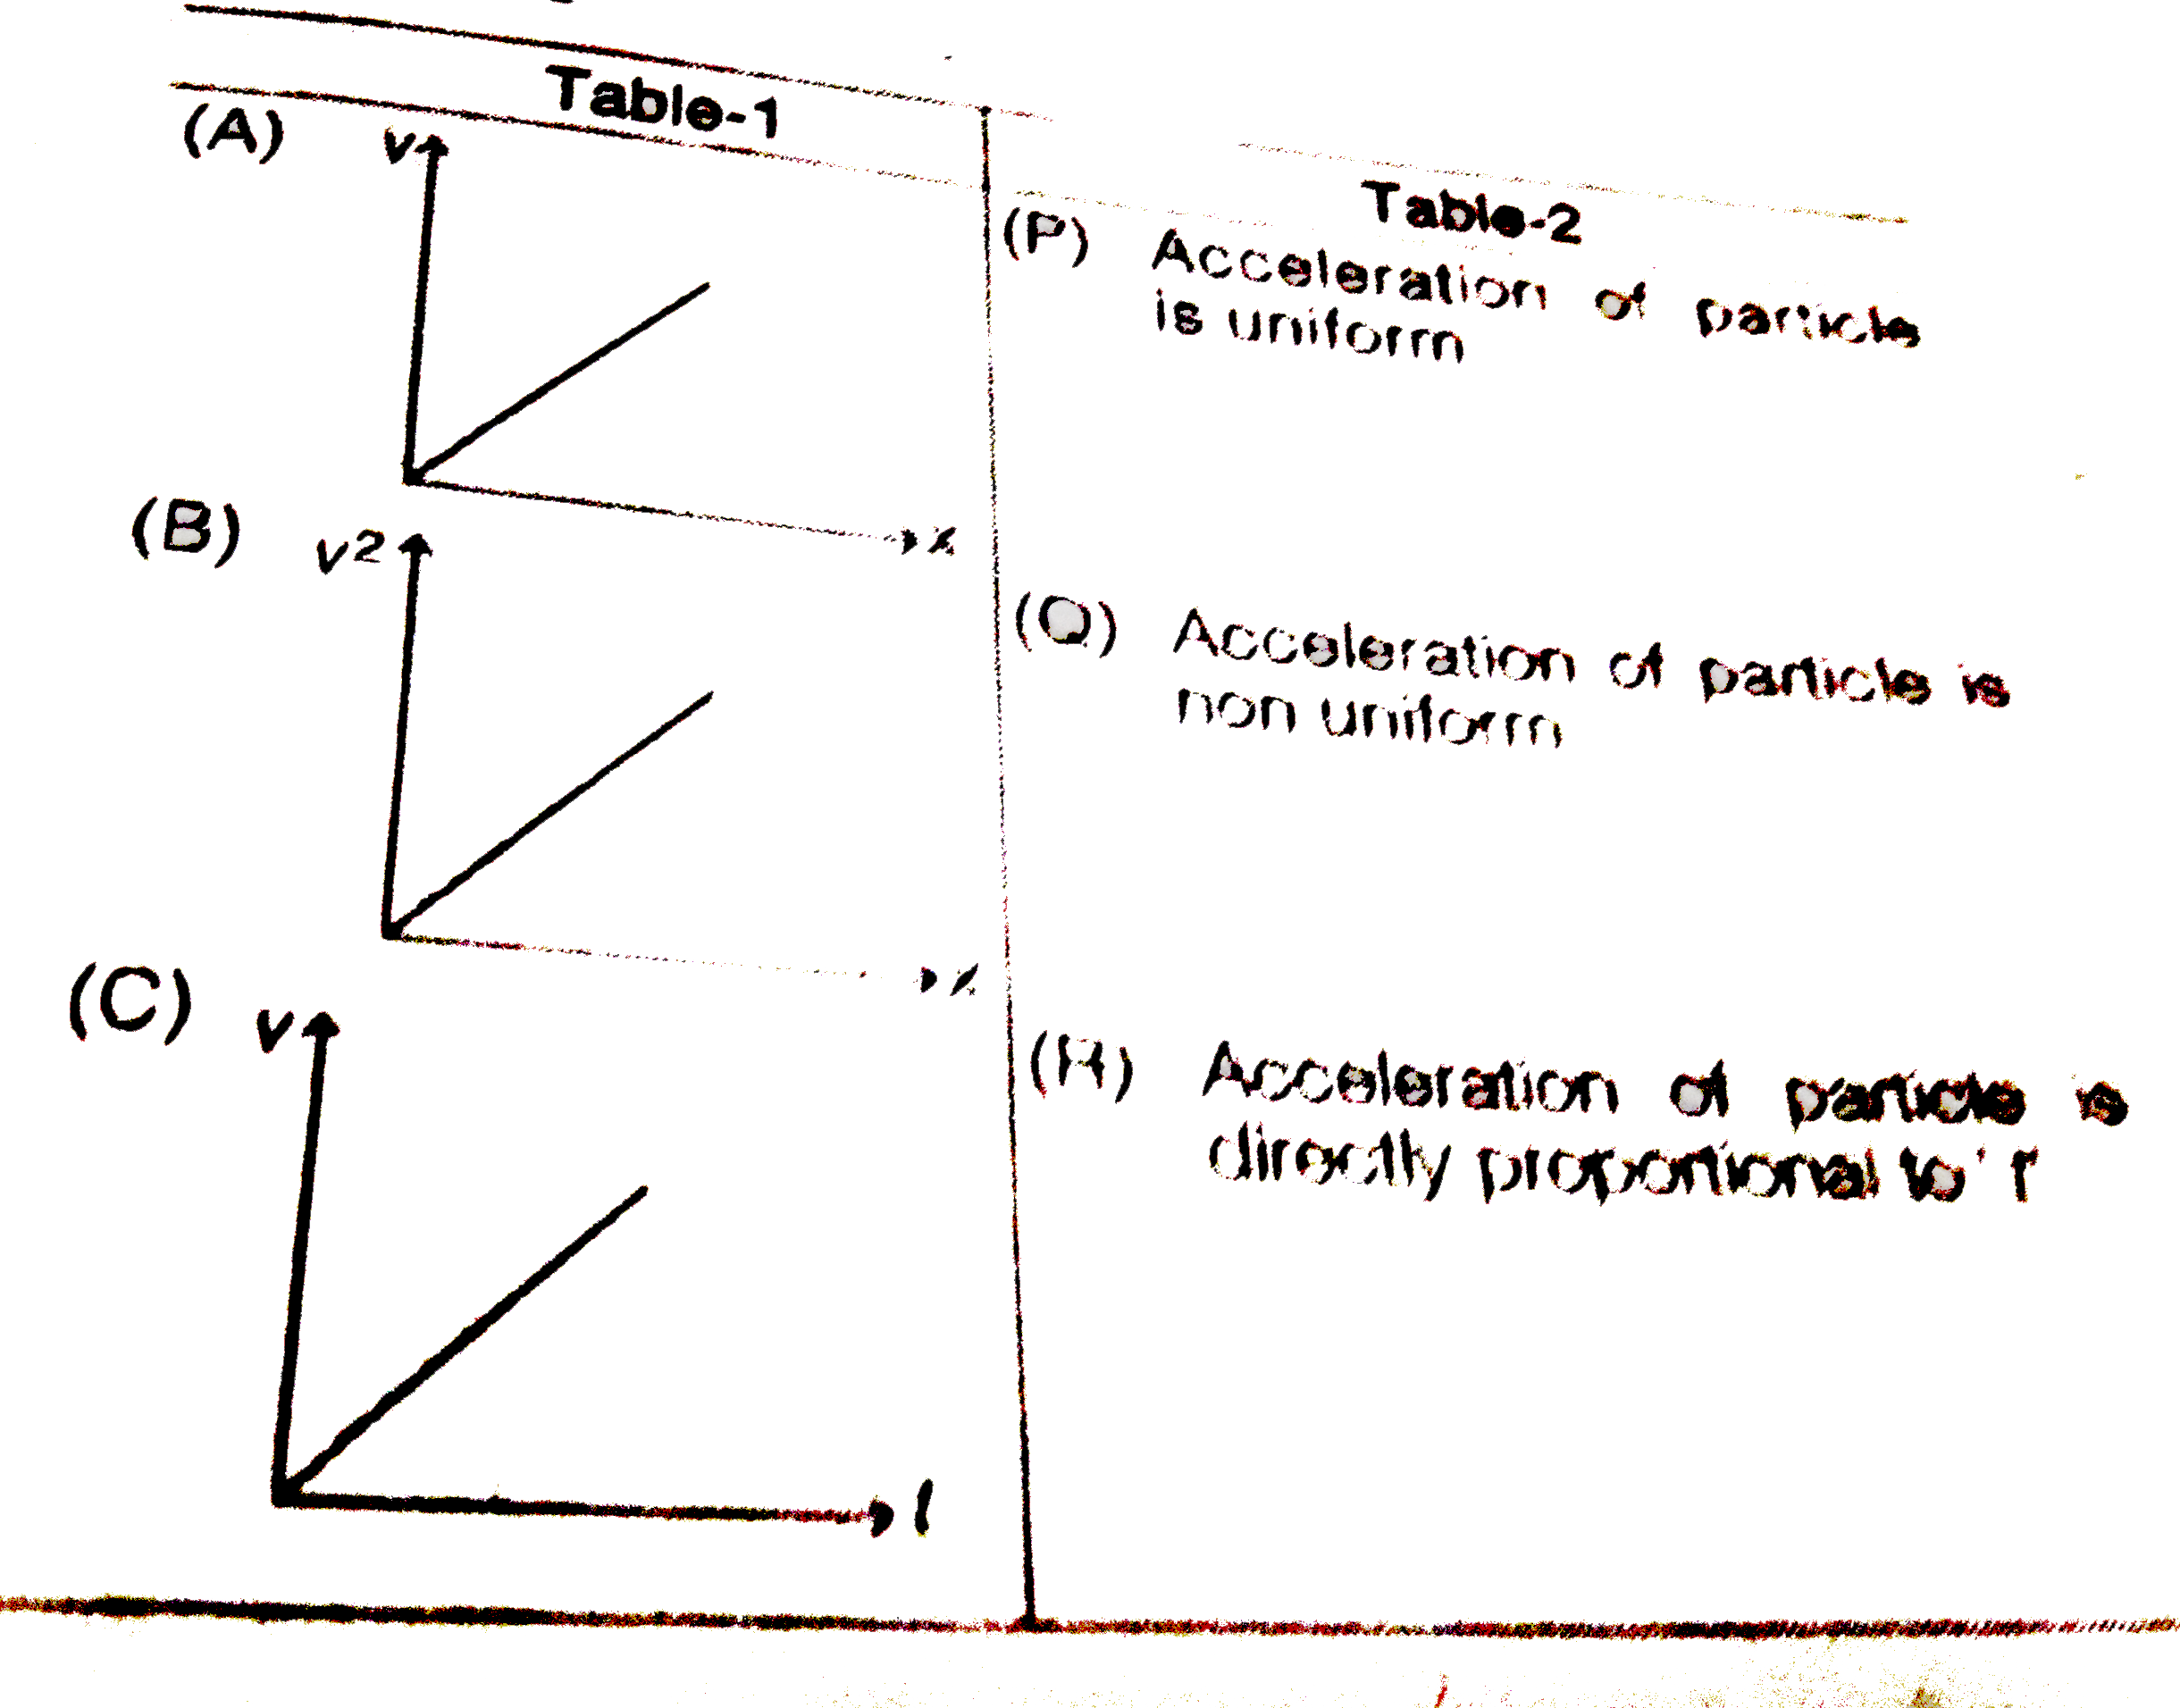
View SolutionTable -1 gives some graph for a particle moves along x-axis in positive x-direction. The variables v,x and t represent speed of particle, x-coordinate of particle and time respectively. Table -2 gives certain resulting interpretation. Match the graph in Table -1 with the statements in Table -2.

View SolutionThe state of a mole of an ideal gas changed from state A at pressure 2P and volume V follows four different processes and finally returns to initial state A reversibly as shown below in the graph. By interpreting the graph, answer the following questions.
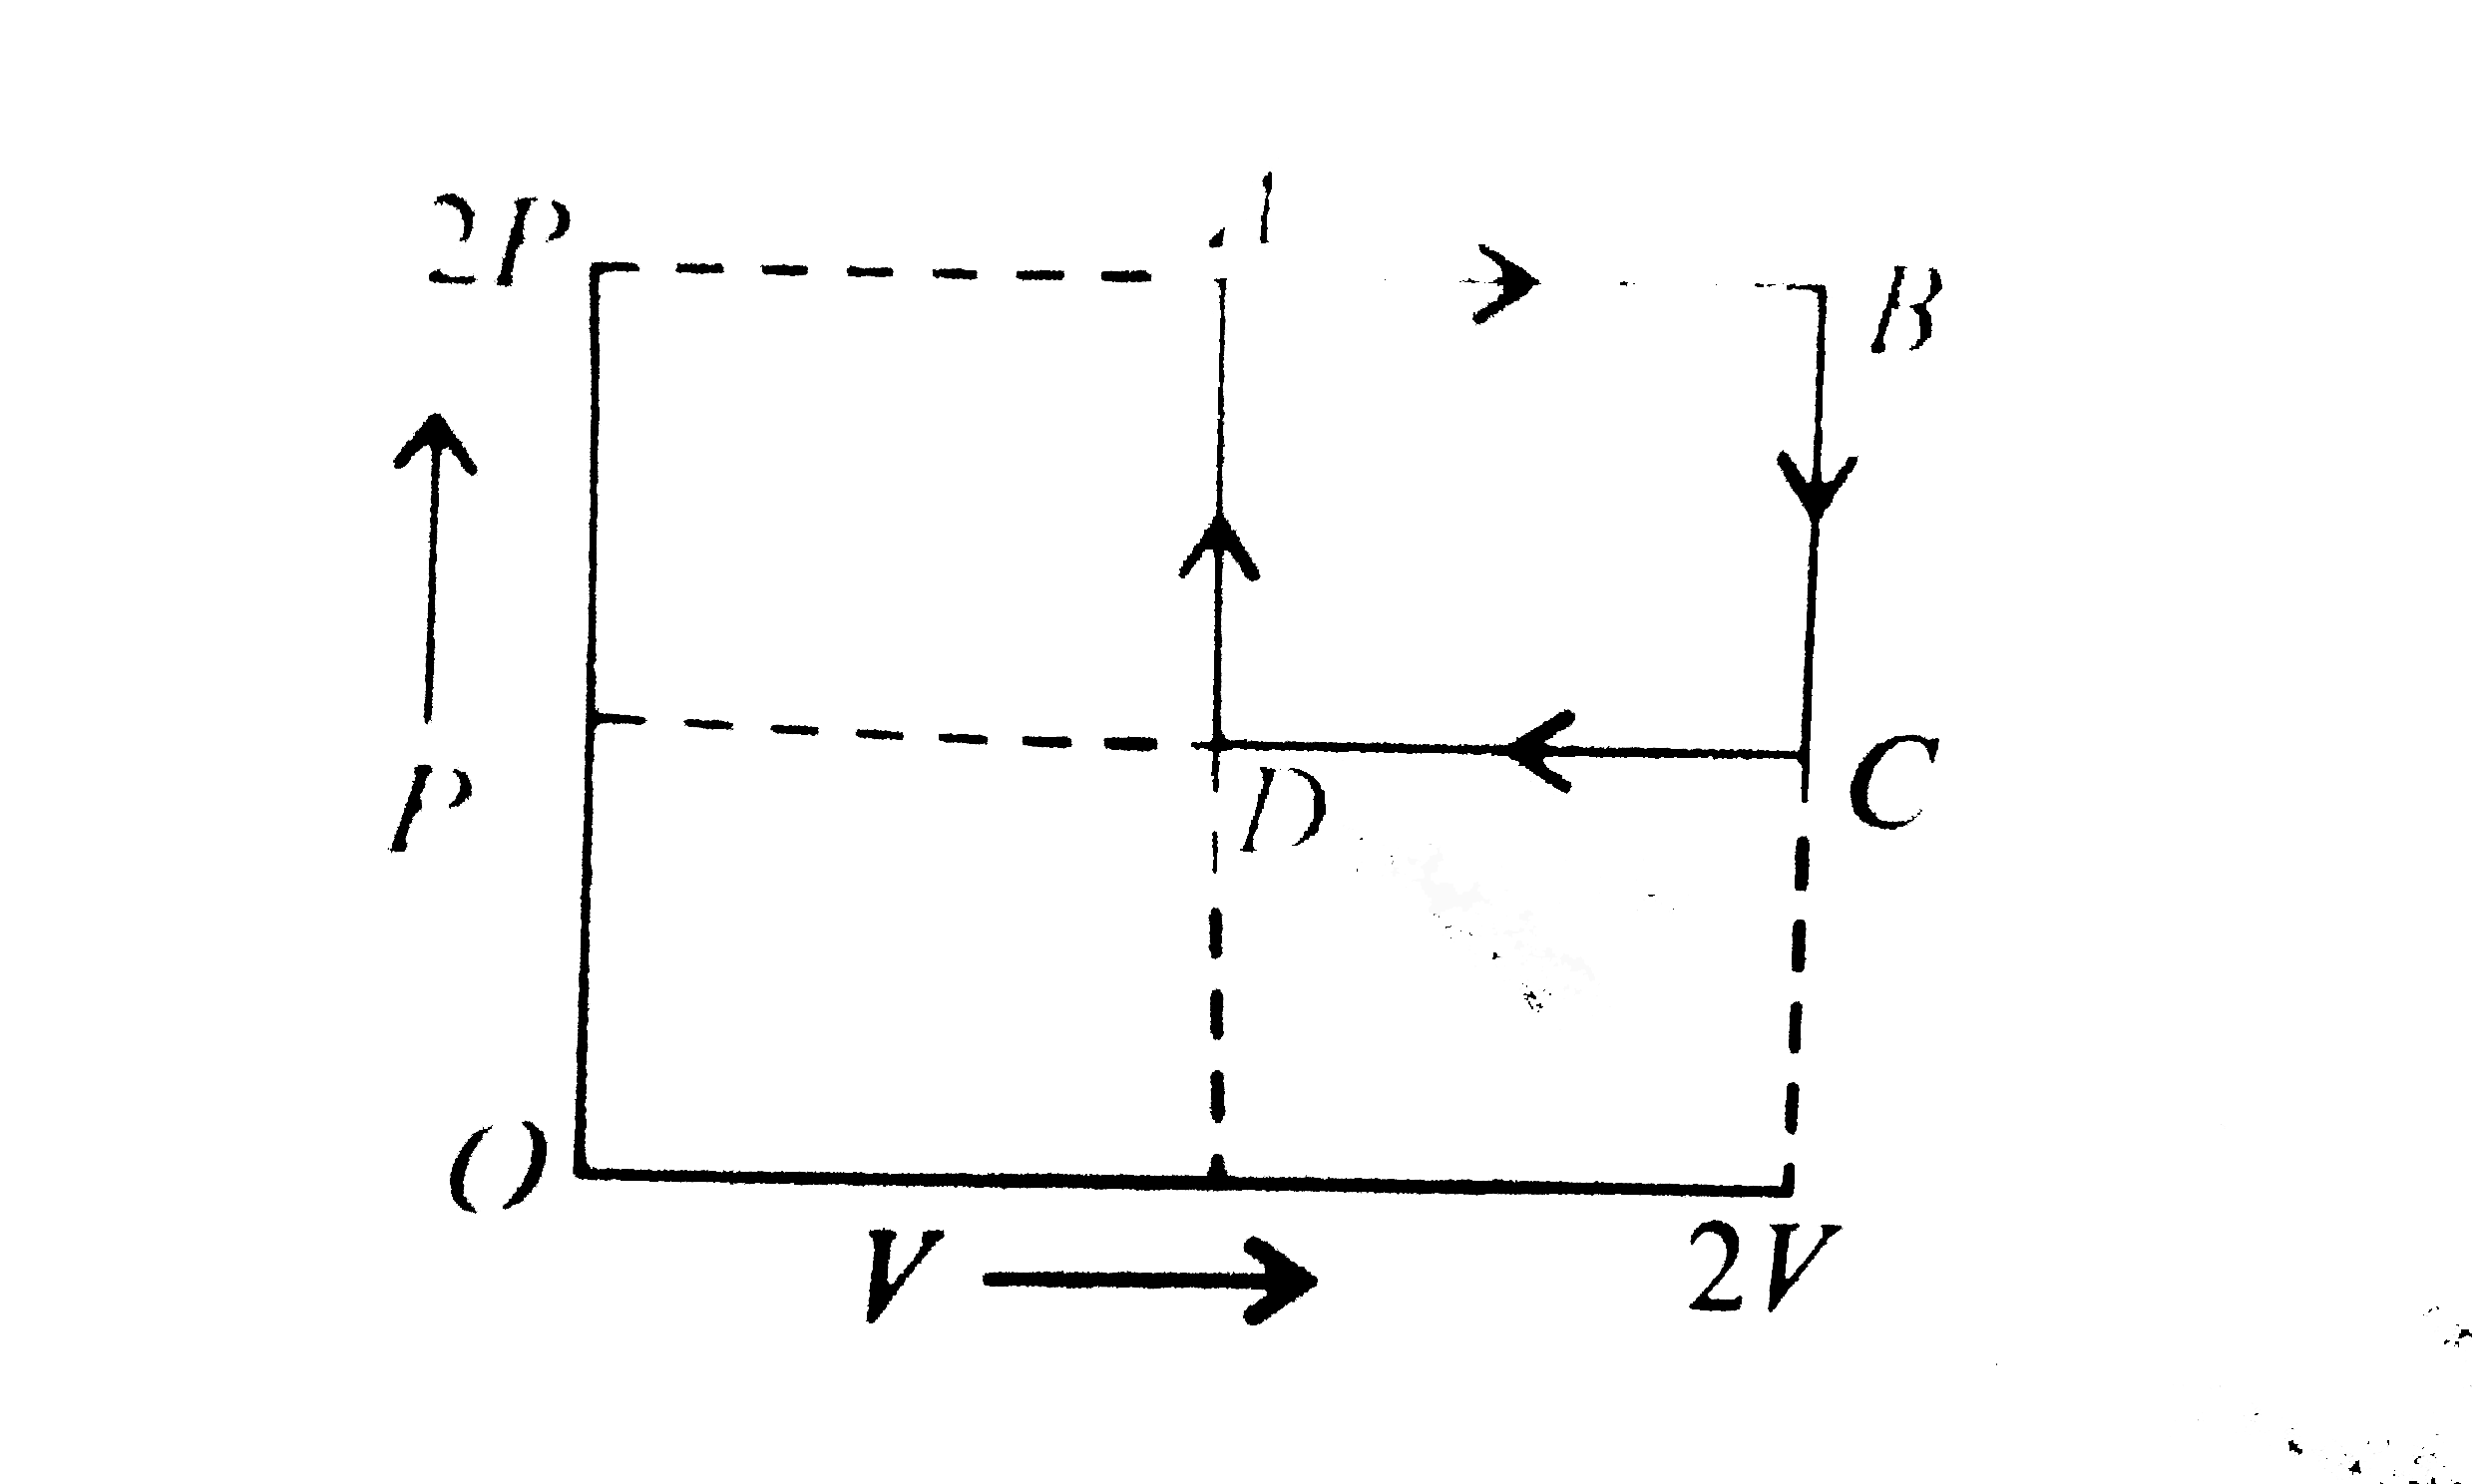
what would the be total work done by the gas?
View SolutionExplain the term temperature gradient. The two ends of a metal bar are maintained at two different consistant temperatures. On a single graph draw sketches to show the variation of temperature along the bar when its surface is (i) perfectly lagged and (ii) unlagged. Explain the shape of the two sketches.
View SolutionExplain with a graph the variation of molar conductivity of a strong electrolyte with dilution.
View Solution
