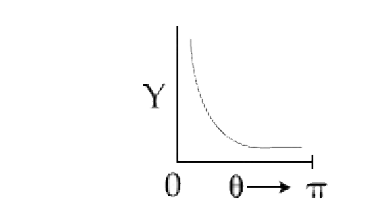
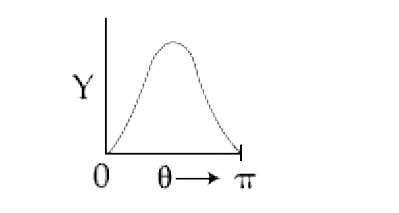
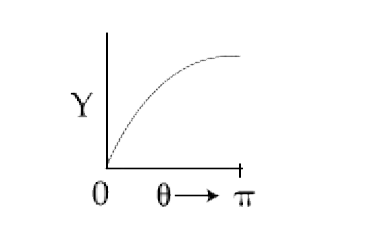
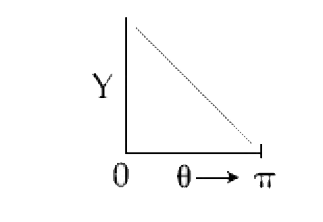
Number of the α- particle deflected in Rutherford's α -scattering experiment varies with the angle of deflection. Then the graph between the two is best represented by.


The correct Answer is:1
To solve the problem regarding the relationship between the number of alpha particles deflected and the angle of deflection in Rutherford's alpha-scattering experiment, we can follow these steps:
Step 1: Understand the Experiment
Rutherford's alpha-scattering experiment involved firing alpha particles at a thin gold foil. Most alpha particles passed straight through the foil, while a small fraction were deflected at various angles.
Step 2: Analyze the Deflection
The key observations from the experiment are:
- Most of the alpha particles (about 99%) pass through the foil without any deflection (0 degrees).
- A small number of alpha particles are deflected at small angles.
- An even smaller number are deflected at larger angles, with very few being deflected back (180 degrees).
Step 3: Relationship Between Deflection and Angle
The number of alpha particles deflected at a specific angle decreases as the angle increases. This is because:
- The likelihood of deflection is higher at smaller angles due to the greater cross-sectional area of the nucleus that the alpha particles can interact with.
- As the angle increases, the effective area for interaction decreases, leading to fewer deflections.
Step 4: Graphical Representation
Based on the above analysis, if we were to plot a graph with the angle of deflection (θ) on the x-axis and the number of deflected alpha particles on the y-axis, we would expect:
- A high number of deflections at small angles (close to 0 degrees).
- A rapid decrease in the number of deflections as the angle increases.
- The graph would likely show a curve that starts high and drops off steeply, resembling an exponential decay or a hyperbolic shape.
Conclusion
The graph that best represents the relationship between the number of alpha particles deflected and the angle of deflection is a decreasing curve, starting high at small angles and dropping off as the angle increases.
Rutherford's alpha-scattering experiment involved firing alpha particles at a thin gold foil. Most alpha particles passed straight through the foil, while a small fraction were deflected at various angles.
The key observations from the experiment are:
- Most of the alpha particles (about 99%) pass through the foil without any deflection (0 degrees).
- A small number of alpha particles are deflected at small angles.
- An even smaller number are deflected at larger angles, with very few being deflected back (180 degrees).
The number of alpha particles deflected at a specific angle decreases as the angle increases. This is because:
- The likelihood of deflection is higher at smaller angles due to the greater cross-sectional area of the nucleus that the alpha particles can interact with.
- As the angle increases, the effective area for interaction decreases, leading to fewer deflections.
Based on the above analysis, if we were to plot a graph with the angle of deflection (θ) on the x-axis and the number of deflected alpha particles on the y-axis, we would expect:
- A high number of deflections at small angles (close to 0 degrees).
- A rapid decrease in the number of deflections as the angle increases.
- The graph would likely show a curve that starts high and drops off steeply, resembling an exponential decay or a hyperbolic shape.
The graph that best represents the relationship between the number of alpha particles deflected and the angle of deflection is a decreasing curve, starting high at small angles and dropping off as the angle increases.
Topper's Solved these Questions
Similar Questions
Rutherford's alpha-particle scattering experiment discovered
View SolutionRutherford's α− scattering experiment was successful in discovering
View SolutionRutherford's α particle scattering experiment eventually led to the conclusion that
View SolutionRutherford's α particle scattering experiment eventually led to the conclusion that
View SolutionRutherford's αparticle dispersion experiment concludes that
View SolutionIn scattering experiment , α -particles were deflected by
View SolutionIn Rutherford's alpha-rays scattering experiment, the alpha particles are detected using a screen coated with
View SolutionRutherford's α scattering led to which of the following conclusions
View SolutionEnergy of the beam of α-particles used by Geiger and Marsden in scattering experiment is
View SolutionRutherford's alpha(α) particles scattering experiment resulted into discovery of
View Solution
