If a graph is plotted between T2andr3 for a planet, then its slope will be be (where MS is the mass of the sun)
A. 4π2GMS
B.GMS4π
C. 4πGMS
D.GMS
The correct Answer is:A
To solve the problem, we need to determine the slope of the graph plotted between T2 (the square of the orbital period of a planet) and r3 (the cube of the radius of the orbit) for a planet orbiting the Sun. We will use Kepler's Third Law of planetary motion, which states that the square of the period of orbit T is directly proportional to the cube of the semi-major axis of its orbit r.
1. Understanding the Relationship: According to Kepler's Third Law, we have the relation:
T2∝r3
This implies that:
T2=k⋅r3
where k is a constant.
2. Expressing the Constant k: For a planet orbiting the Sun, we can express k in terms of the gravitational constant G and the mass of the Sun MS:
k=4π2GMS
Thus, we can rewrite the equation as:
T2=4π2GMS⋅r3
3. Identifying the Slope: From the equation T2=4π2GMS⋅r3, we can see that if we plot T2 on the y-axis and r3 on the x-axis, the slope of the line will be:
slope=4π2GMS
4. Conclusion: Therefore, the slope of the graph plotted between T2 and r3 is:
slope=4π2GMS
This corresponds to option A.
Final Answer:
The slope of the graph between T2 and r3 is 4π2GMS (Option A).
---
T2∝r3
This implies that:
T2=k⋅r3
where k is a constant.
k=4π2GMS
Thus, we can rewrite the equation as:
T2=4π2GMS⋅r3
slope=4π2GMS
slope=4π2GMS
This corresponds to option A.
The slope of the graph between T2 and r3 is 4π2GMS (Option A).
Topper's Solved these Questions
- BOOK - NCERT FINGERTPS ENGLISHCHAPTER - GRAVITATIONEXERCISE - Universal law of Gravitations14videos
GRAVITATION
- BOOK - NCERT FINGERTPS ENGLISHCHAPTER - GRAVITATIONEXERCISE - The Gravitational constant8videos
GRAVITATION
- BOOK - NCERT FINGERTPS ENGLISHCHAPTER - KINETIC THEORYEXERCISE - Assertion And Reason10videos
KINETIC THEORY
Similar Questions
Knowledge Check
- Question 1 - Select One
The aeral velocity and the angular moementum of the planet are related by which of the following relationos? (where mp is the same mass of the planet)
AΔ→tΔt=→L2mpBΔ→tΔt=→LmpCΔ→tΔt=2→LmpDΔ→tΔt=→L√2mp
For an ideal solution, if a graph is plotted between 1PT and yA (mole fraction of A in vapour phase) where p0A>p0B then
View SolutionA graph is plotted between p (atm) vs t∘C for 10 mol of an ideal gas as follows:
Then slope of curve and volume of container (L) respectively, are:
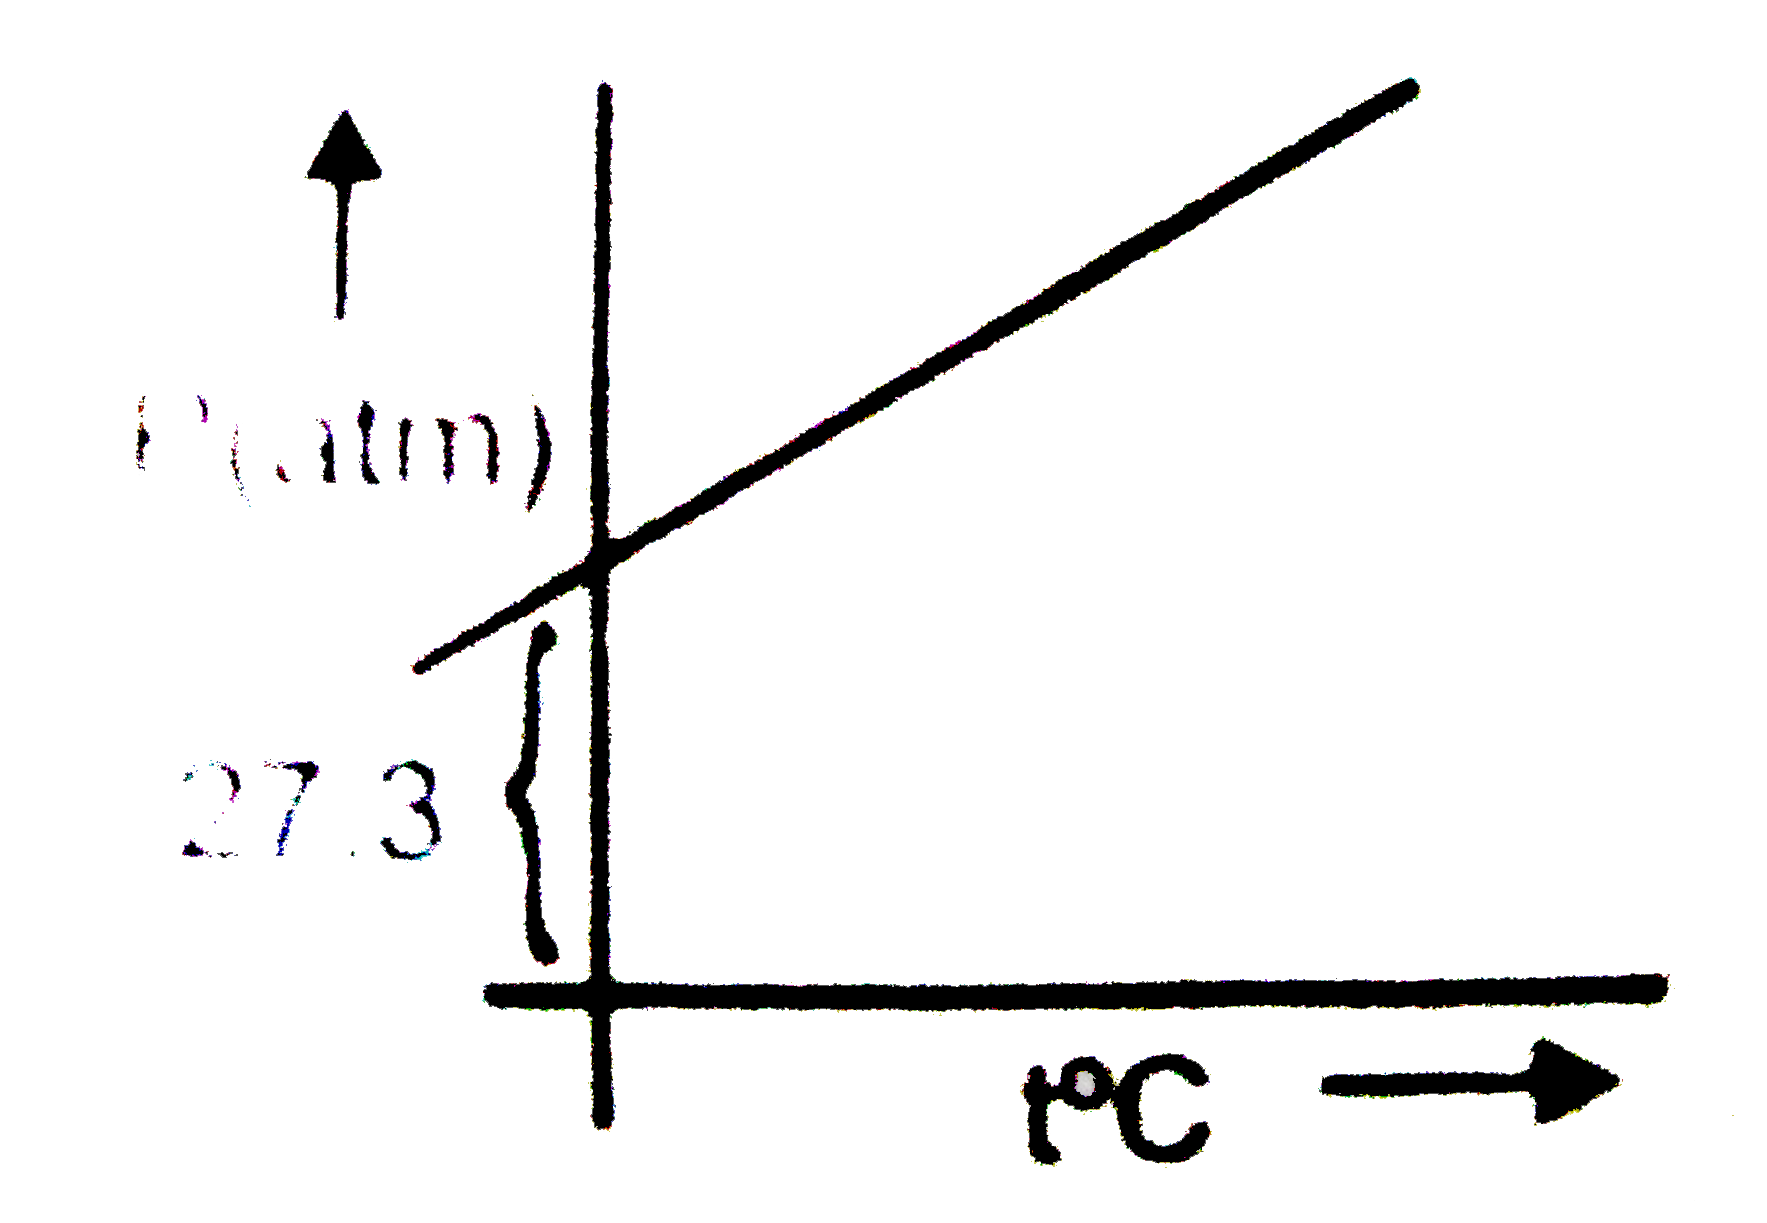 View Solution
In the graph plotted between vapour pressure (V.P.) and temperature (T),
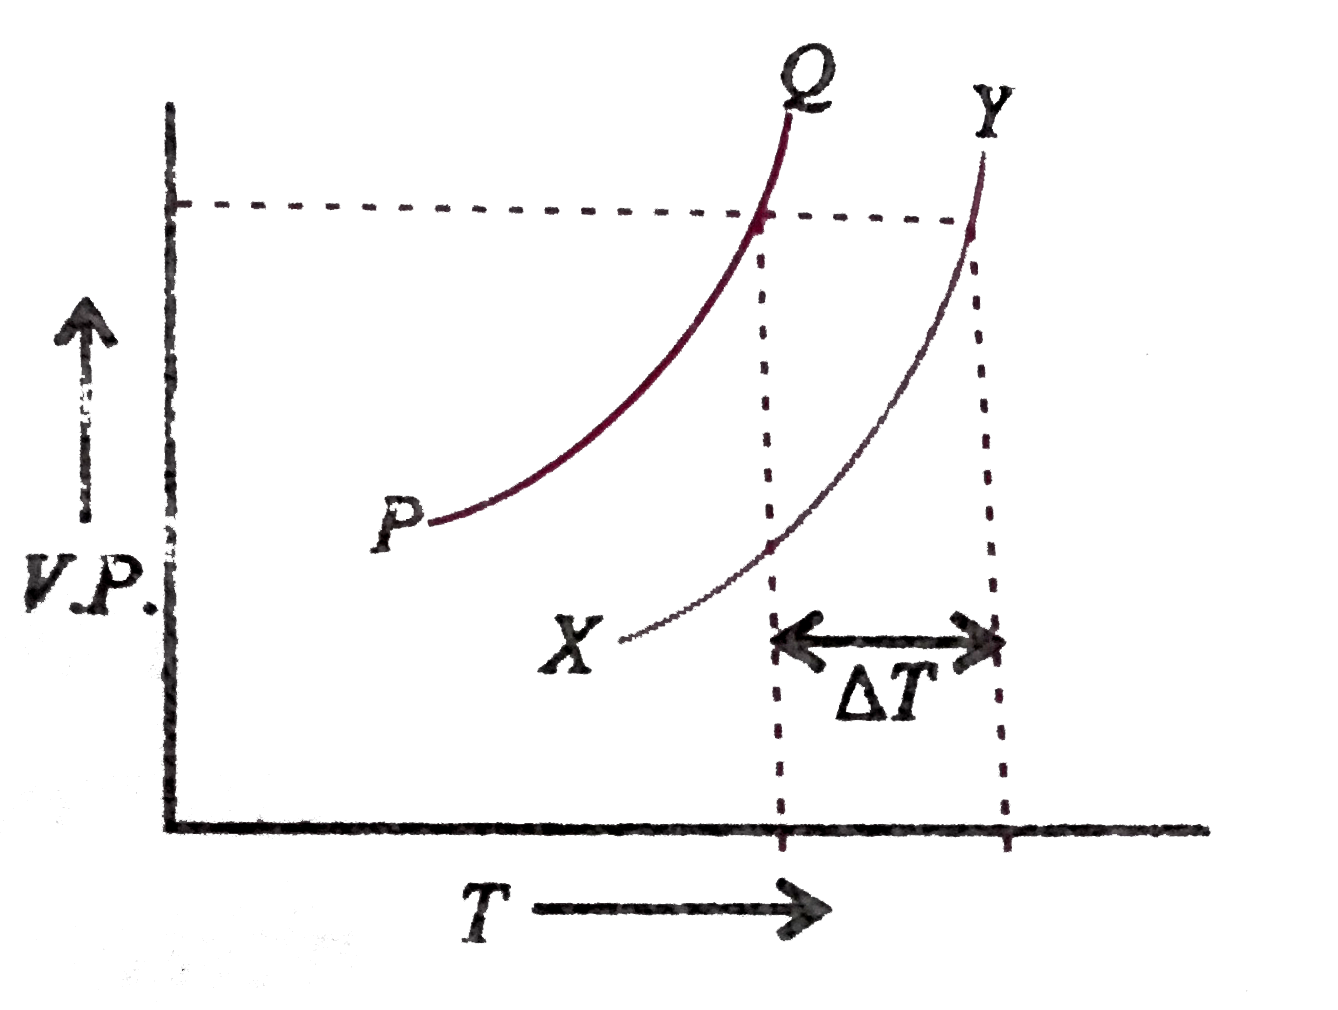 View Solution
The activity of a certain radioactive sample is plotted against time in graph. If the initial slope of the curve is m, then find the slope of the curve at point P ?
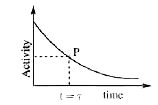 View Solution
The slope of line plotted between In k versus (1/T) Arrhenius equation is given by
View SolutionWhen a plot between logk and 1/T is plotted we get the graph as shown.
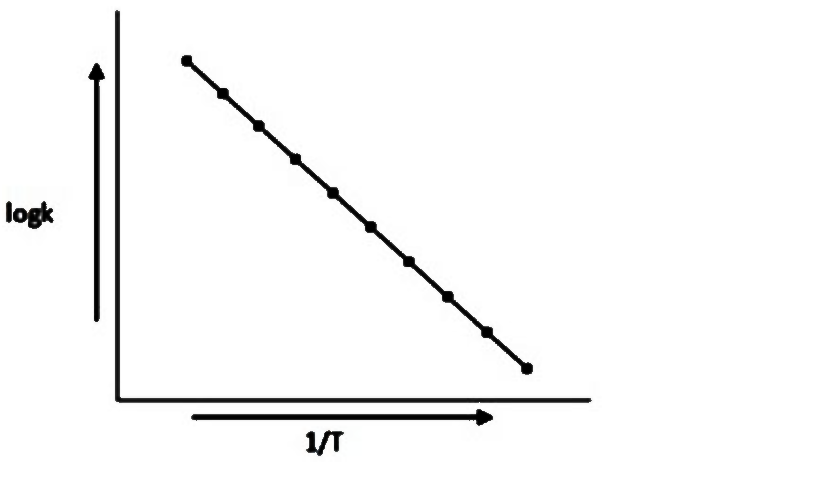
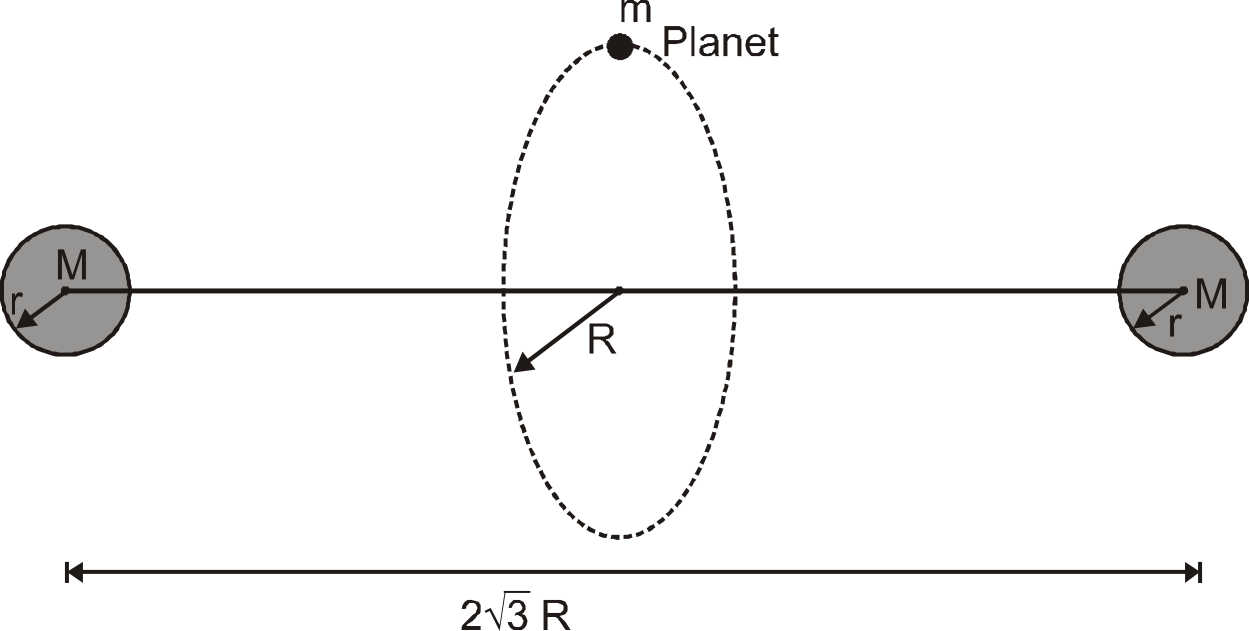
What is the value of slope in the graph?View SolutionConsider a hypothetical solar system, which has two identical massive suns each of mass M and radius r, seperated by a seperation of 2√3R (centre to centre). (R gtgtgtr). These suns are always at rest. There is only one planet in this solar system having mass m. This planet is revolving in circular orbit of radius R such that centre of the orbit lies at the mid point of the line joining the centres of the sun and plane of the orbit is perpendicular to the line joining the centres of the sun. Whole situation is shown in the figure.
 View Solution

