A graph plot between xm and pressure The value of n at point A is
2
1
12
'1/3'
The correct Answer is:A
To solve the question regarding the value of n at point A on the graph plotting xm against pressure, we will follow these steps:
1. Understand the Freundlich Adsorption Isotherm:
The Freundlich adsorption isotherm is given by the equation:
xm=kP1n
where:
- xm is the amount of adsorbate per unit mass of adsorbent,
- P is the pressure,
- k is a constant,
- n is a constant that indicates the nature of the adsorption.
2. Analyze the Graph:
The graph plots xm (on the y-axis) against pressure P (on the x-axis). The behavior of the graph at different pressure ranges is crucial:
- At low pressures, xm is directly proportional to P (linear relationship), which implies n=1.
- At high pressures, xm approaches a constant value, indicating n tends to infinity (adsorption becomes independent of pressure).
- At intermediate pressures, the relationship is non-linear, and n is greater than 1.
3. Identify Point A:
Since point A is described as being at intermediate pressure, we can conclude that it does not fall into the low or high-pressure categories.
4. Determine the Value of n:
Given that point A is at an intermediate pressure, we can conclude that:
n>1
5. Final Conclusion:
Therefore, the value of n at point A is greater than 1.
Summary:
The value of n at point A is greater than 1.
The Freundlich adsorption isotherm is given by the equation:
xm=kP1n
where:
- xm is the amount of adsorbate per unit mass of adsorbent,
- P is the pressure,
- k is a constant,
- n is a constant that indicates the nature of the adsorption.
The graph plots xm (on the y-axis) against pressure P (on the x-axis). The behavior of the graph at different pressure ranges is crucial:
- At low pressures, xm is directly proportional to P (linear relationship), which implies n=1.
- At high pressures, xm approaches a constant value, indicating n tends to infinity (adsorption becomes independent of pressure).
- At intermediate pressures, the relationship is non-linear, and n is greater than 1.
Since point A is described as being at intermediate pressure, we can conclude that it does not fall into the low or high-pressure categories.
Given that point A is at an intermediate pressure, we can conclude that:
n>1
Therefore, the value of n at point A is greater than 1.
The value of n at point A is greater than 1.
Similar Questions
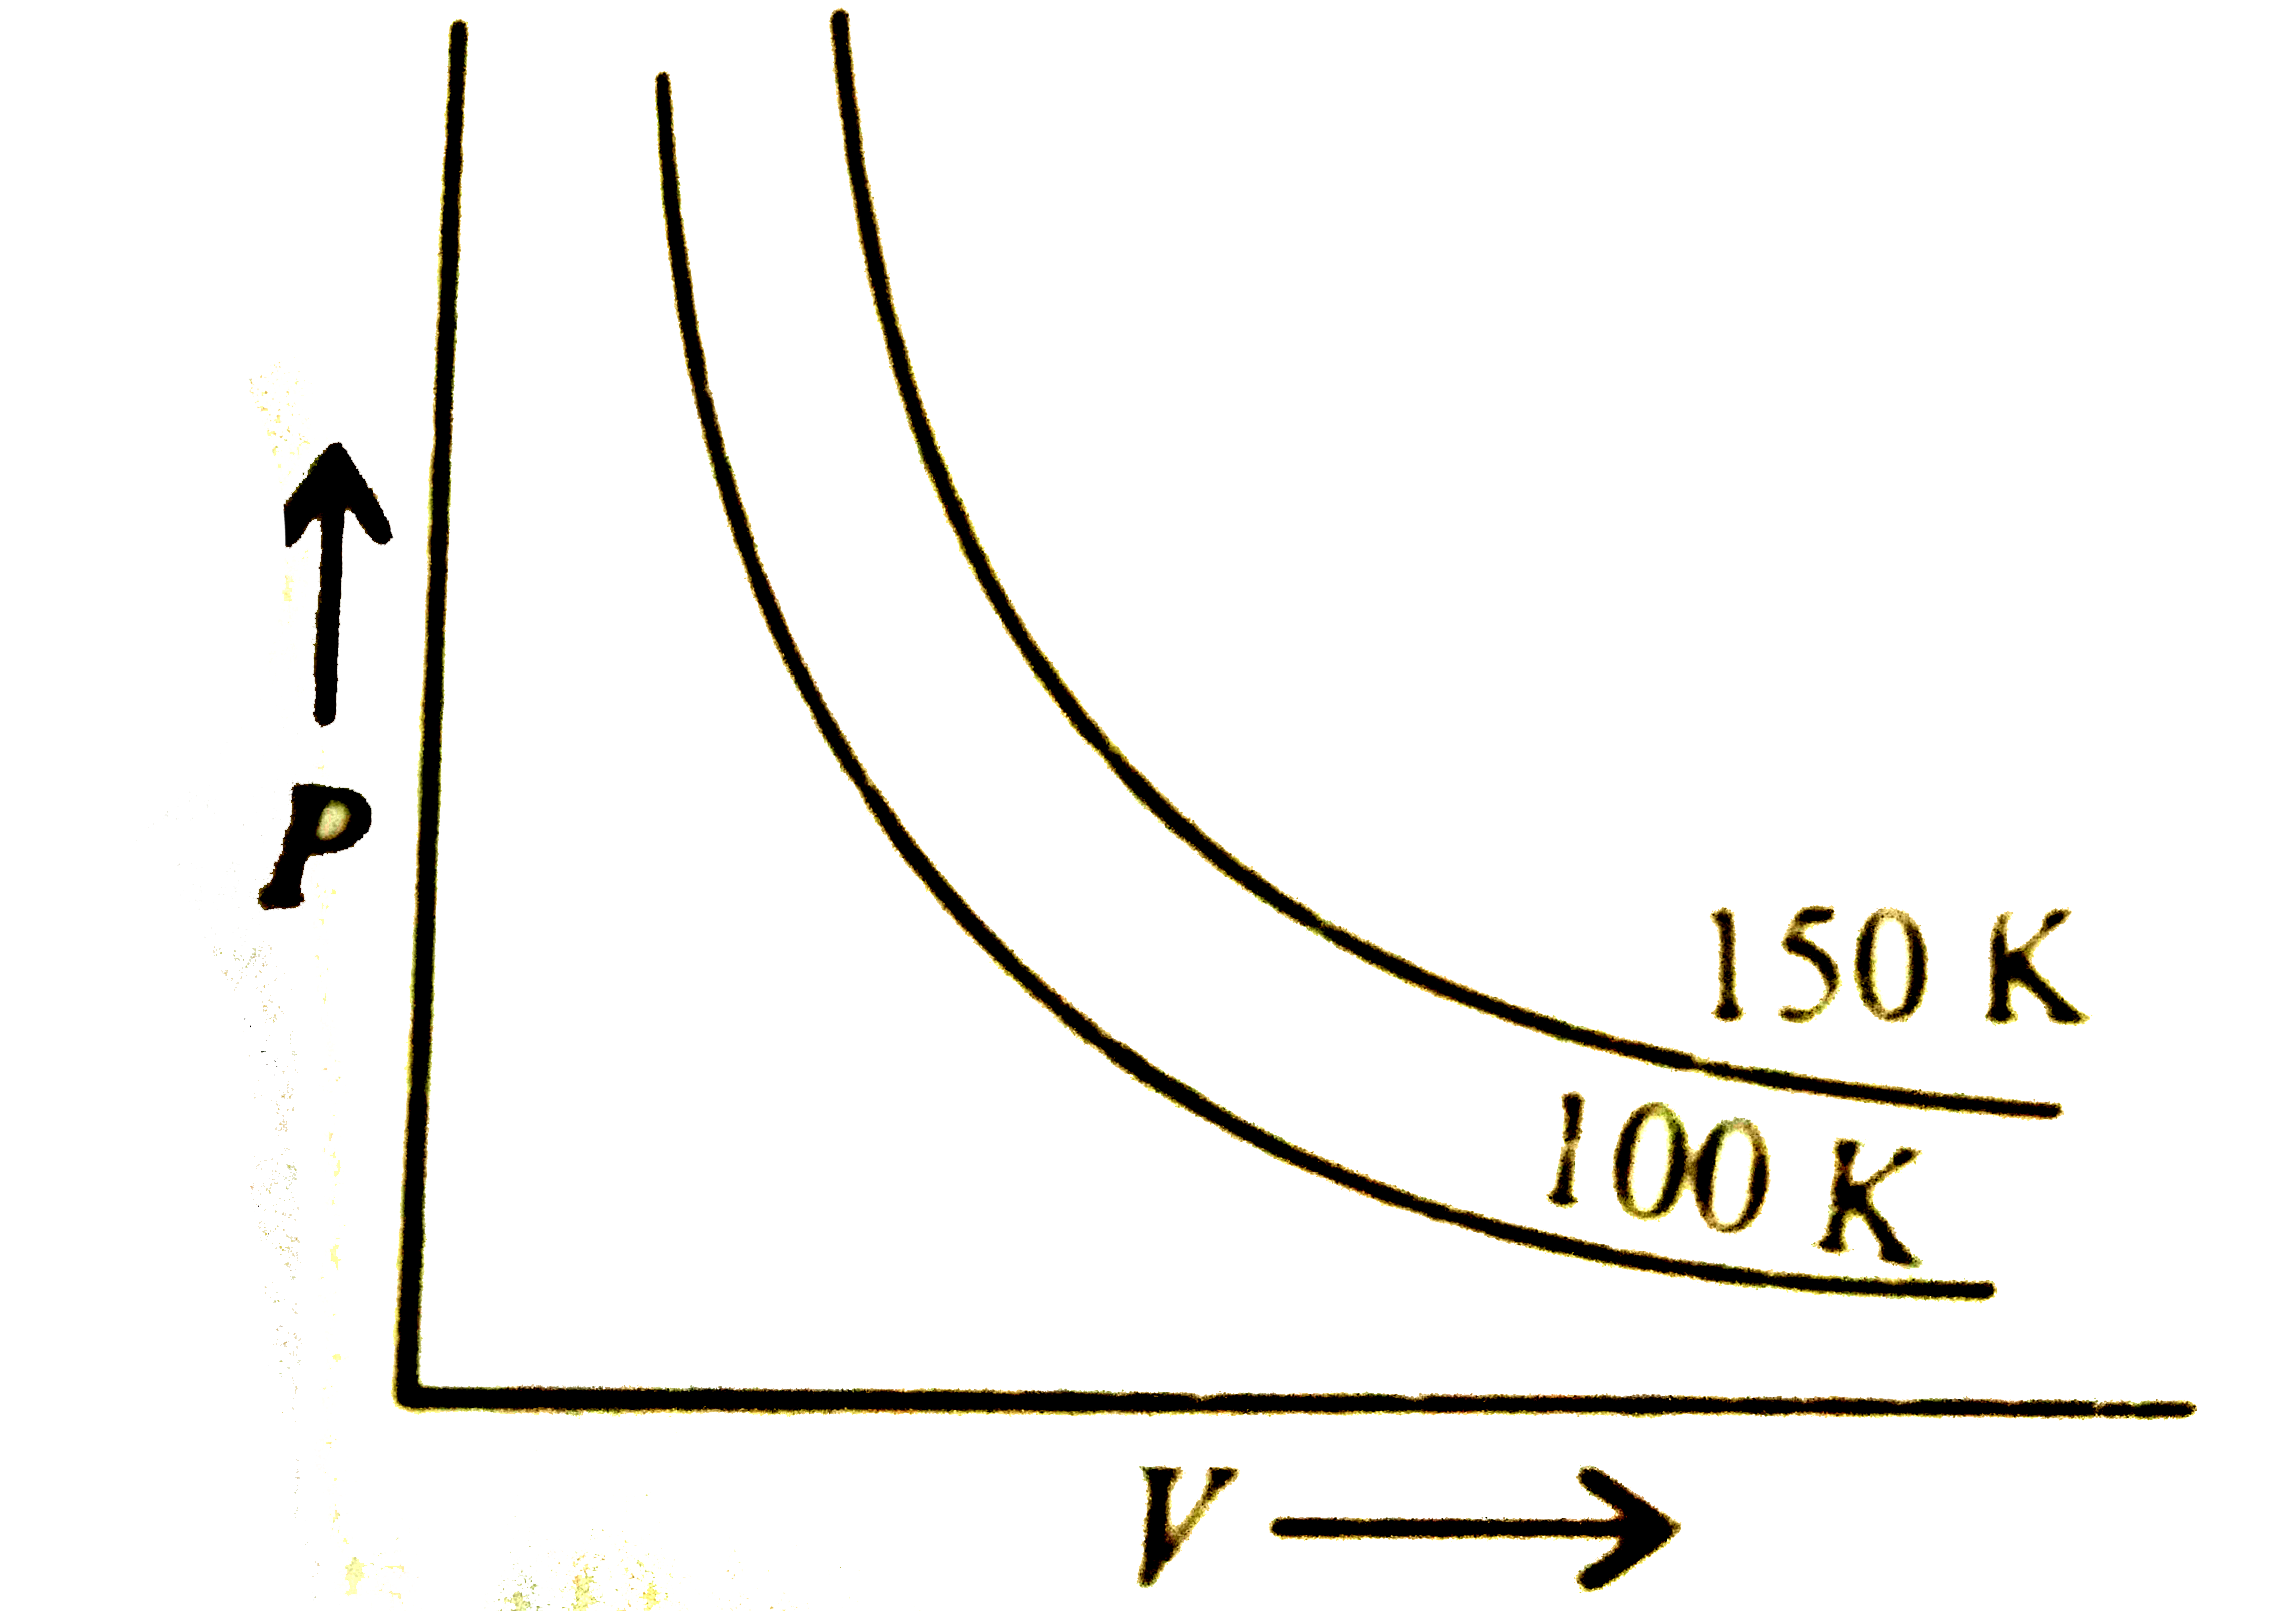
A graph is plotted between pressure and volume at different temperatures . On the basis of the graph what changes will you observe in the volume if
(i) the pressure is increased at constant temperature .
(ii) the temperature is decreased at constant pressure .
 View Solution
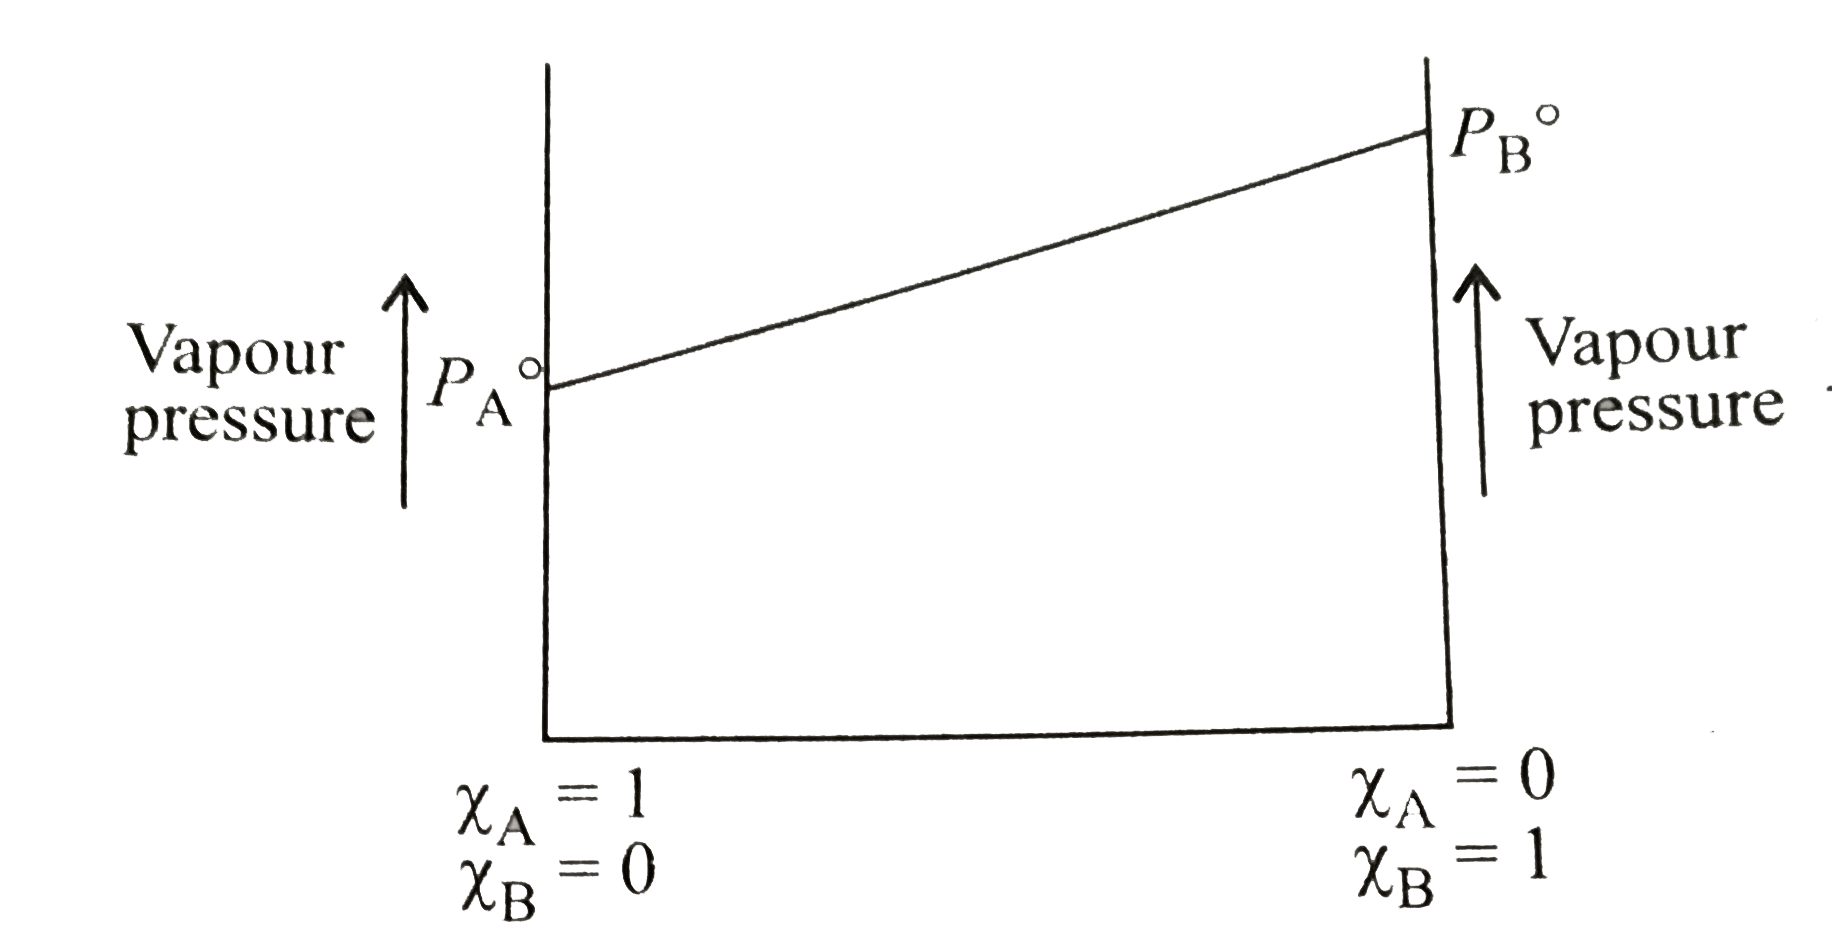
The following is a graph plotted between the vapour pressure of two volatile liquids against their respective mole fractions. Which of the following statements is/are correct?
 View Solution
Knowledge Check
- Question 1 - Select One
If a graph is plotted between T2andr3 for a planet, then its slope will be be (where MS is the mass of the sun)
A4π2GMSBGMS4πC4πGMSDGMS
If a graph is plotted between 1/v and 1/u , which one of the graph shown in figure is approximately correct ?
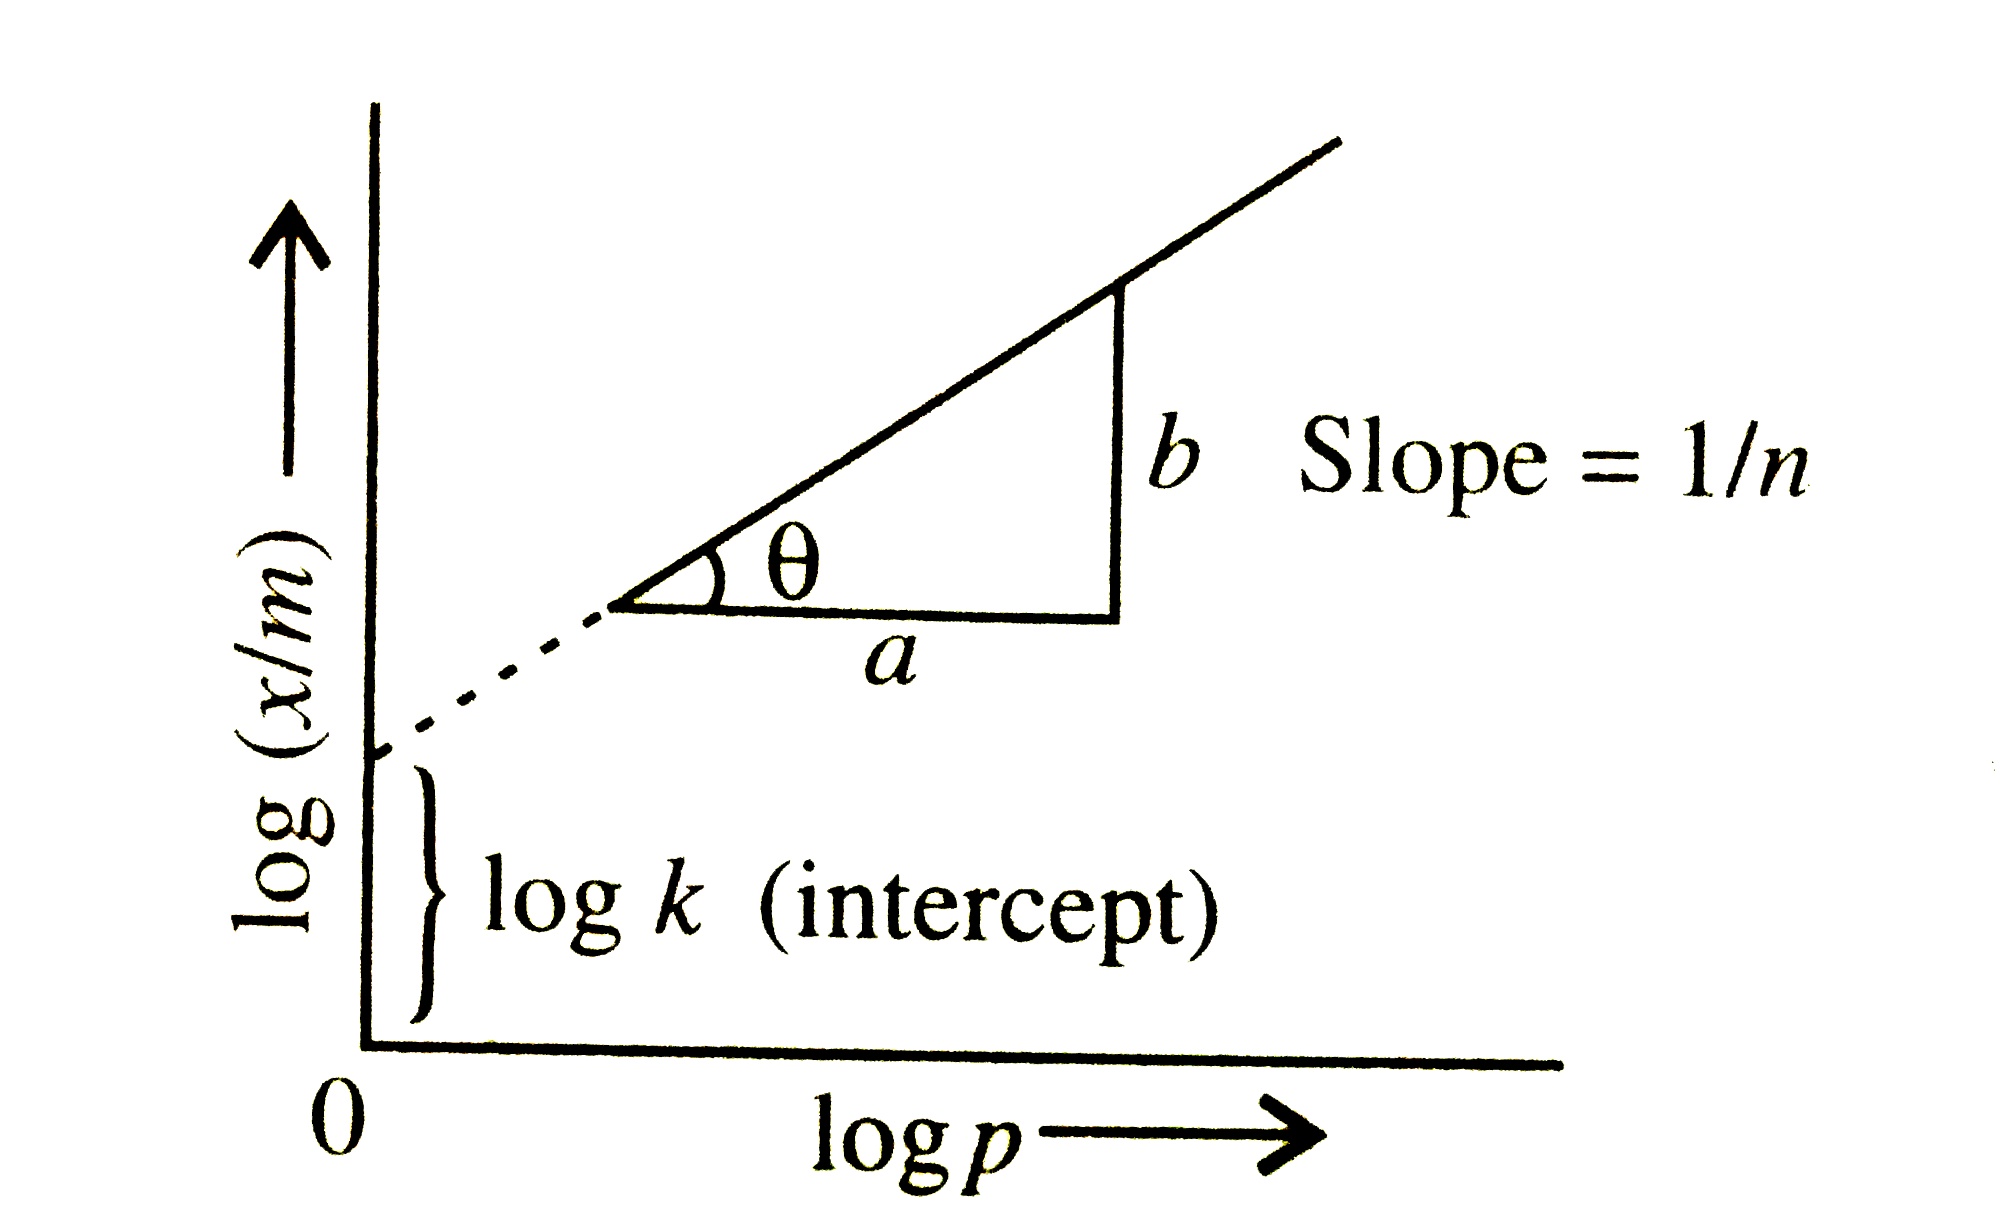
View SolutionA graph is plotted between log (x/m) and log p according to the equation xmkp1/n

Which is the following statements about his graph is not correct ?View SolutionIf a graph is plotted between log(a−x) and t, the slope of the straight line is equal to −0.03. The specific reaction rate will be
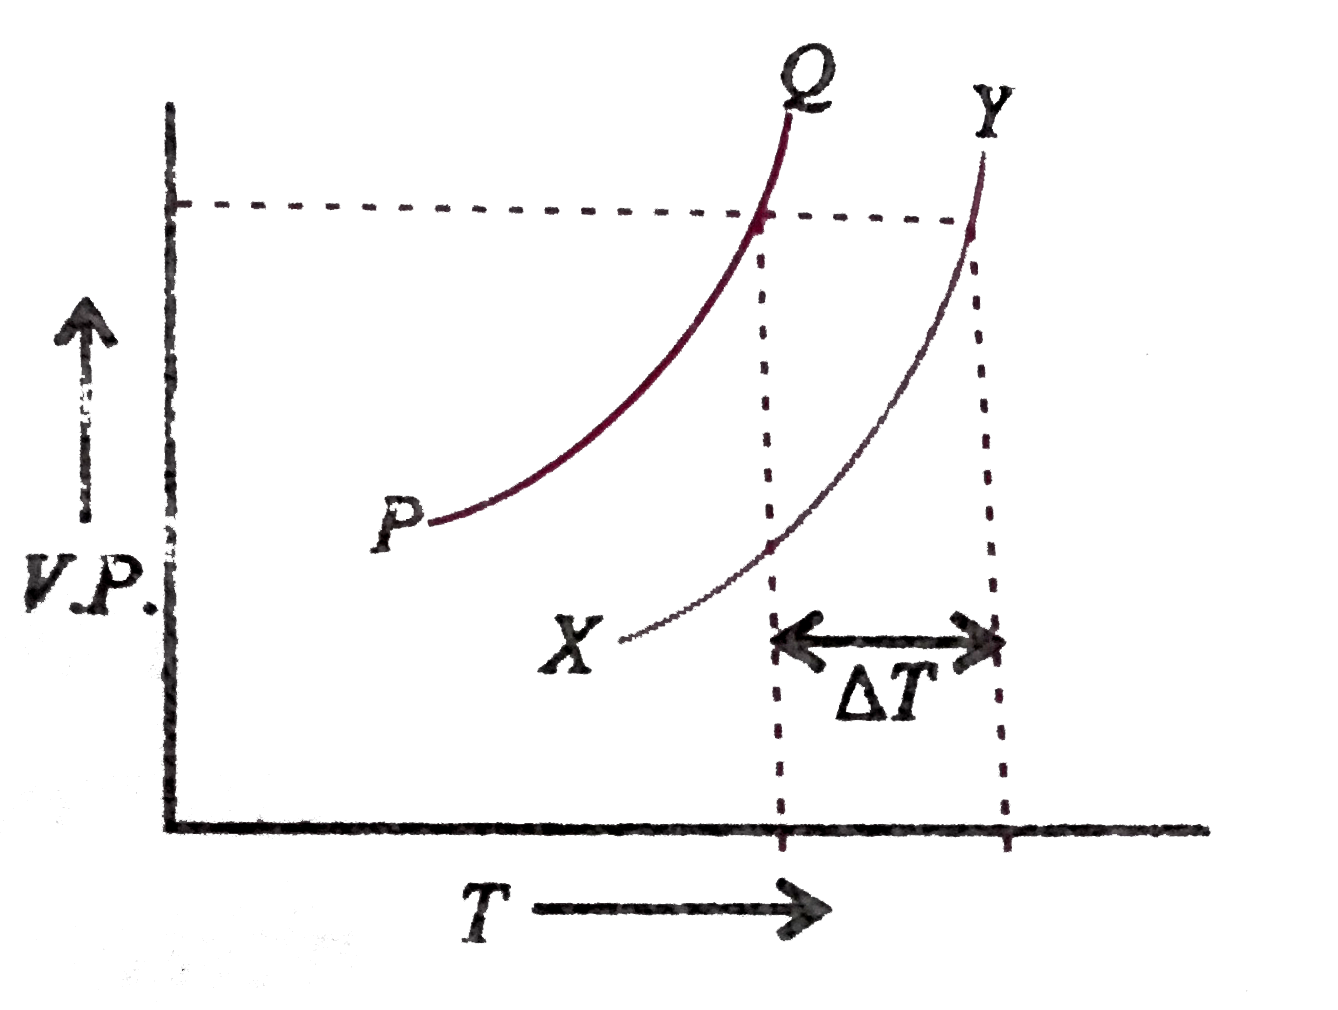
View SolutionIn the graph plotted between vapour pressure (V.P.) and temperature (T),
 View Solution
A graph plotted between Pdvsd (where p is osmotic pressure of solution of a solute of mol. Wt. m and d is its density temperature T. Pick out the correct statements about the plots :
View SolutionA graph is plotted by taking pressure along y-axis and centigrade temperature along X-axis for an ideal gas at constant volume. x intercept of the graph is
View SolutionA graph is plotted between PVm along y-axis and P along x-axis, where Vm is the molar volume of a real gas. Find the intercept .
View Solution

