Which one of the following graphs show the relationship between the rate of an enzymatic activity and substrate concentration (s) ?Solution in Gujrati
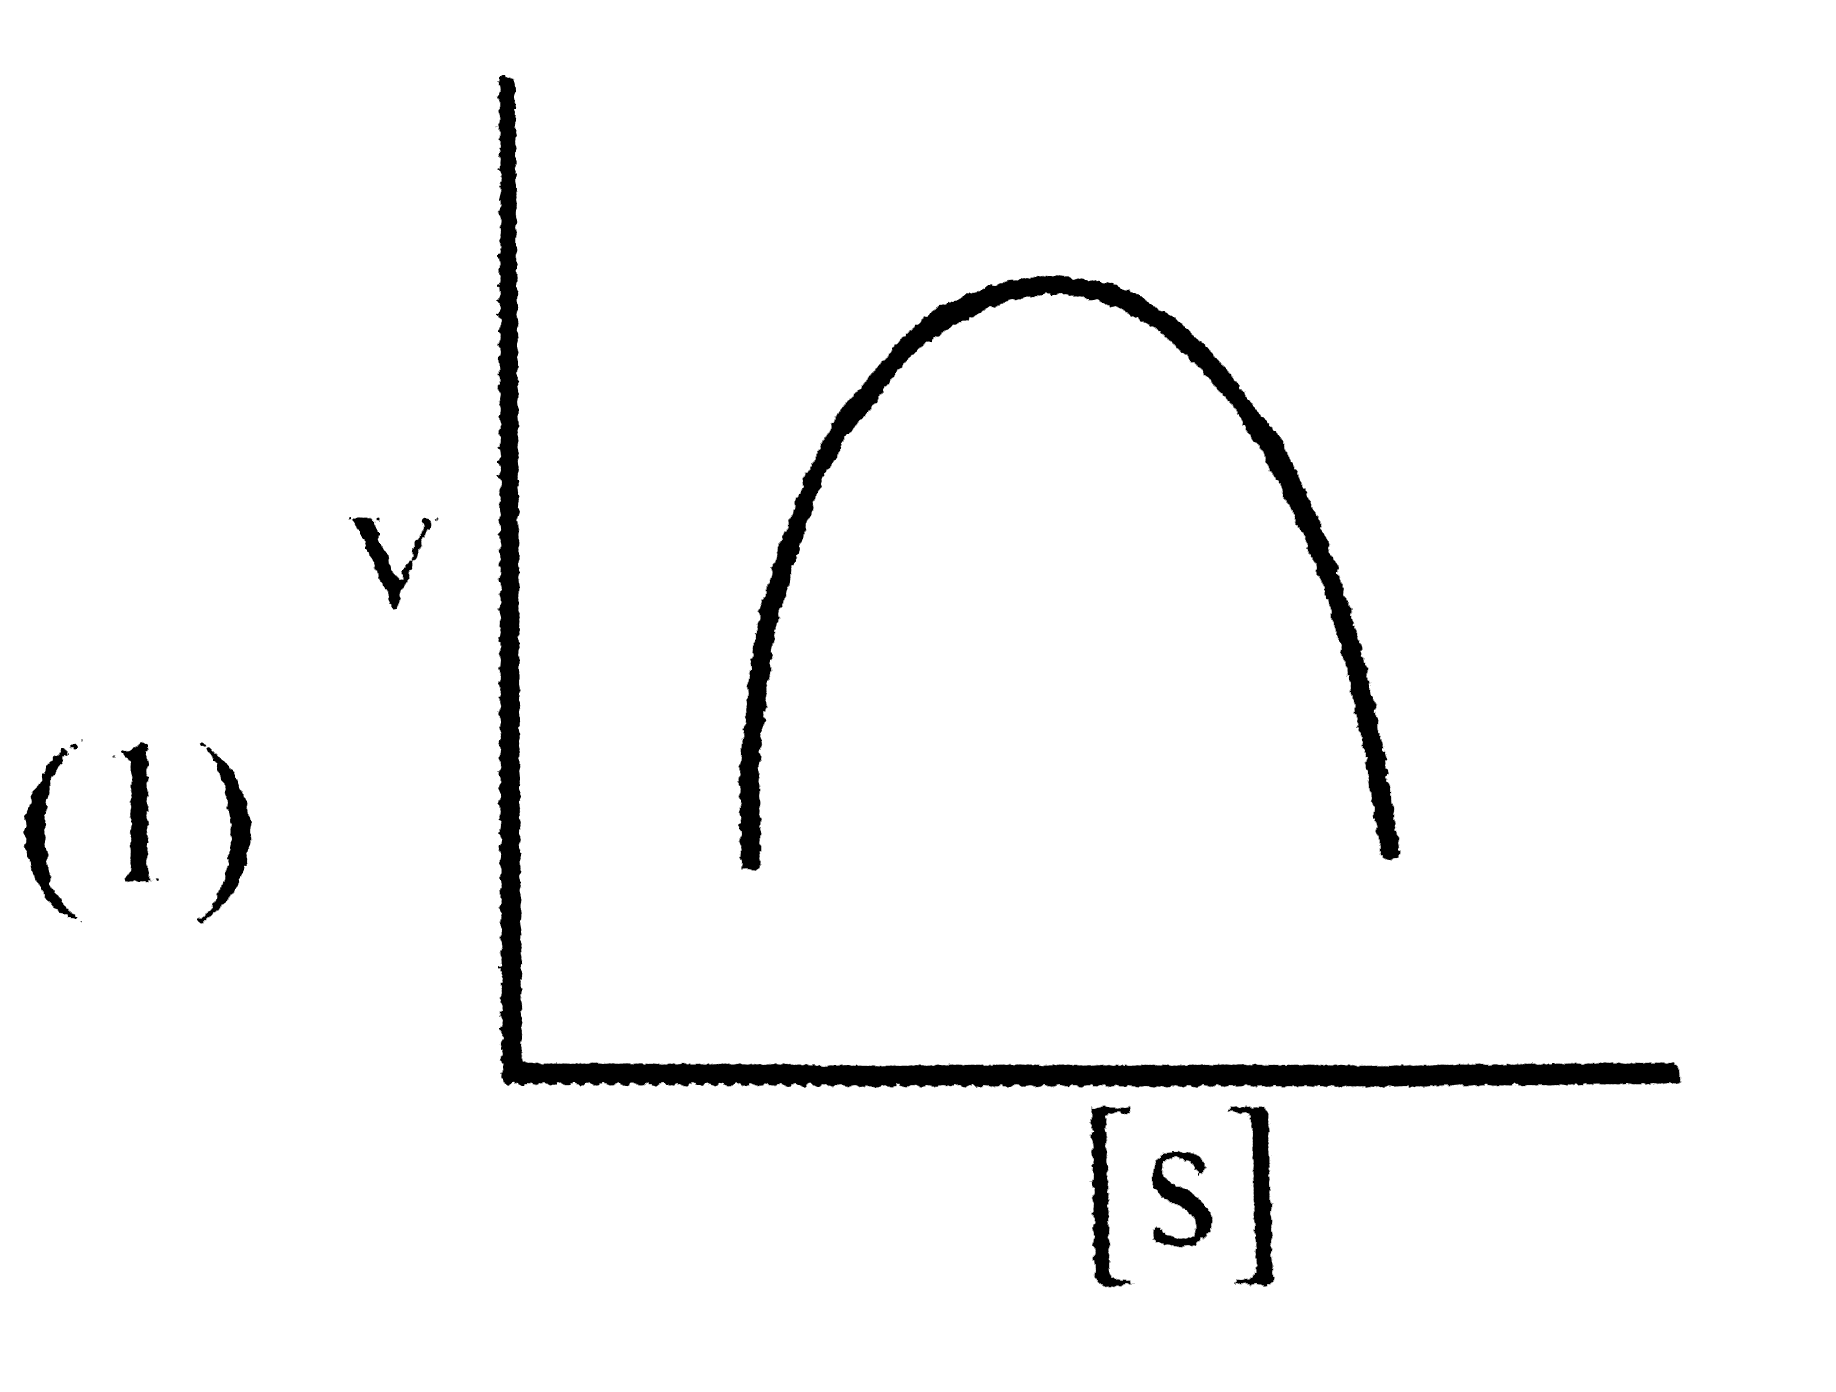
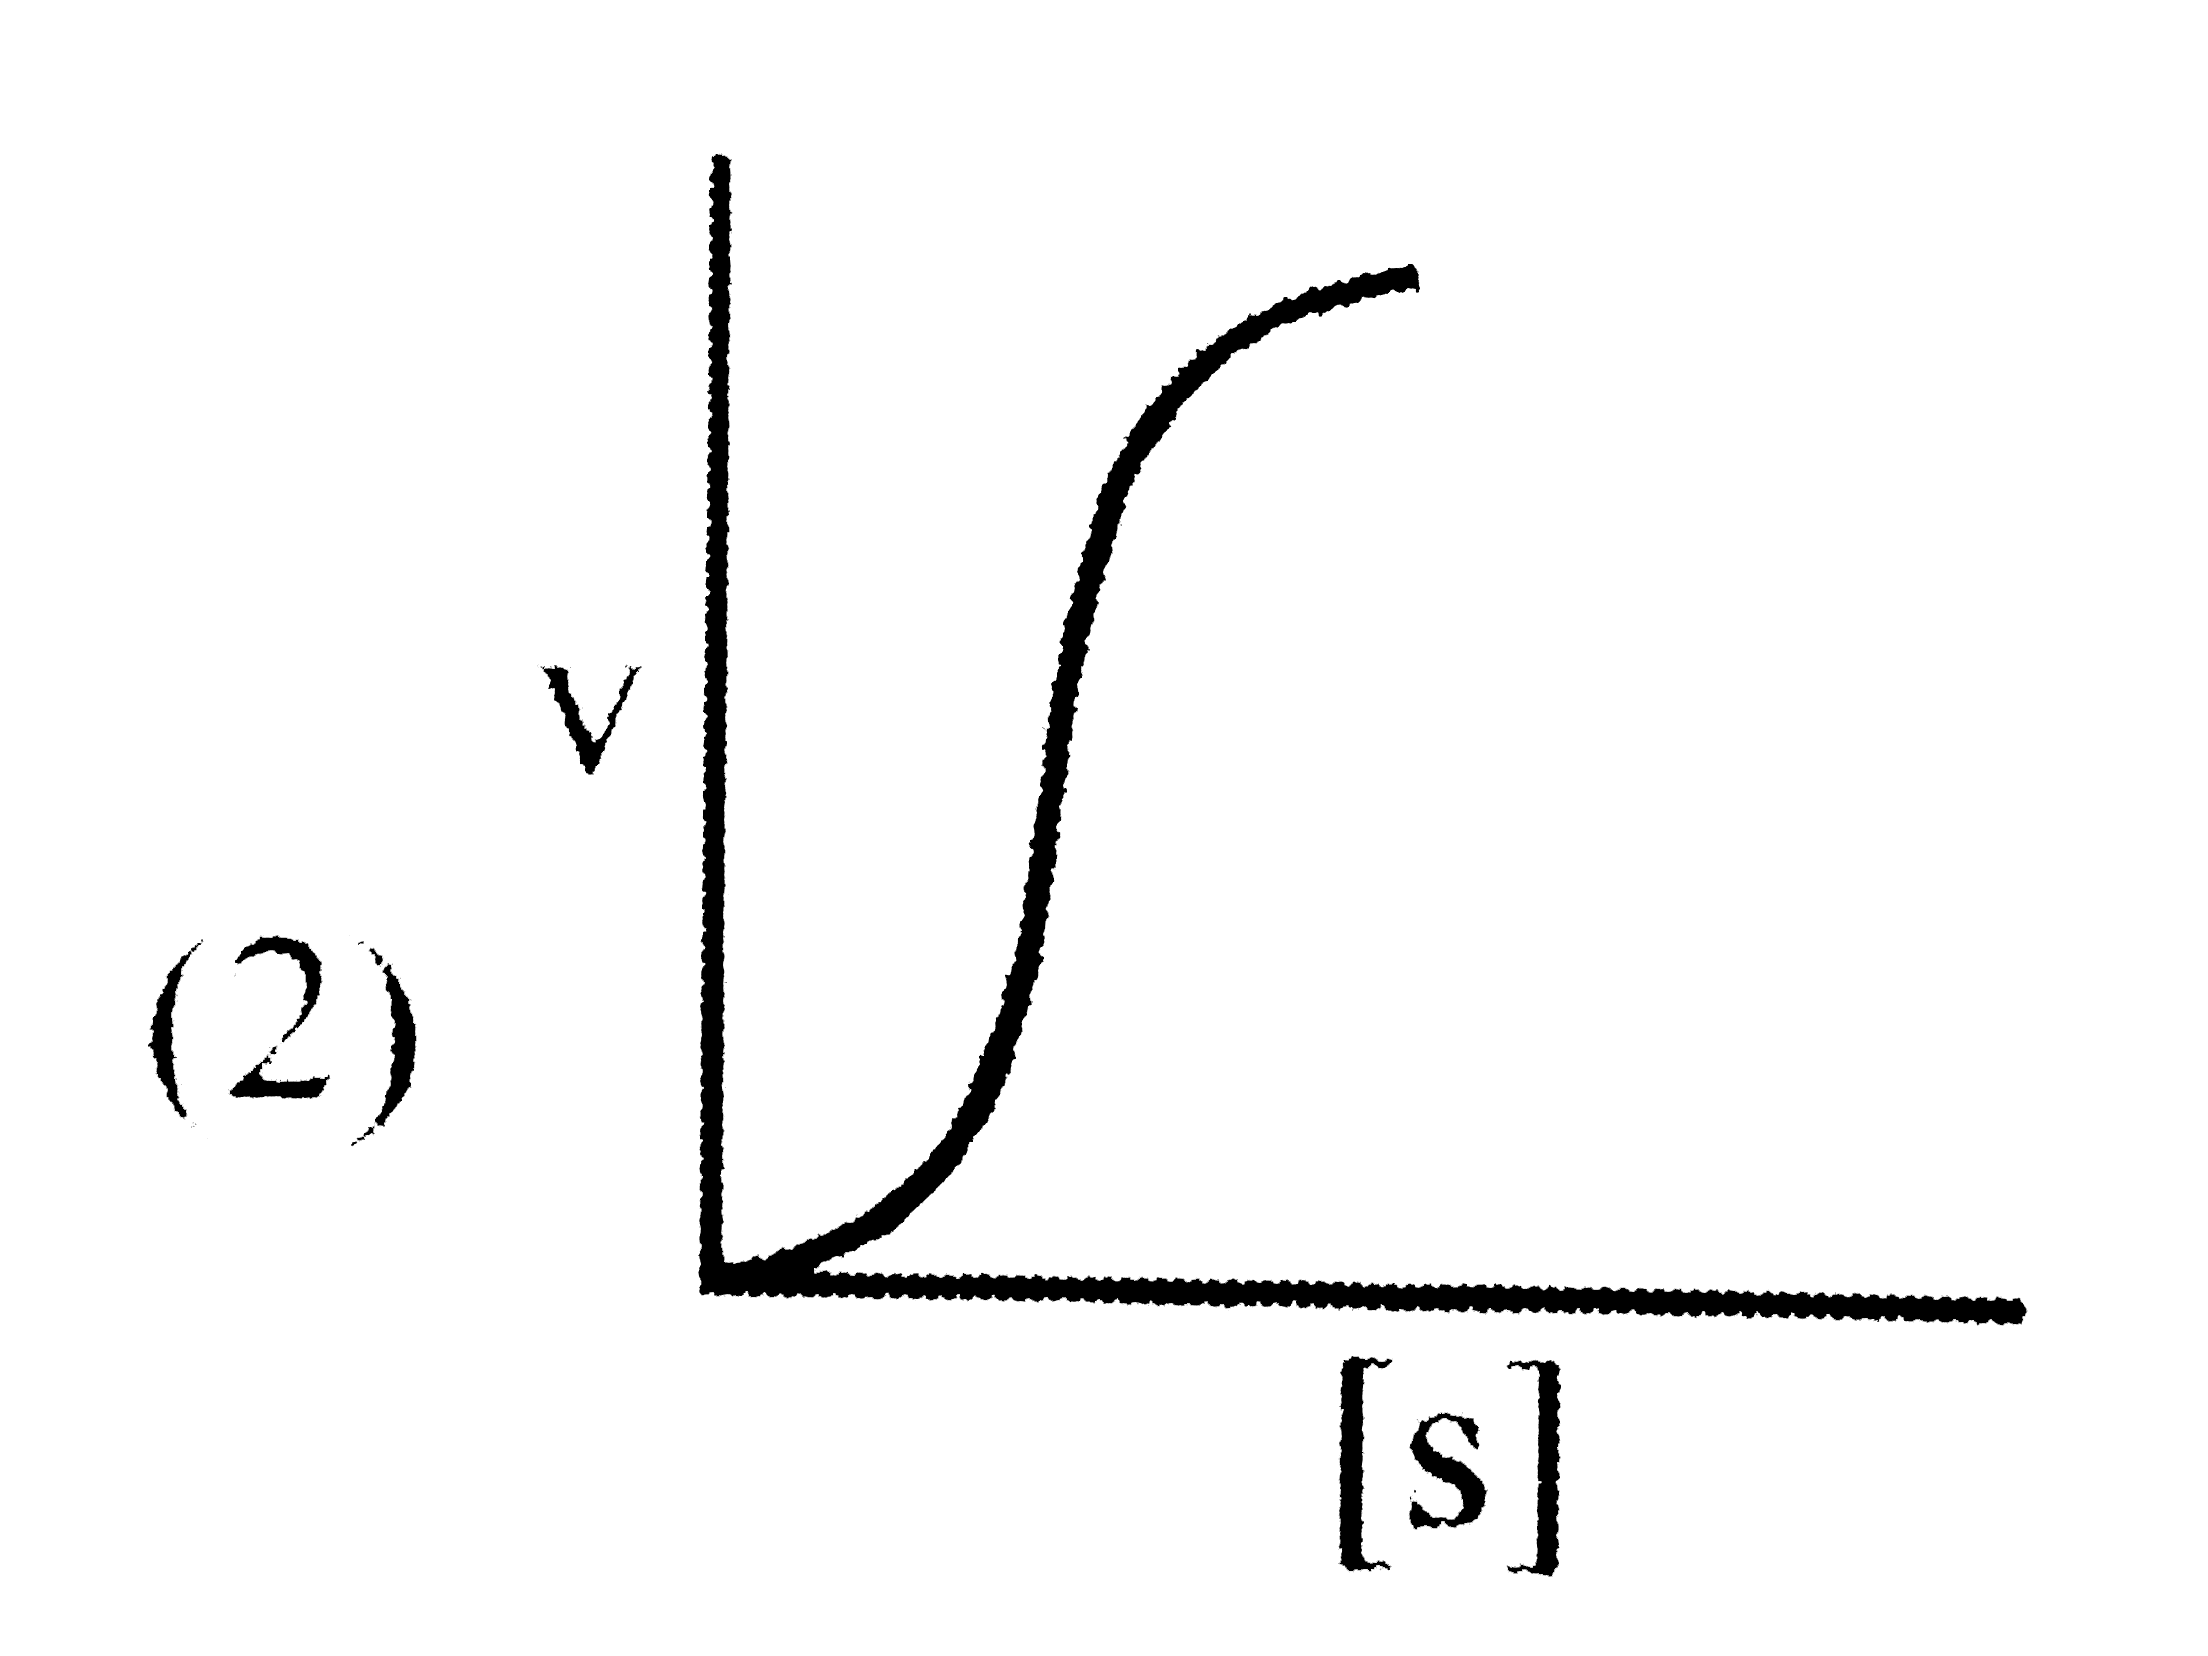
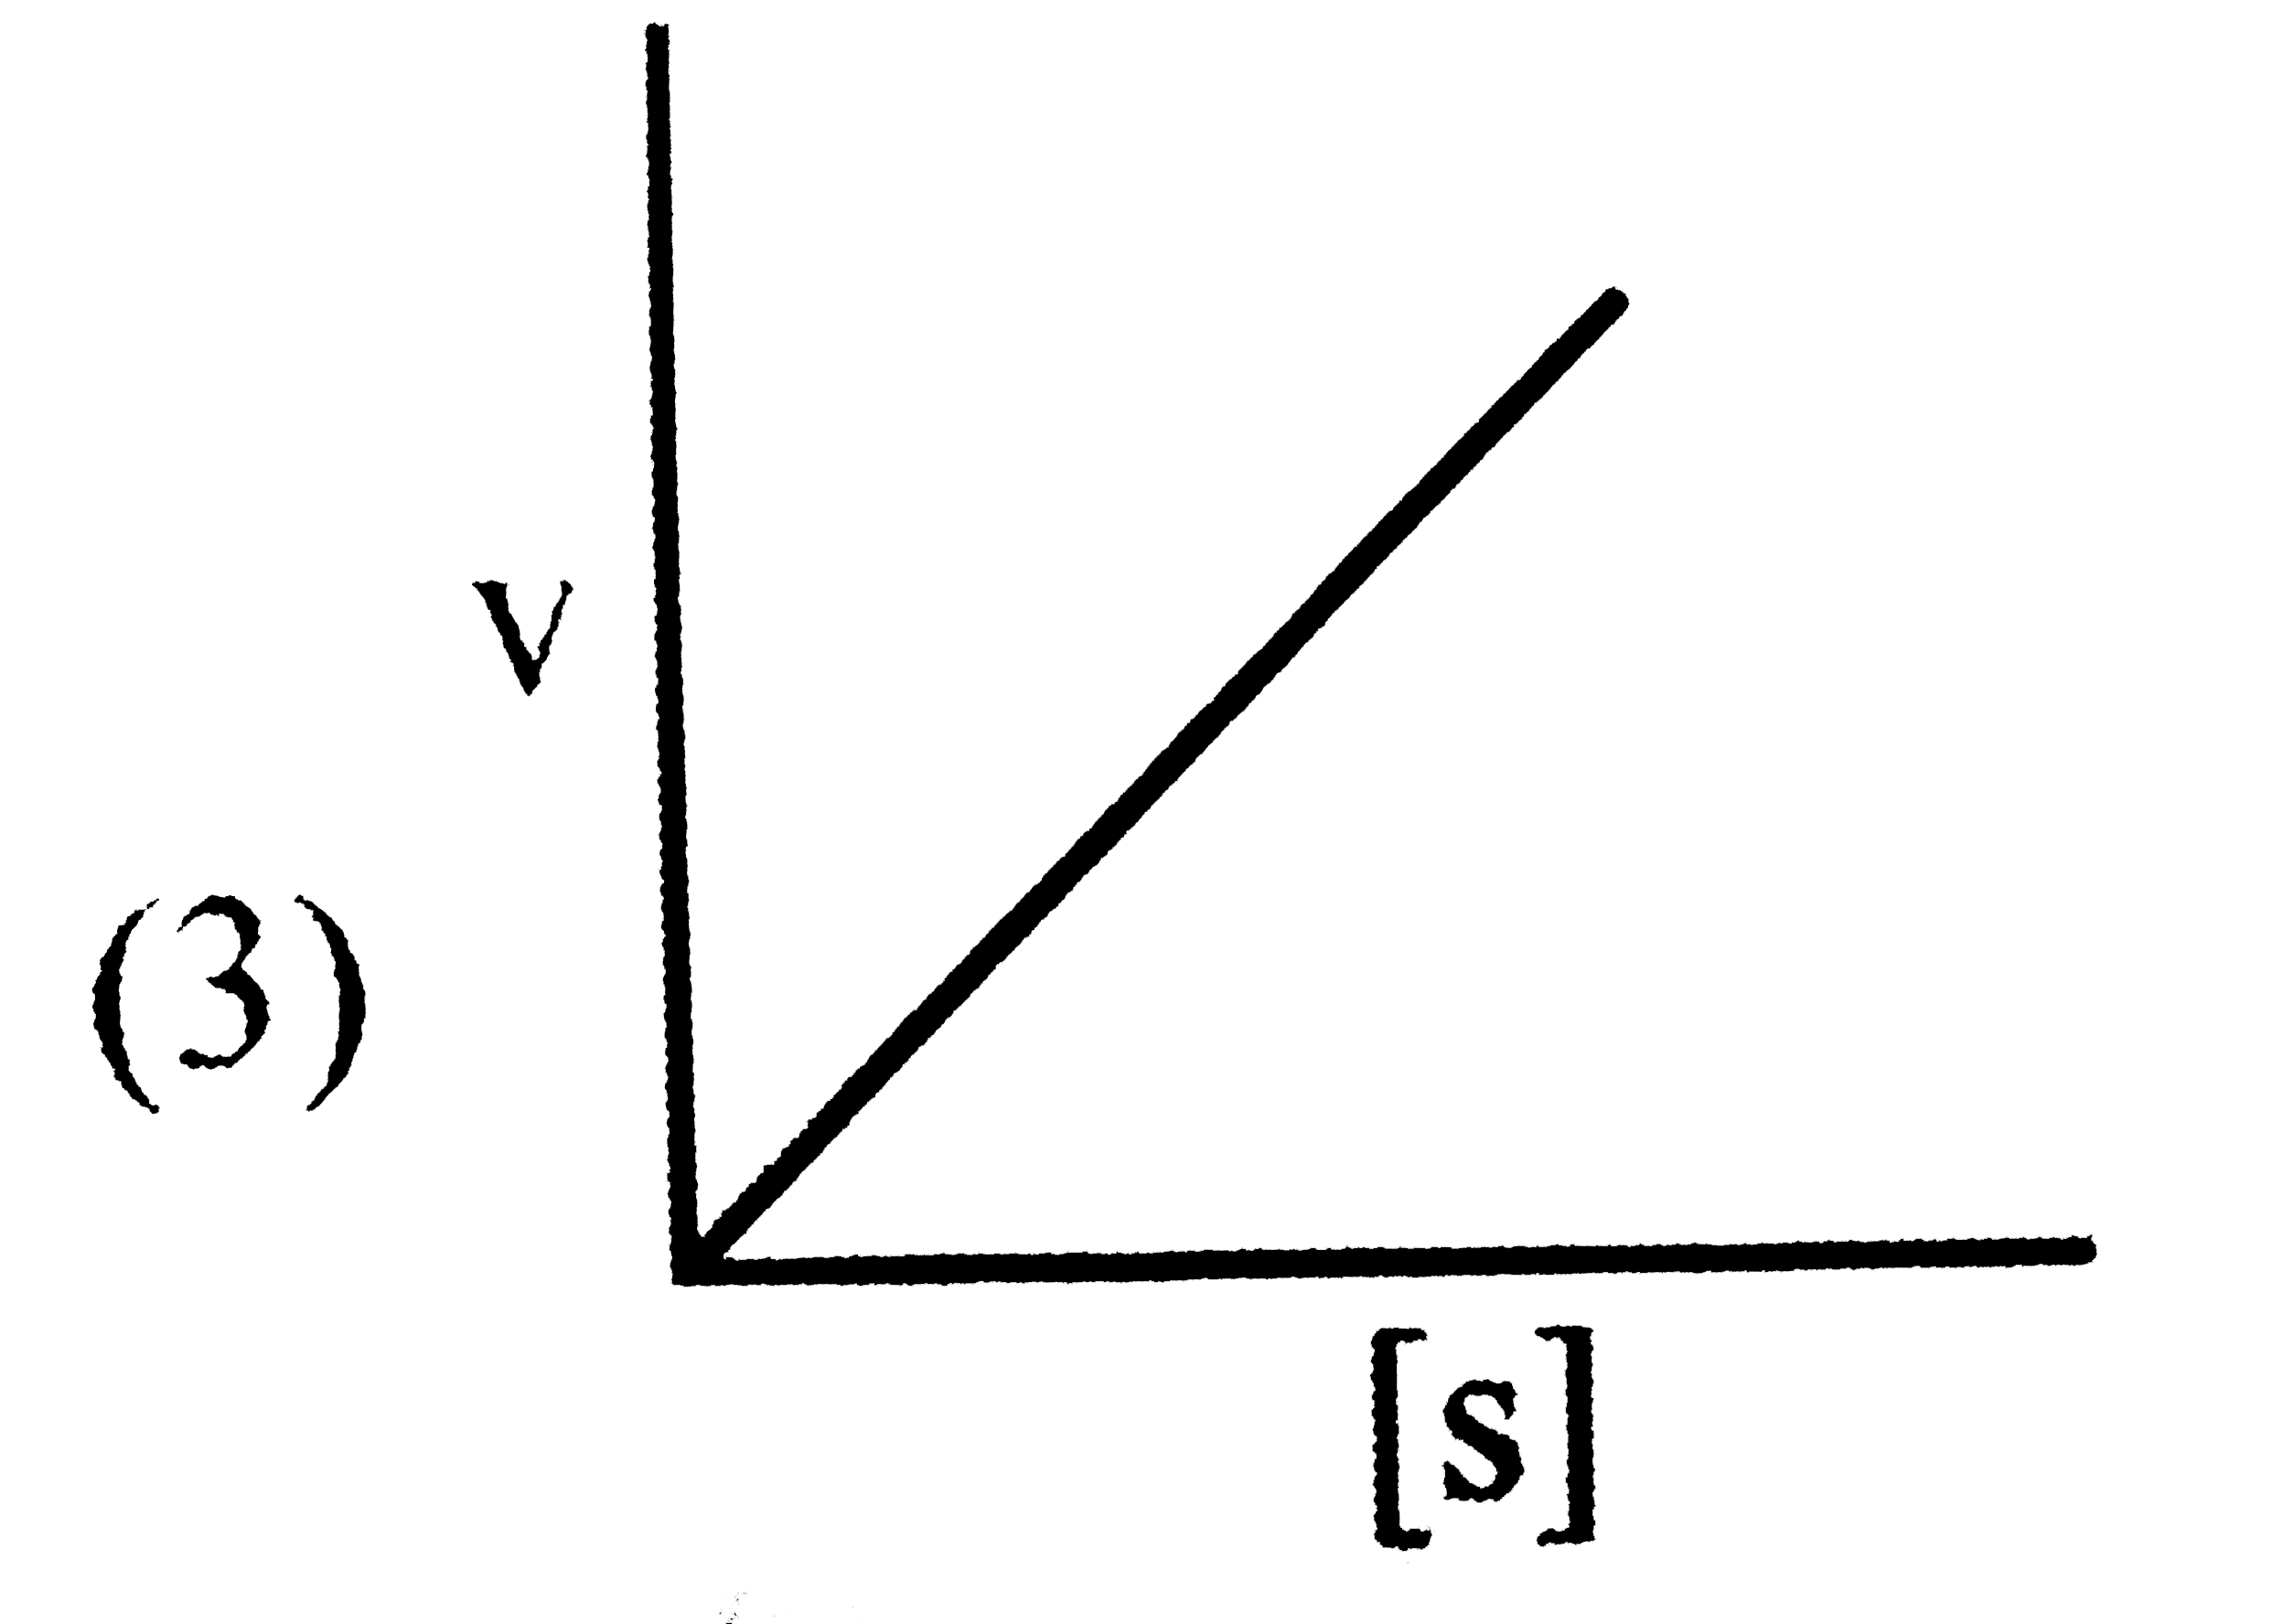
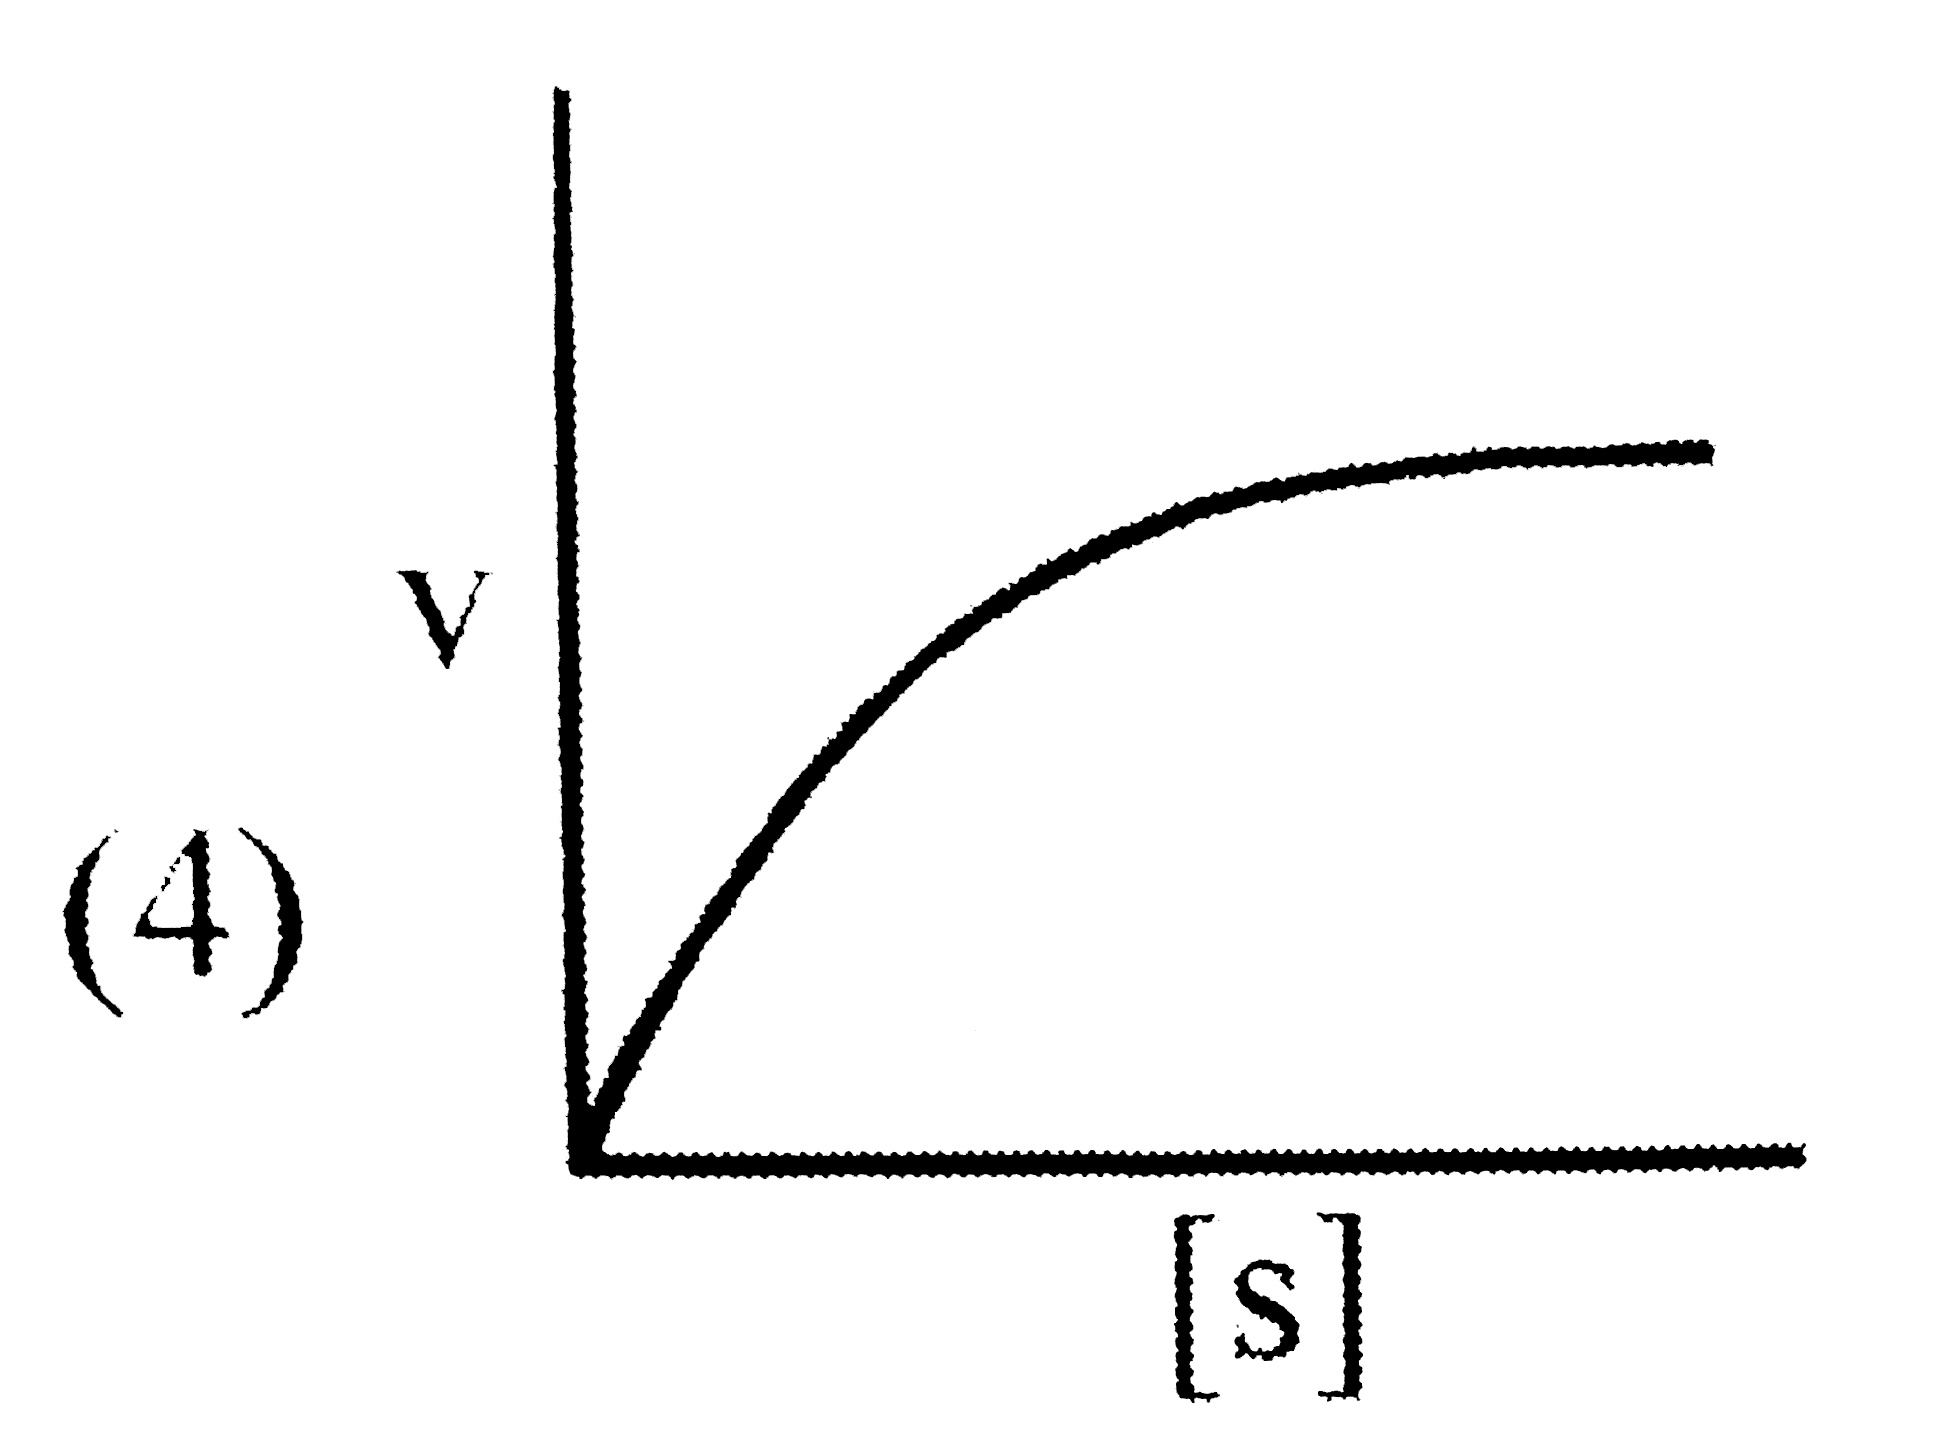
The correct Answer is:D
Step by step video, text & image solution for Which one of the following graphs show the relationship between the rate of an enzymatic activity and substrate concentration (s) ? by Biology experts to help you in doubts & scoring excellent marks in Class 12 exams.
Updated on:21/07/2023Similar Questions
The following graph shows the relationship between subtrate concentration and rate of enzymatic reaction. What is the effect of subtrate concentration on rate of reaction ? And identify A.
View SolutionThe given graph is showing the relationship between the rate of enzyme reaction and concentration of substrate. At concentration of substrate greater than X, the
View SolutionHow does the enzymatic reactions change with substrate concentrates?
View SolutionThe given curve shows enzymatic activity with relation to three conditions (pH, temperature & substrate concentration) What do the two axes (x & y) represent?
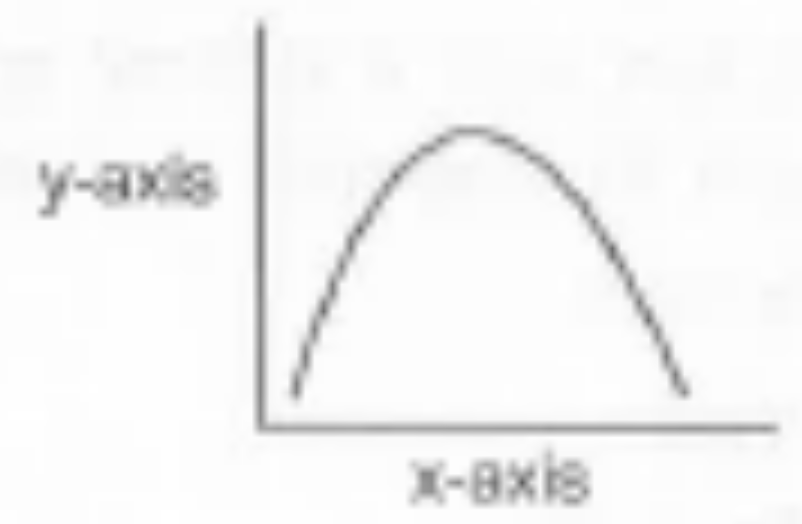
View SolutionWhich graphs shows the correct description of effect of pH on the enzymatic activity
View SolutionFollowing graphs show the effect of change in concentration of substrate on enzyme activity: In which of the above curve,the enzyme shows maximum substrate affinity
View SolutionThe given graph is showing the relationship between the rate of enzyme reaction and concentration of substrate. At concentration of substrate greater than X, the
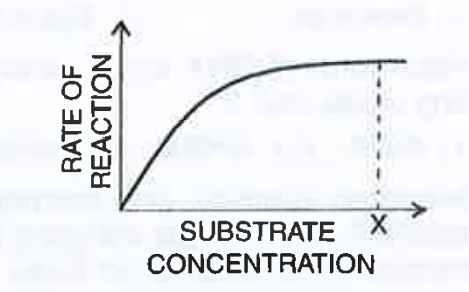
View SolutionThe given graph is showing the relationship between the rate of enzyme reaction and concentration of substrate. At concentration of substrate greater than X, the
View Solution
