Sketch the vairation of electric potential on the x-axis with respect to x for x=−∞ to x=+∞ in the following cases

Step by step video & image solution for Sketch the vairation of electric potential on the x-axis with respect to x for x= - infty to x = + infty in the following cases by Physics experts to help you in doubts & scoring excellent marks in Class 12 exams.
Updated on:21/07/2023Topper's Solved these Questions
- ELECTROSTATIC POTENTIAL AND CAPACITORSBOOK - DC PANDEY ENGLISHCHAPTER - ELECTROSTATIC POTENTIAL AND CAPACITORSEXERCISE - Check point 2.1
15 Videos
- ELECTROSTATIC POTENTIAL AND CAPACITORSBOOK - DC PANDEY ENGLISHCHAPTER - ELECTROSTATIC POTENTIAL AND CAPACITORSEXERCISE - Check point 2.2
15 Videos
- ELECTROMAGNETIC WAVESBOOK - DC PANDEY ENGLISHCHAPTER - ELECTROMAGNETIC WAVESEXERCISE - Sec C
22 Videos
- ELECTROSTATICSBOOK - DC PANDEY ENGLISHCHAPTER - ELECTROSTATICSEXERCISE - Medical entrances gallery
37 Videos
Similar Questions
Sketch the region for y=sin(x−[x]).
View SolutionThe variation of electric potential for an electric field directed parallel to the x - axis is shown in (Fig. 3.110). Draw the variation of electric field strength with the x- axis.
 .
.
View SolutionSketch the curve y=x3−4x.
View SolutionThe potential in the electric field varies as V=−ax2+b with respect to x - coordinate, where a and b are constants. Find the charge density ρ(x) in a space.
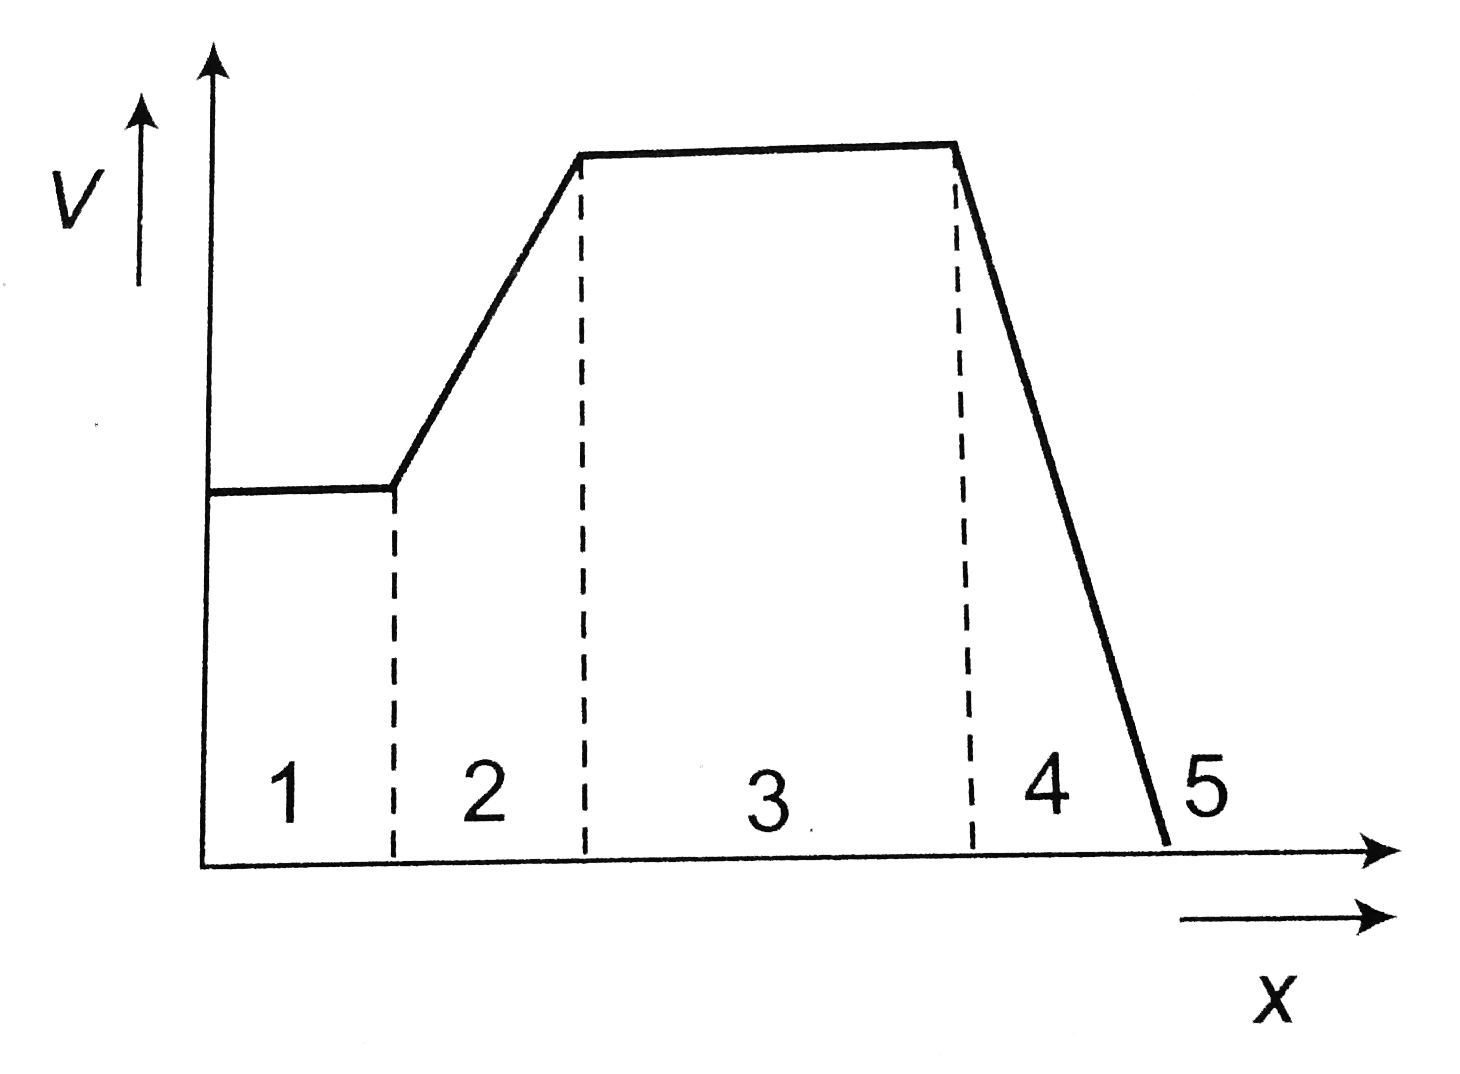
View SolutionThe figure gives the electric potential V as a function of distance through five regions on x-axis. Which of the following is true for the electric E in these regions ?

View SolutionIf on the x - axis electric potential decreases uniform from 60 V to 20 V between x = -2 m to x = +2 m then the magnitude of electric field at the origin
View SolutionSketch the graph of f(x)=1x−2.
View SolutionAn interference is observed due to two coherent sources S1 placed at origin and S2 placed at (0,3λ,0). Here, lambda is the wavelength of the sources. A detector D is moved along the positive x-axis. Find x-coordinates on the x-axis (excluding x=0andx=∞) where maximum intensity is observed.
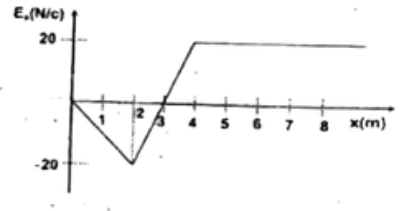
View SolutionA graph of the x-component of the electric field as a function of x in a region of space is shown in the figure.
They y and z-components of the electric field are zero in this region. The electric potential at the origin is 10 V.

The greatest positive value of electric potential for points of the x-axis for which 0≤x≤6m is
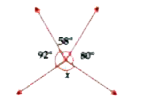
View SolutionCalculate the value of x in each of the following sketches:

View Solution
