Draw graphs to show the variation of amplitude with driving frequency of a forced harmonic oscillator under (i) zero damping, (ii) low damping and (iii) high damping
Step by step video & image solution for Draw graphs to show the variation of amplitude with driving frequency of a forced harmonic oscillator under (i) zero damping, (ii) low damping and (iii) high damping by Physics experts to help you in doubts & scoring excellent marks in Class 11 exams.
Updated on:21/07/2023Topper's Solved these Questions
- OSCILLATIONS BOOK - ICSECHAPTER - OSCILLATIONS EXERCISE - VERY SHORT ANSWER QUESTIONS
13 Videos
- OSCILLATIONS BOOK - ICSECHAPTER - OSCILLATIONS EXERCISE - SELECTED PROBLEMS (FROM THE CHARACTERISTIC OF SHM)
14 Videos
- OSCILLATIONS BOOK - ICSECHAPTER - OSCILLATIONS EXERCISE - LONG ANSWER QUESTIONS
3 Videos
- MOTION IN FLUIDS BOOK - ICSECHAPTER - MOTION IN FLUIDS EXERCISE - SELECTED PROBLEMS (FROM POISEUILLE.S FORMULA)
19 Videos
- PROPERTIES OF MATTERBOOK - ICSECHAPTER - PROPERTIES OF MATTEREXERCISE - MODULE 4 ( TEMPERATURE ) UNSOLVED PROBLEMS
12 Videos
Similar Questions
Knowledge Check
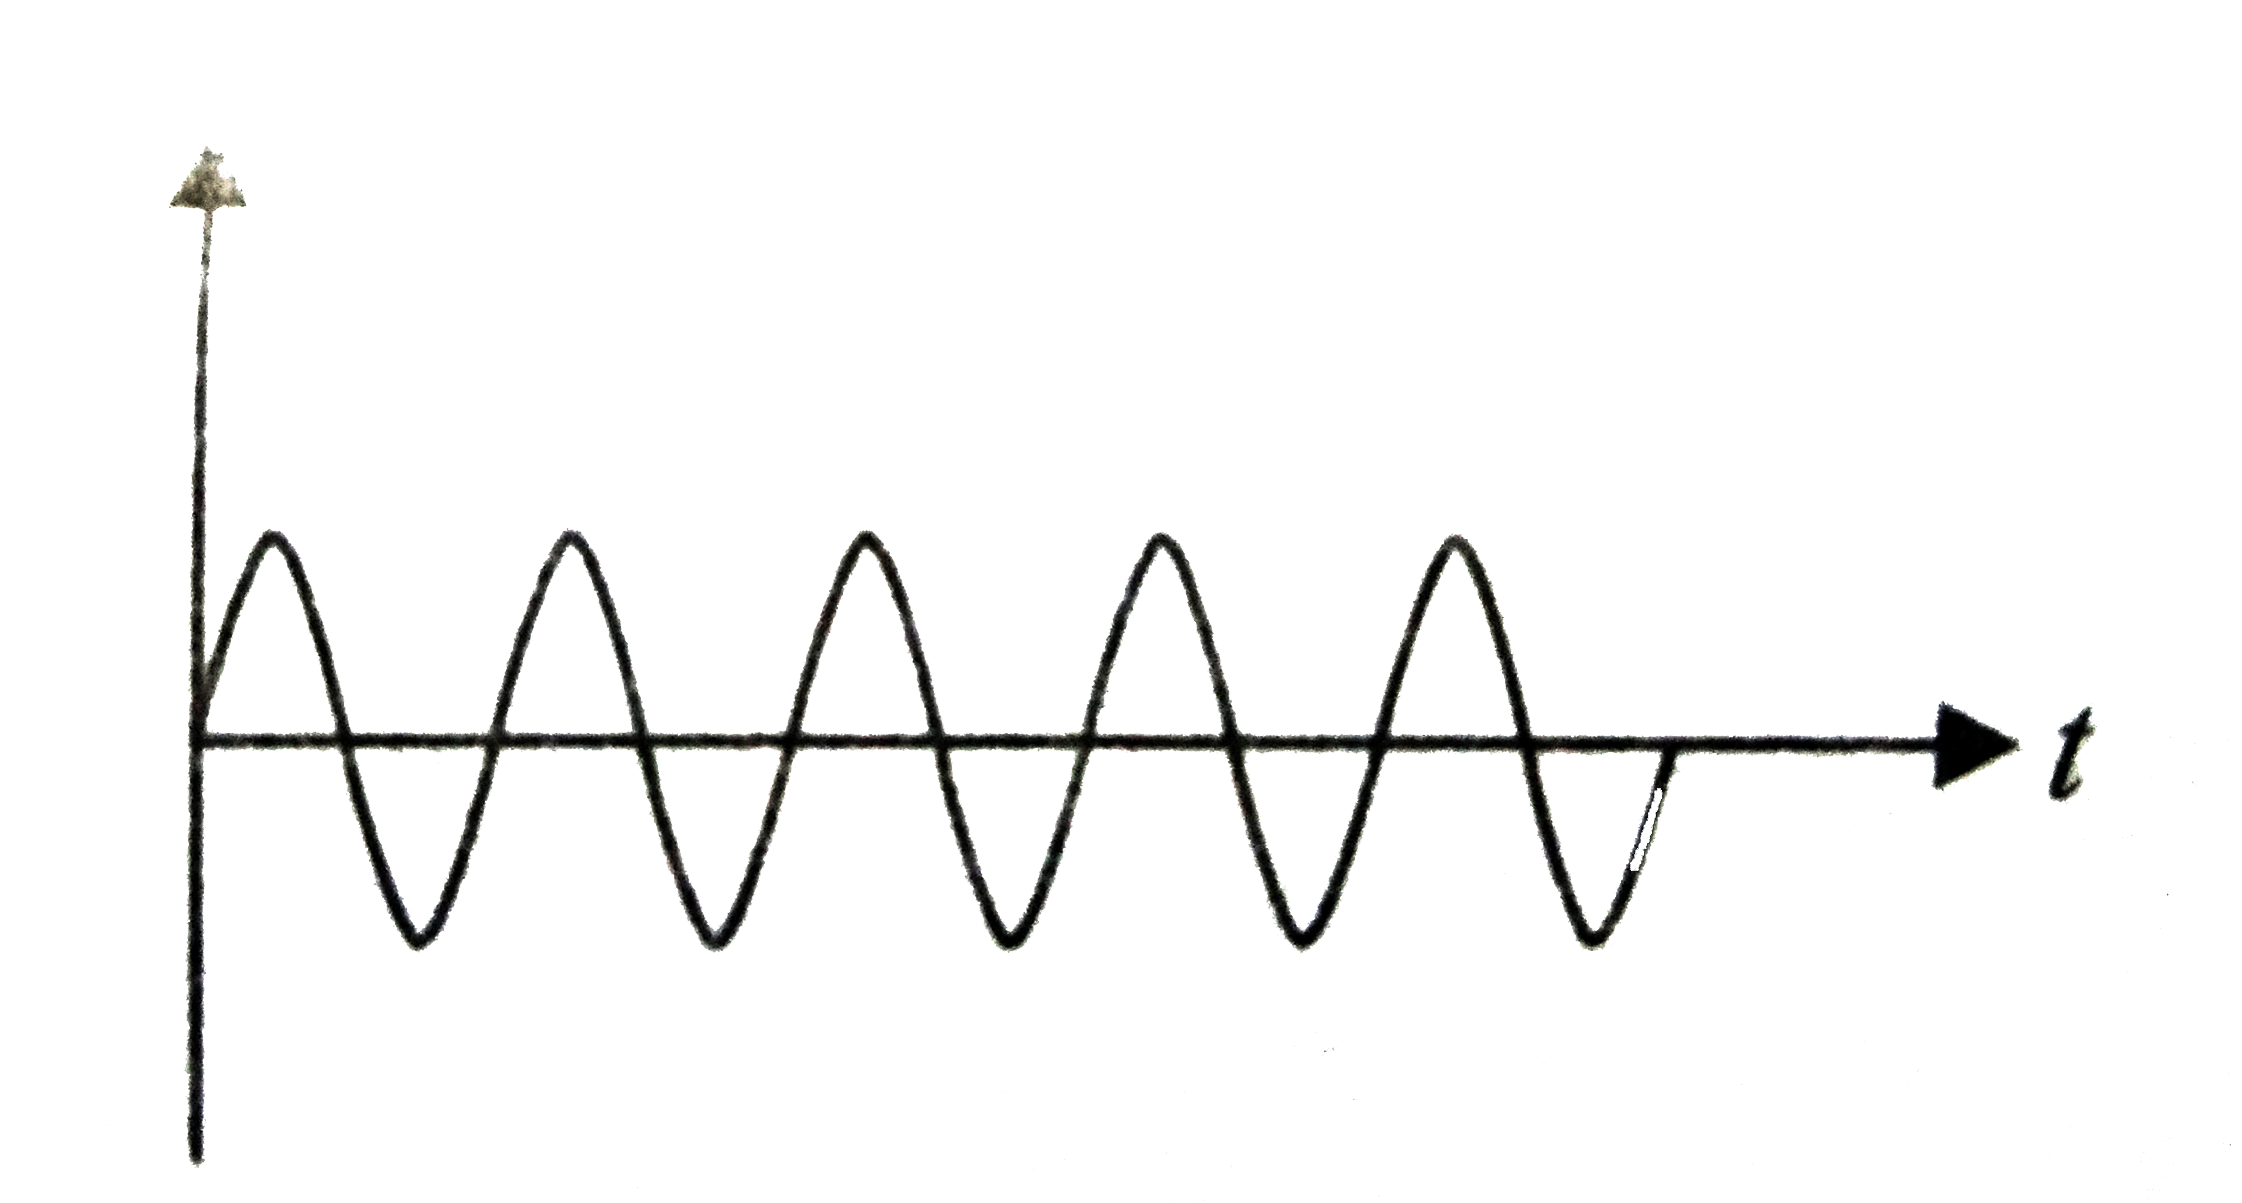
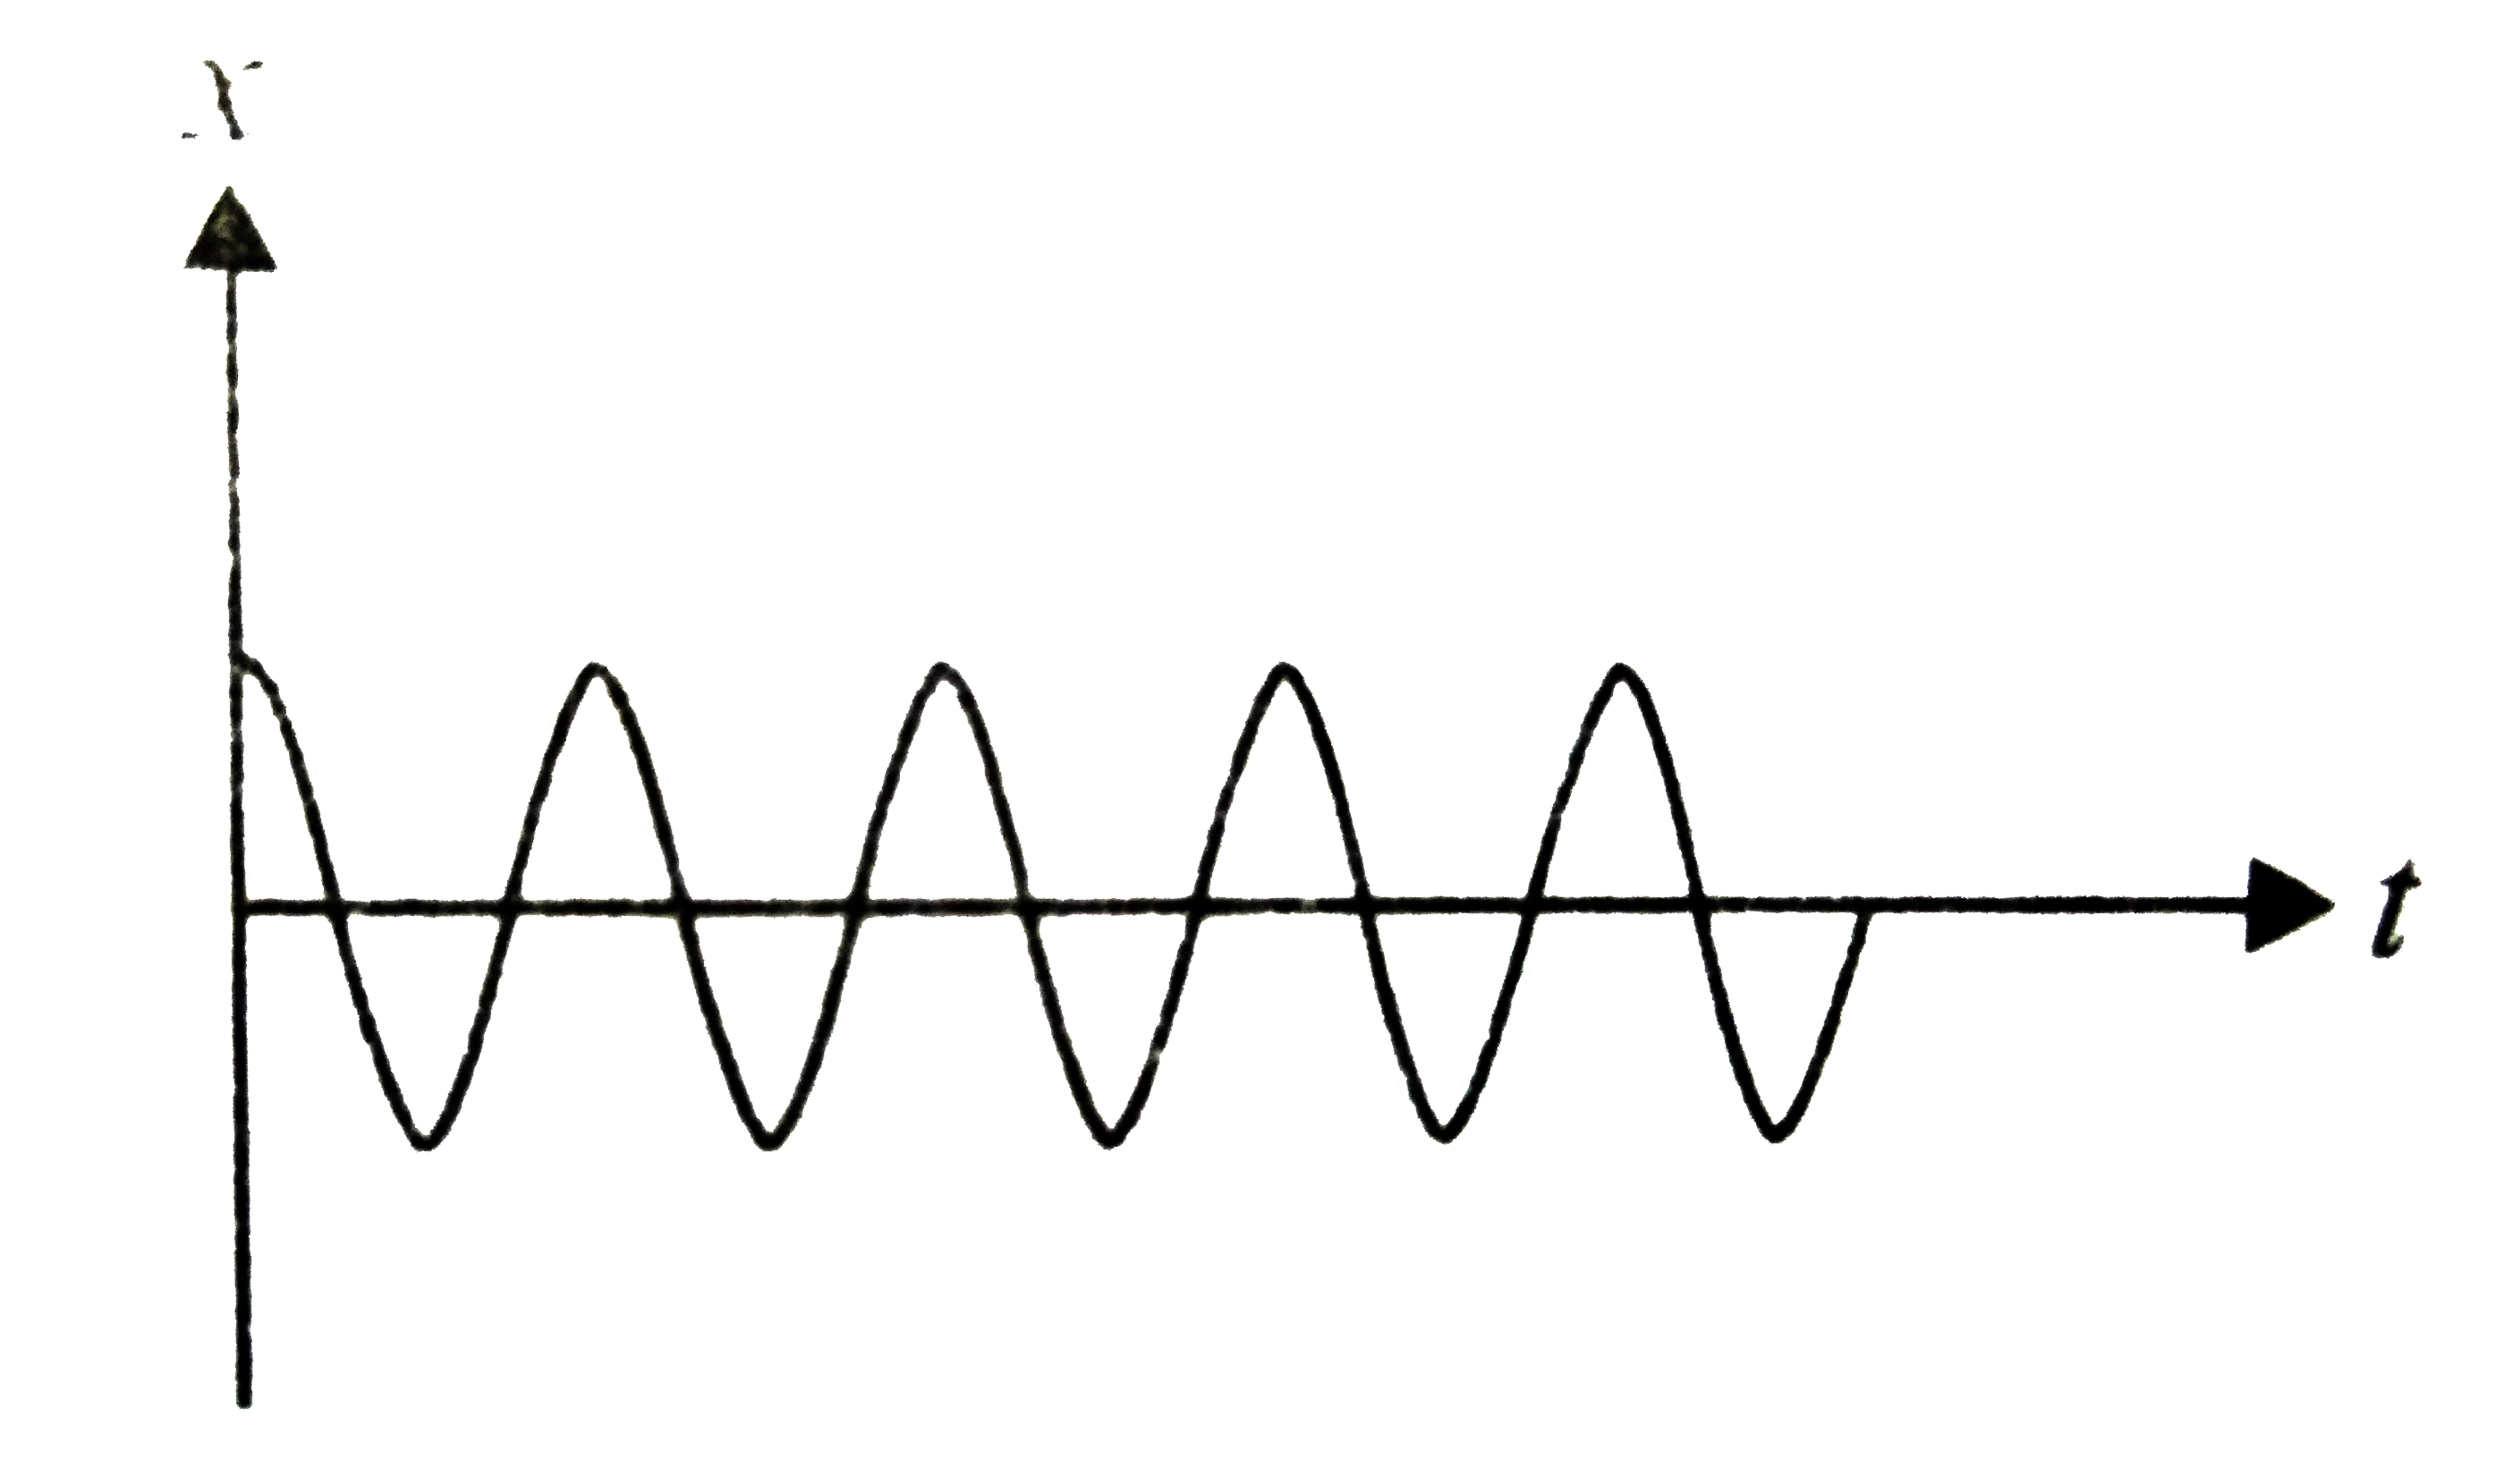
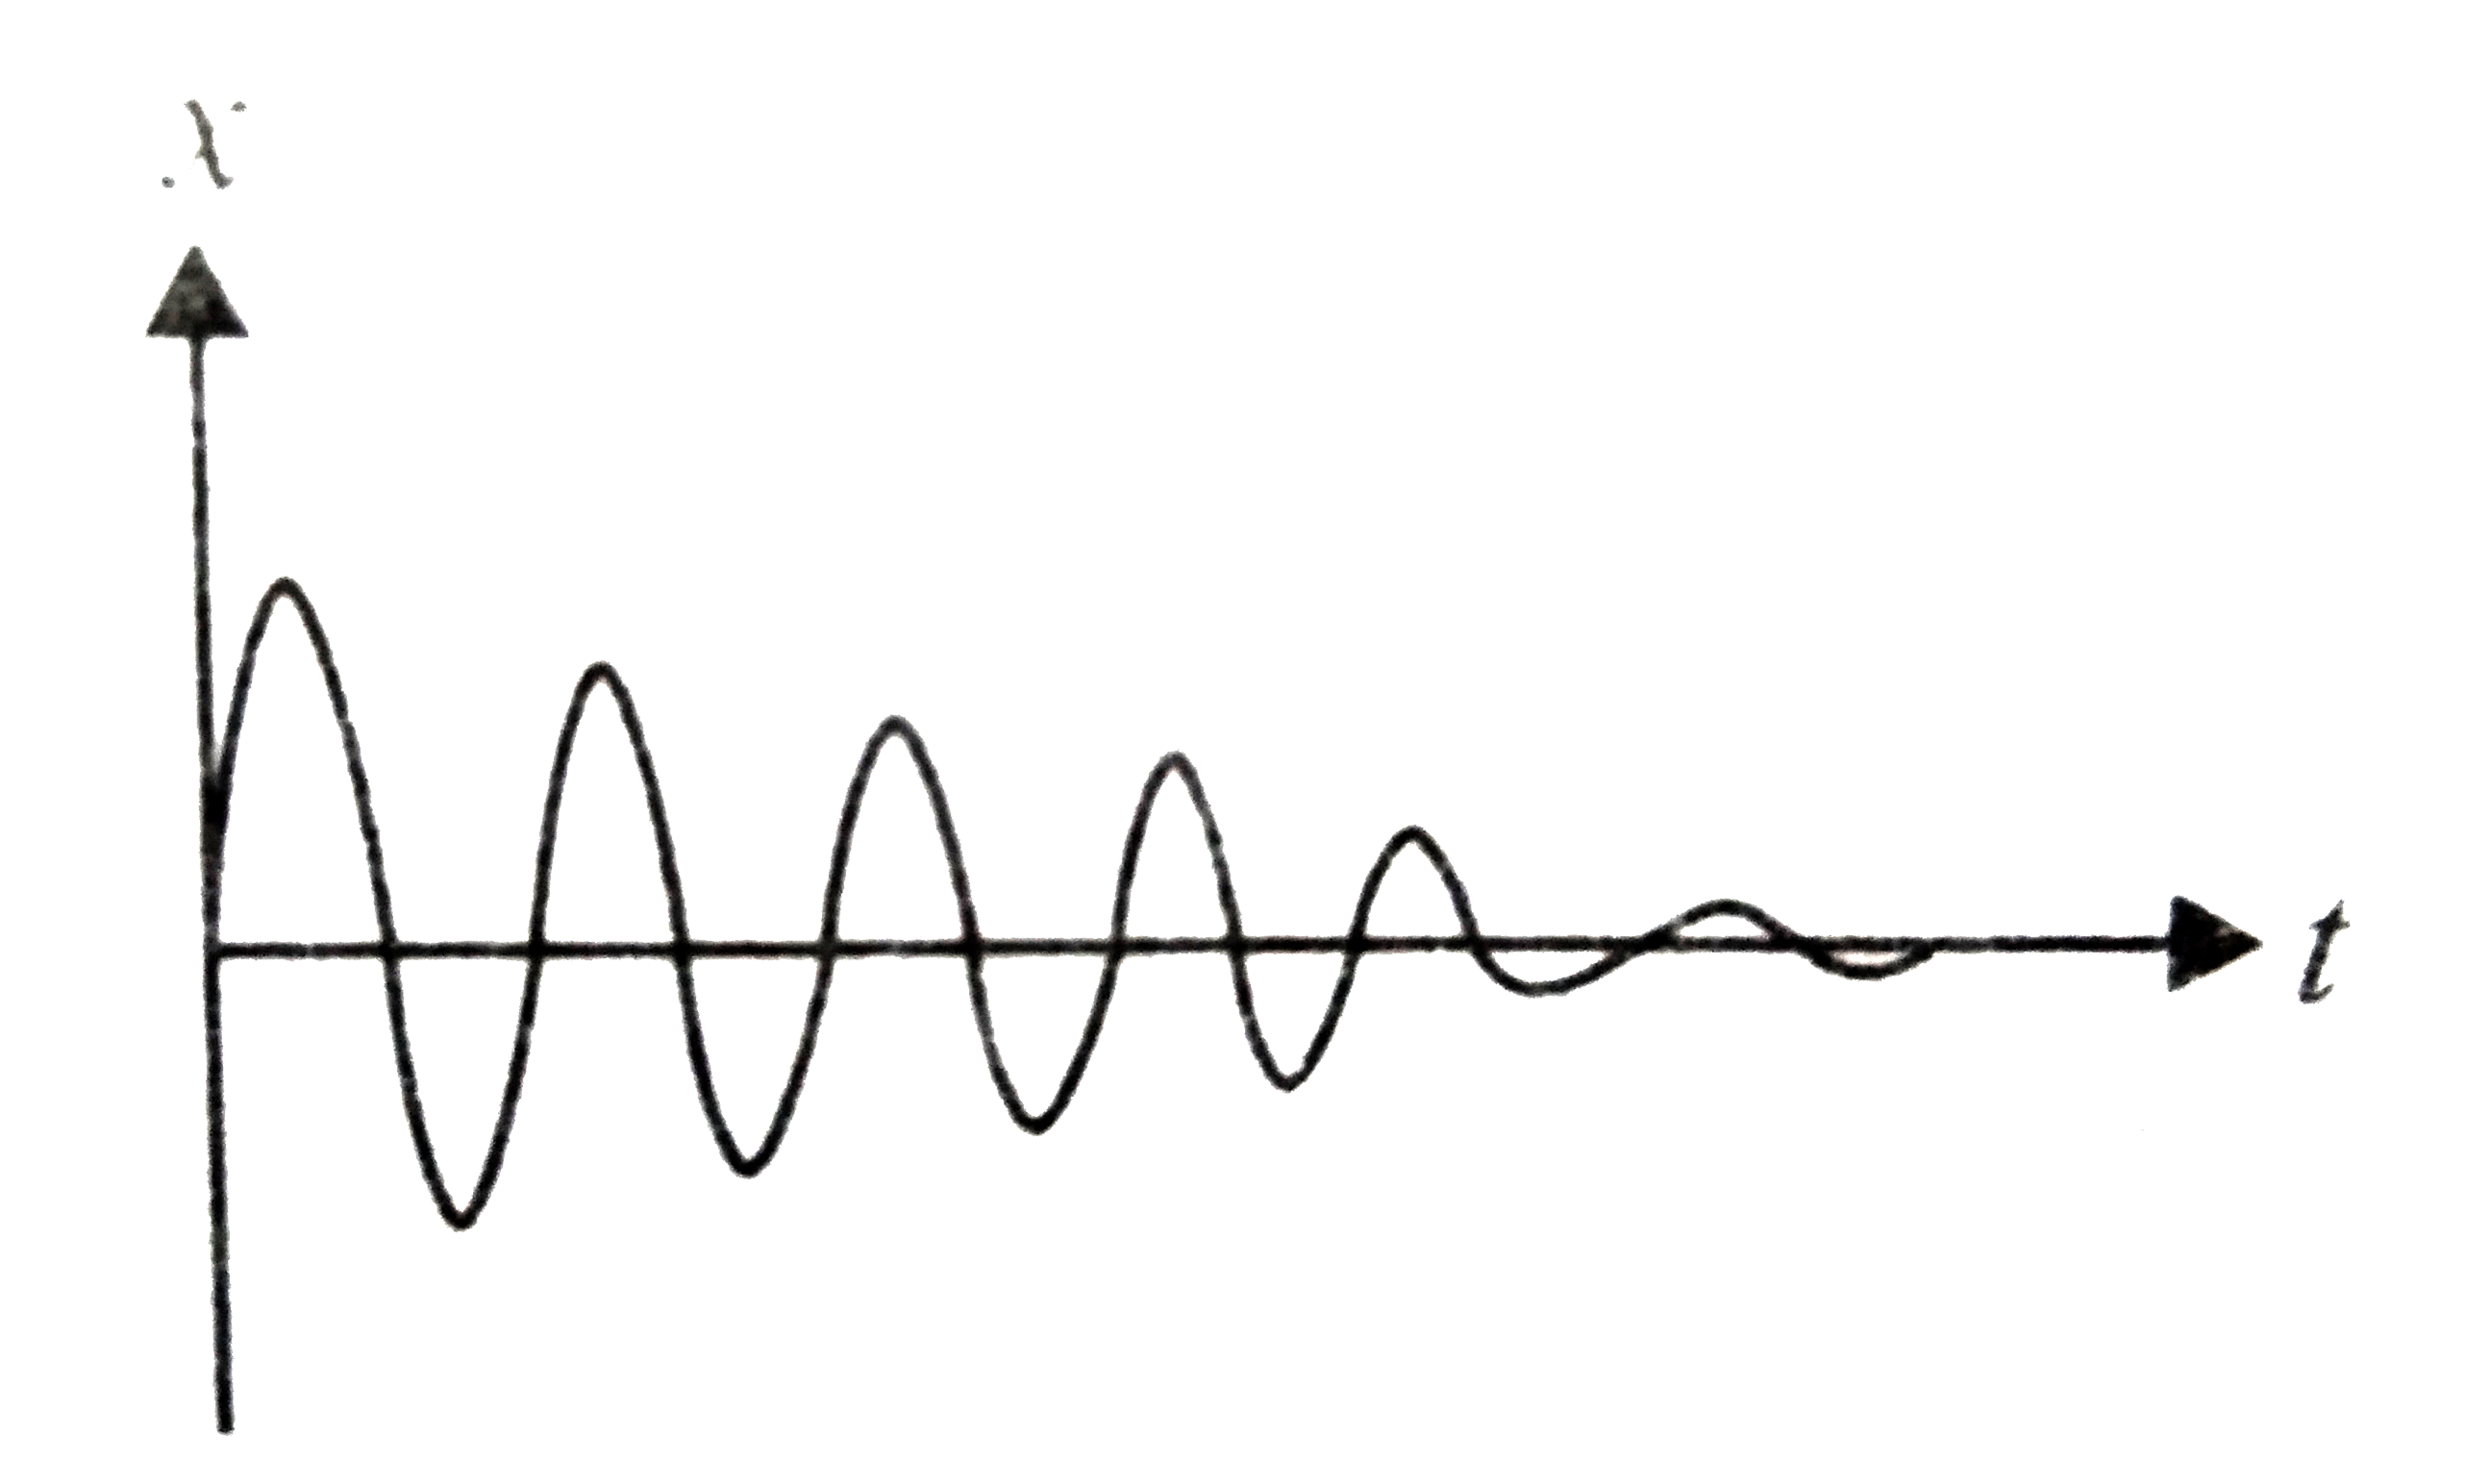
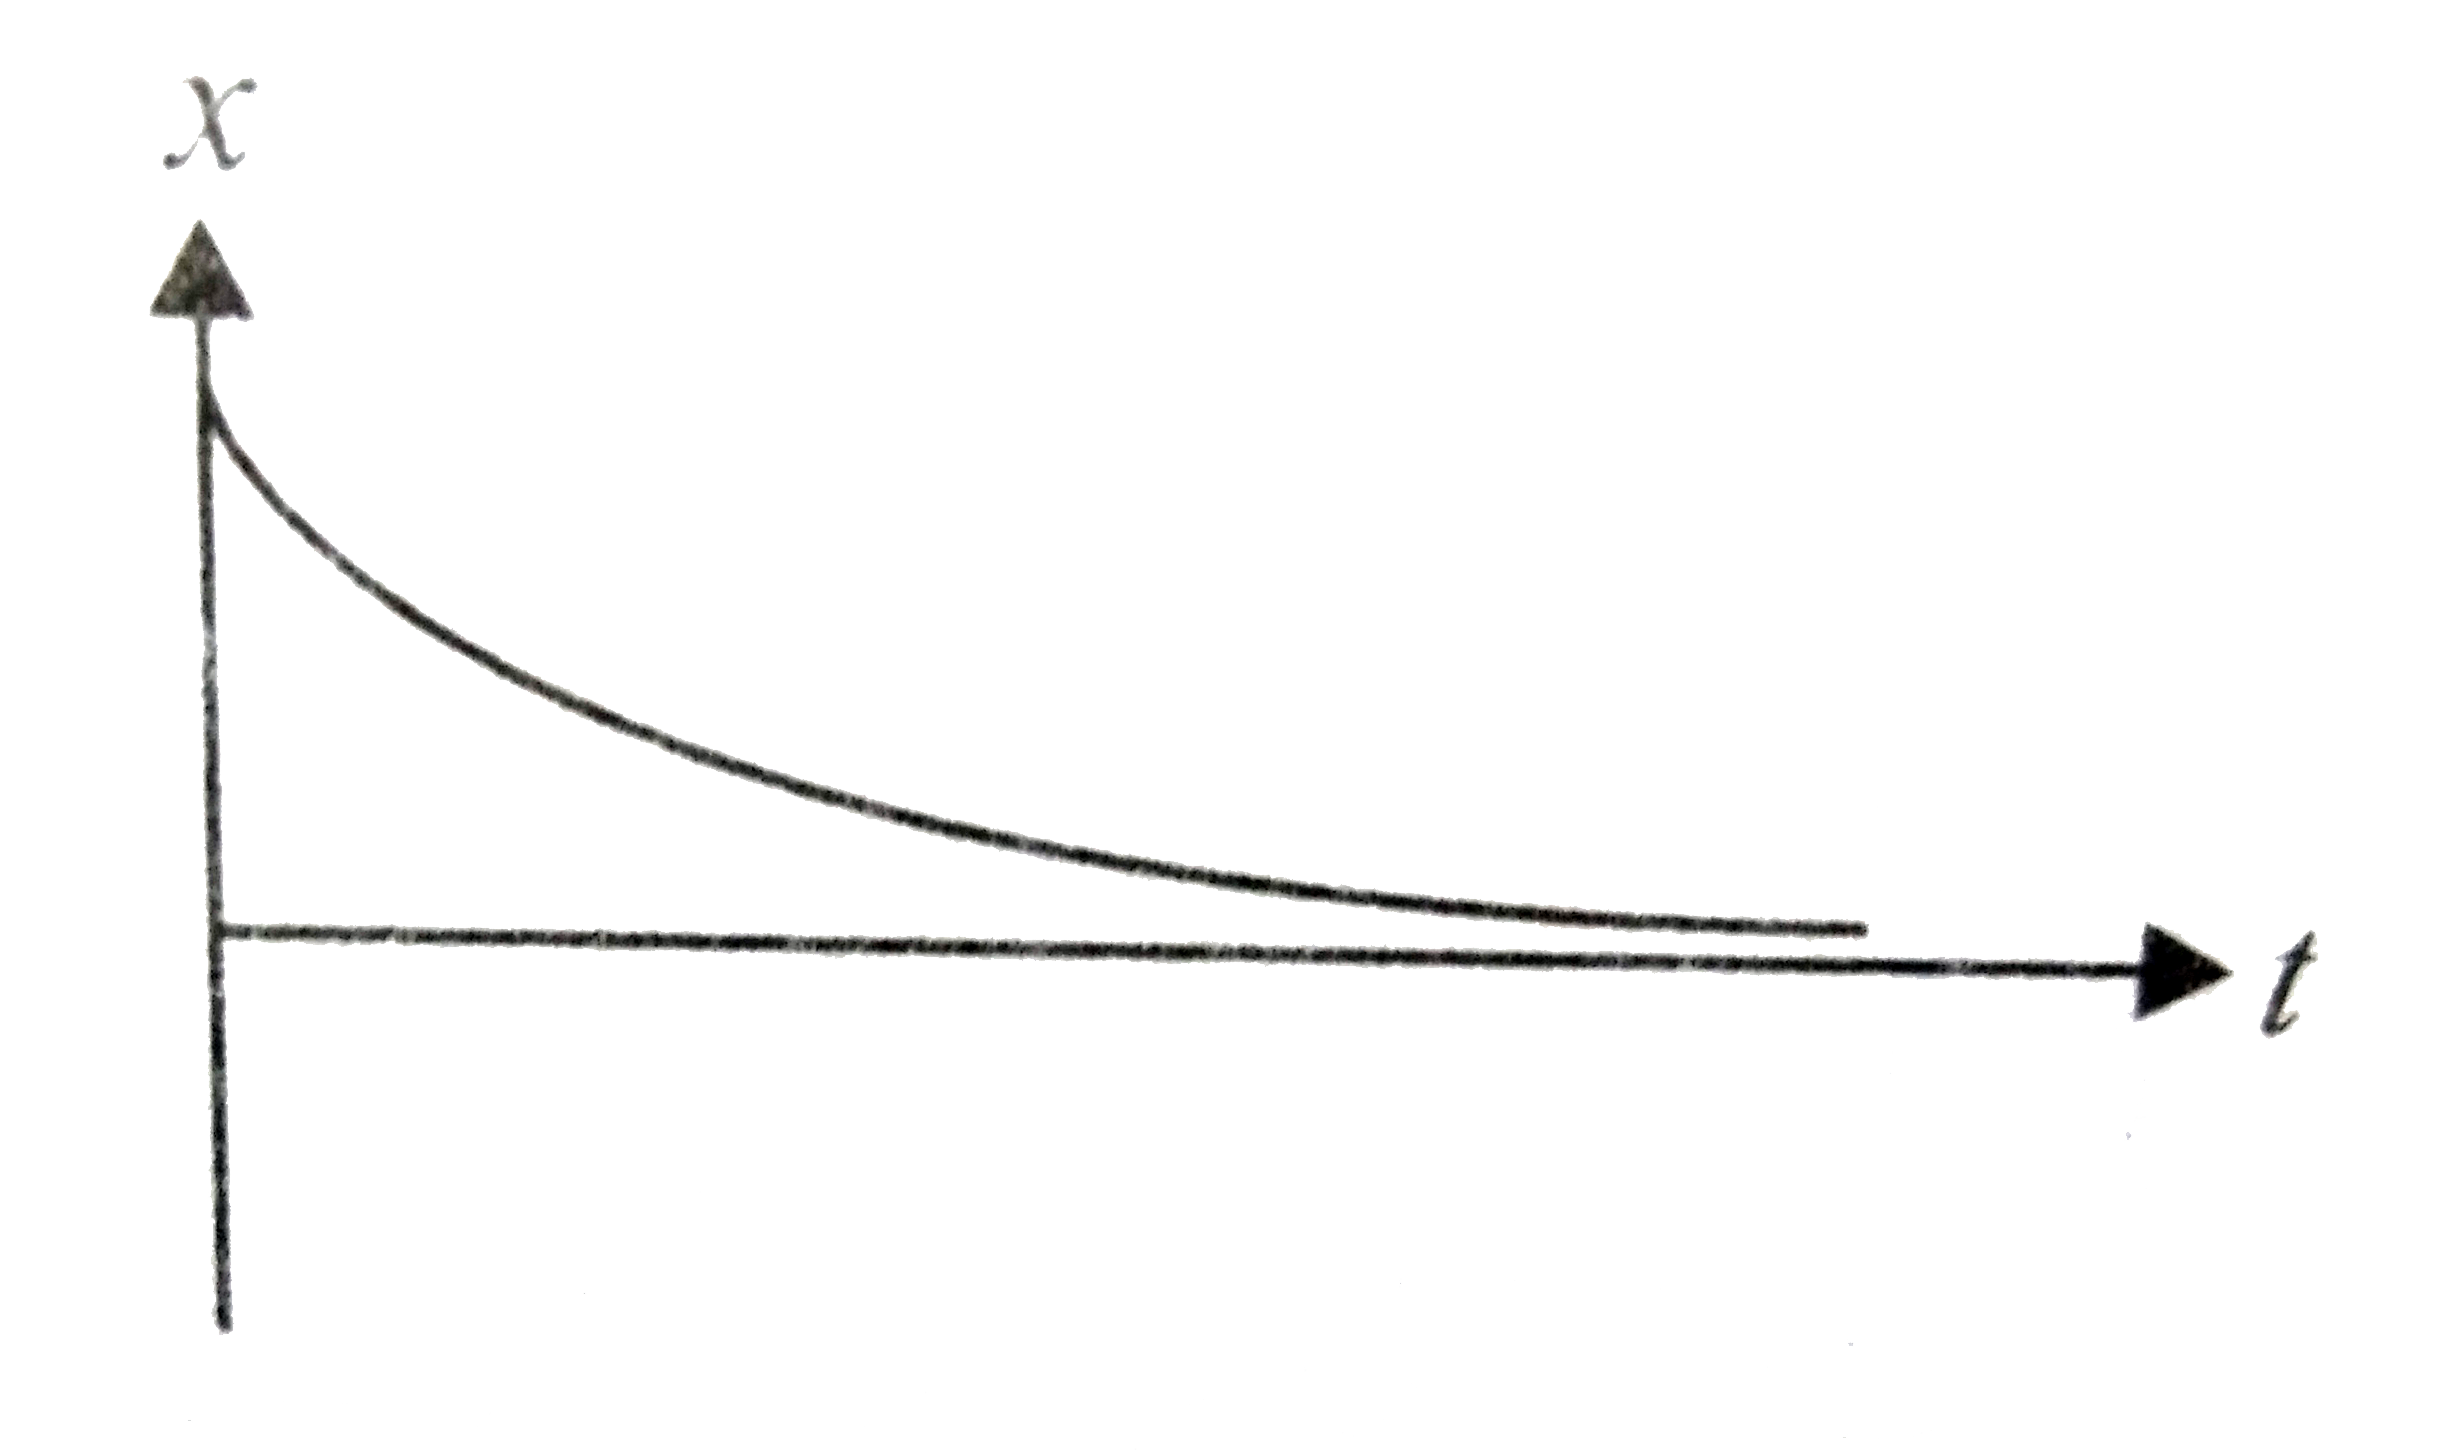
Which of the following displacement-time graphs represent damped harmonic oscillation?
A B
B C
C D
D
What is the photoelectric effect? With the help of suitable graph show the variation of photocurrent with (i) the intensity of incident radiation. (ii) the voltage applied between cathode and anode. (iii) the frequency of incident radiation.
View SolutionPlot a graph showing the variation of stopping potential with the frequency of incident radiation for two different photosensitive having work functions W1andW2(W1>W2) . On what factors does the (i) slope and (ii) intercept of the lines depend ?
View Solution(a) Draw graphs showing the variations of inductive reactnace and capacitive reactance with frequency of the applied ac source .
(b) Draw the phasor diagram for a series RC circuit connected to an ac source.
(c ) An alternating voltage of 220 V is applied across a device X , a current of 0.25 A flows , which lag behind the applied voltage in phase by π2 radian . If the same voltage is applied across another device Y , the same current flows but now it is in phase with the applied voltage .
(i) Name the devices X and Y.
(ii) Calculate the current flowing in the circuit when the same voltage is applied across the series combination of X and Y.

View SolutionA vibrating toning fork is held at the mouth of (i) a closed pipe and (ii) an open pipe. Draw diagrams to show the formation of various modes. Obtain the frequency of the fundamental mode and
(ii) higher harmonics, in each case.
View SolutionSketch the graphs, showing the variation of stopping potential Vs with frequency v of the incident radiations for two photosensitive materials A and B having threshold frequencies v0>v'0 respectively.
(i) which of the two metals A or B has higher work function?
(ii) What information do you get from the slope of the graphs?
(iii) What does the value of the intercept of graph A on the potential axis represent?
View SolutionExplain the term temperature gradient. The two ends of a metal bar are maintained at two different consistant temperatures. On a single graph draw sketches to show the variation of temperature along the bar when its surface is (i) perfectly lagged and (ii) unlagged. Explain the shape of the two sketches.
View SolutionIn a series LCR circuit connected to an ac source of variable frequency and voltage v=vmsinωt, draw a plot showing the variation of current (I) with angular frequency (ω) for two different values of resistance R1andR2(R1>R2). Write the condition under which the phenomenon of resonance occurs. For which value of the resistance out of the two curves, a sharper resonance is produced ? Define Q-factor of the circuit and give its significance.
View Solution
