The current through the coil in figure (i) varies as shown in figure (ii). Which graph best shows the ammeter A reading as a function of time?

(a) 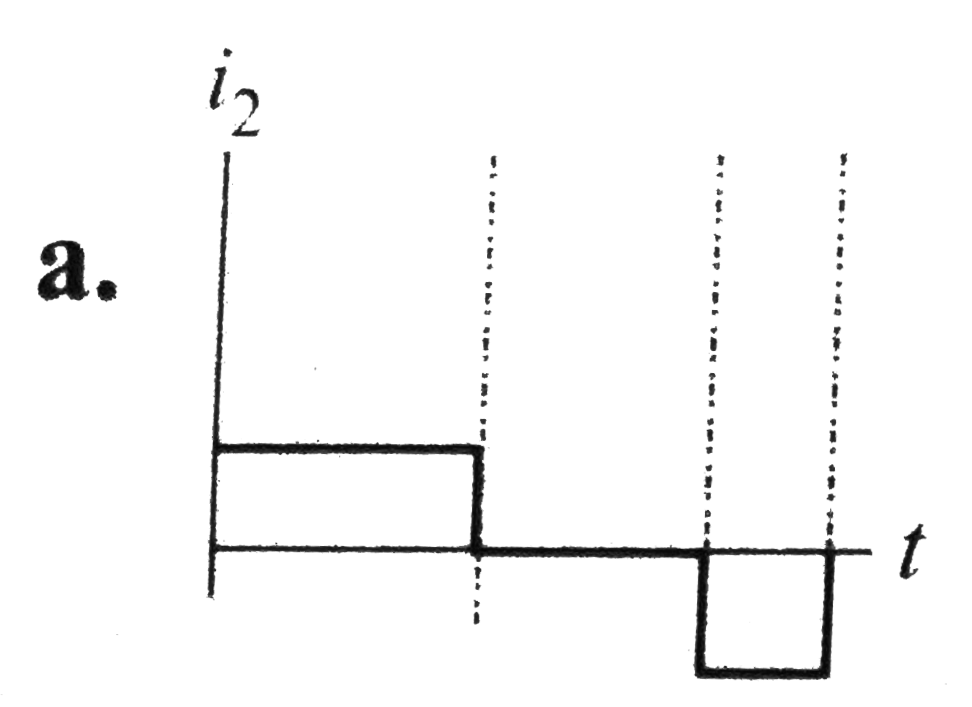
(b) 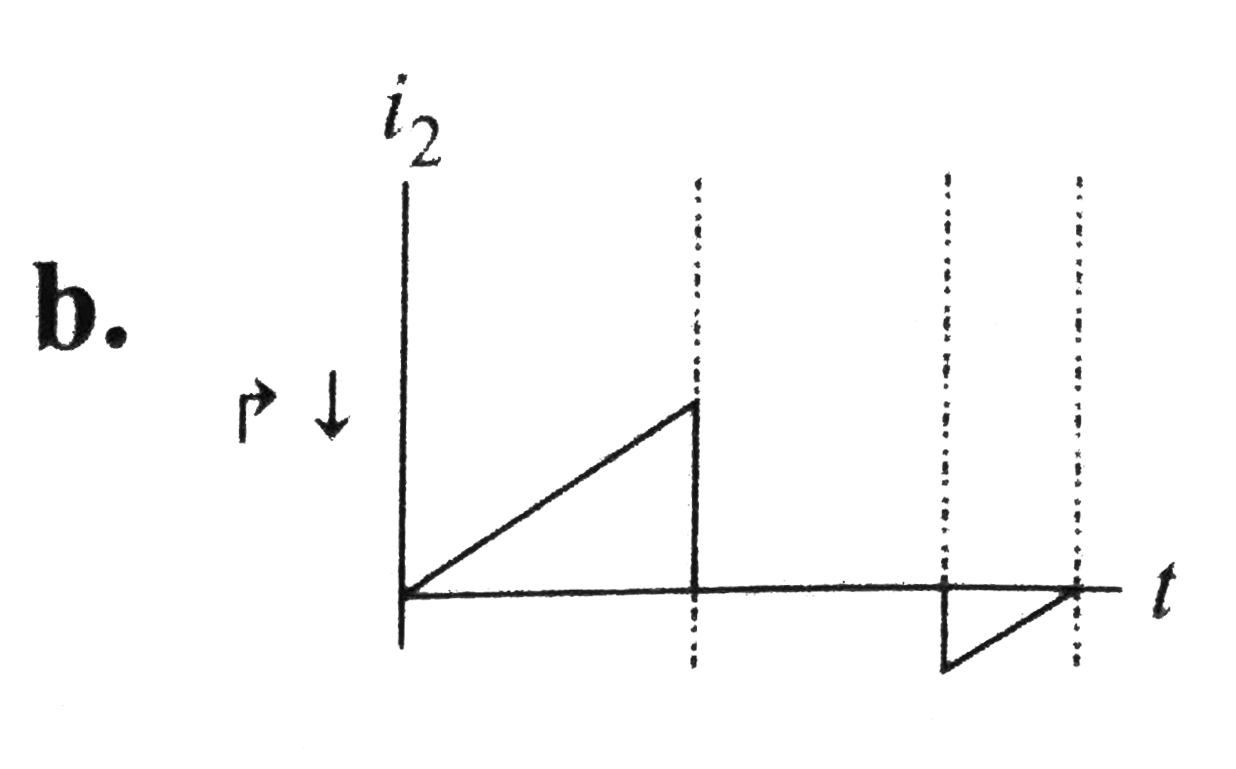
( c) 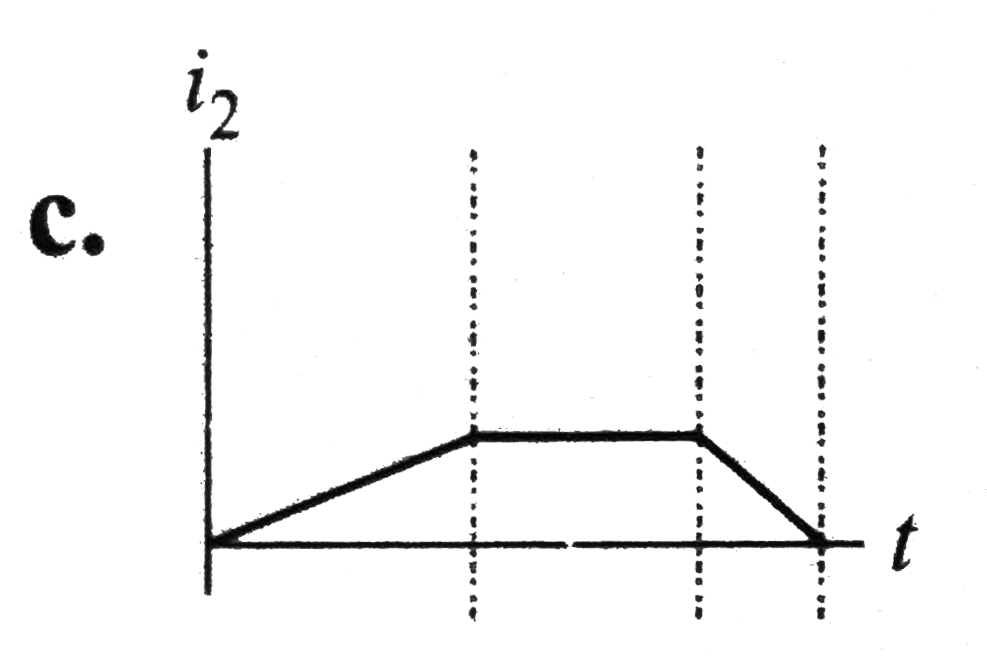
(d) 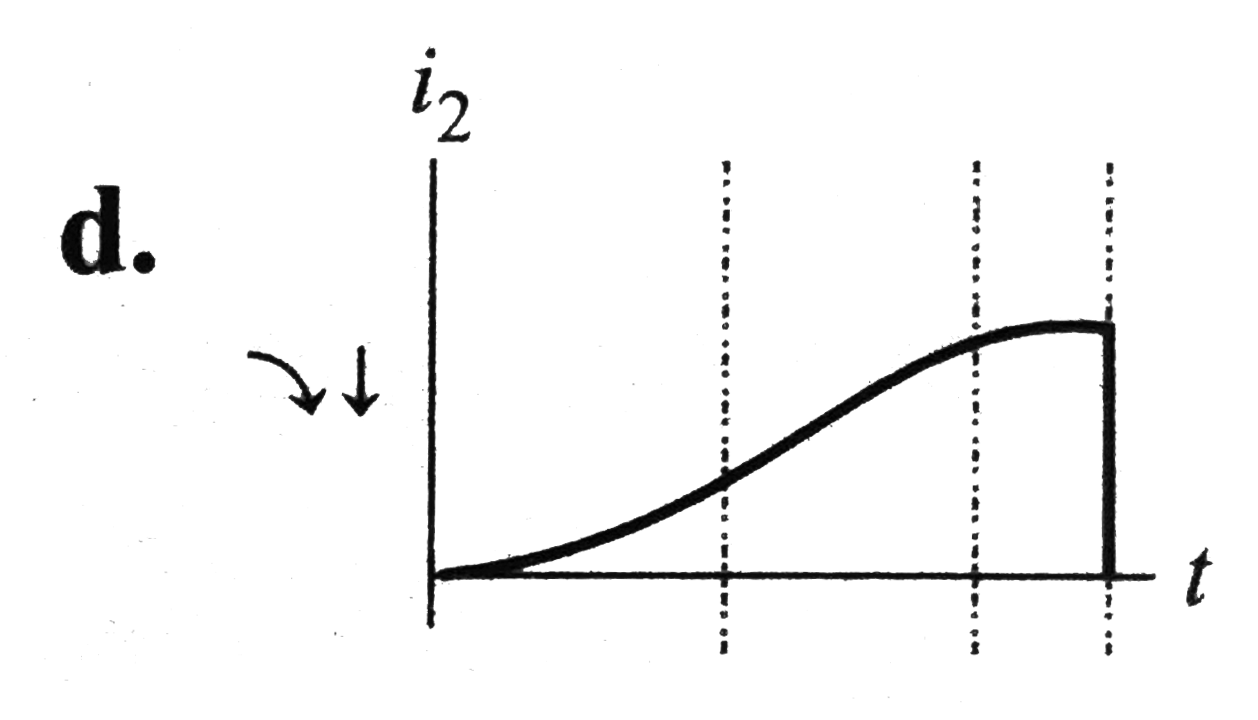
The correct Answer is:A
(a) Let M is mutual inductance of coil, then the flux in second coil is
ϕ2=Mi1 ltbr> e2=dϕ2dt=Mdi1dt
i2=e2R=MRdidt → i2∝didt
Topper's Solved these Questions
- BOOK - CENGAGE PHYSICS ENGLISHCHAPTER - ELECTROMAGNETIC INDUCTIONEXERCISE - Exercises Multiple Correct23videos
ELECTROMAGNETIC INDUCTION
- BOOK - CENGAGE PHYSICS ENGLISHCHAPTER - ELECTROMAGNETIC INDUCTIONEXERCISE - Exercises Asserton - Reasoning8videos
ELECTROMAGNETIC INDUCTION
- BOOK - CENGAGE PHYSICS ENGLISHCHAPTER - ELECTROMAGNETIC INDUCTIONEXERCISE - Exercises Subjective13videos
ELECTROMAGNETIC INDUCTION
- BOOK - CENGAGE PHYSICS ENGLISHCHAPTER - ELECTRICAL MEASURING INSTRUMENTSEXERCISE - M.C.Q2videos
ELECTRICAL MEASURING INSTRUMENTS
- BOOK - CENGAGE PHYSICS ENGLISHCHAPTER - ELECTRON,PHONTS,PHOTOELECTRIC EFFECT & X-RAYSEXERCISE - dpp 3.315videos
ELECTRON,PHONTS,PHOTOELECTRIC EFFECT & X-RAYS
Similar Questions
Knowledge Check
- Question 1 - Select One
The reading of ammeter shown in figure is
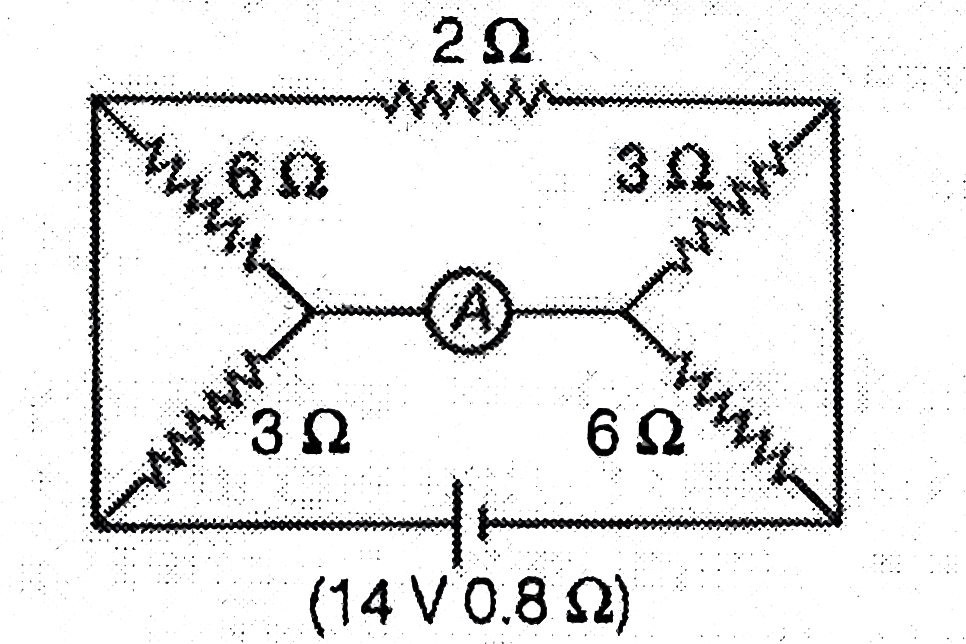 A6.56AB3.28AC2.18AD1.09A
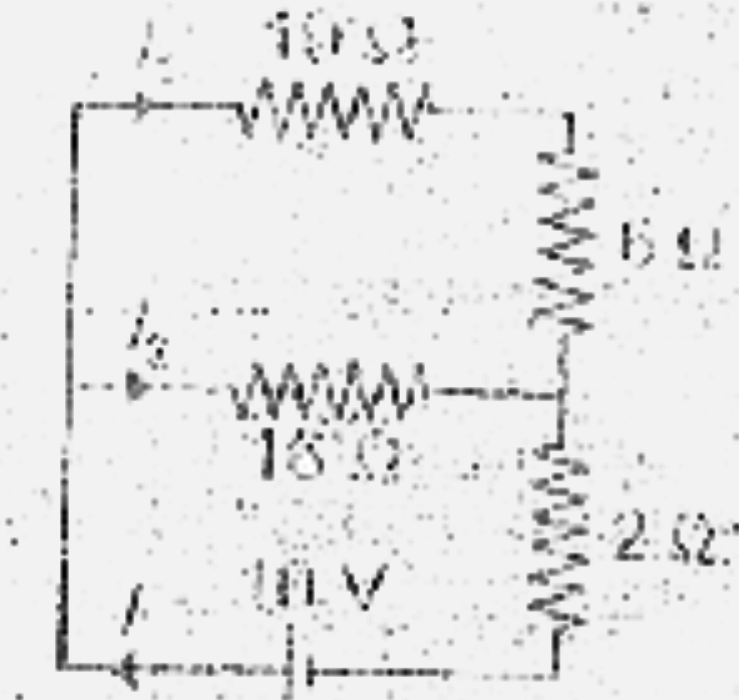
Find the currents through the three resistors shown in Figure
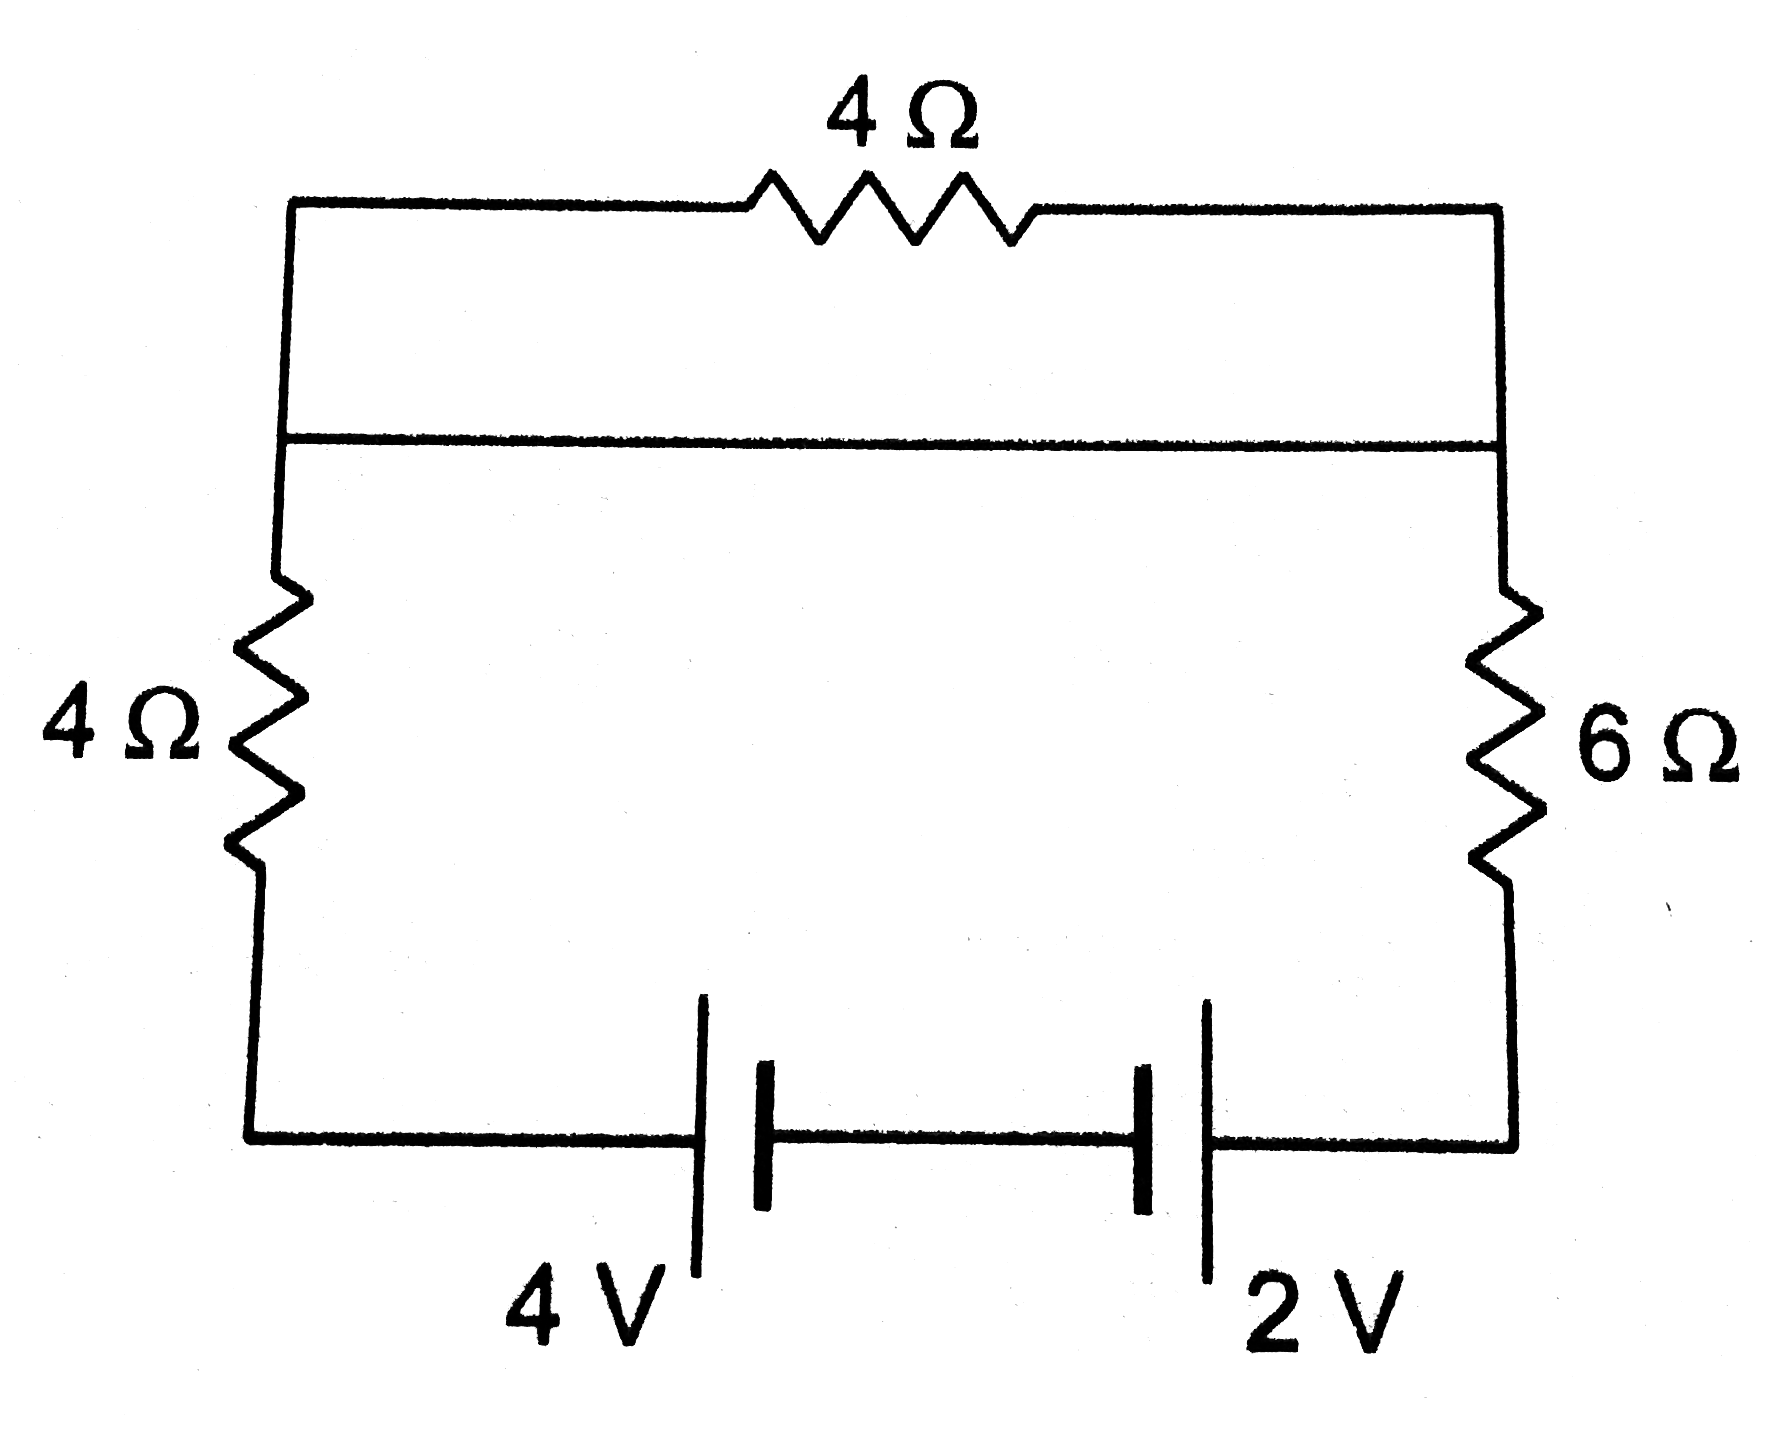 View Solution
The magnetic flux through a coil varies with timet as shown in the diagram. Which graph best represents the variation of the e.m.f. E induced in the coil with time t?
View SolutionCurrent I in the network shown in figure
 View Solution
The velocity − time graph of a particle is as shown in figure
 View Solution
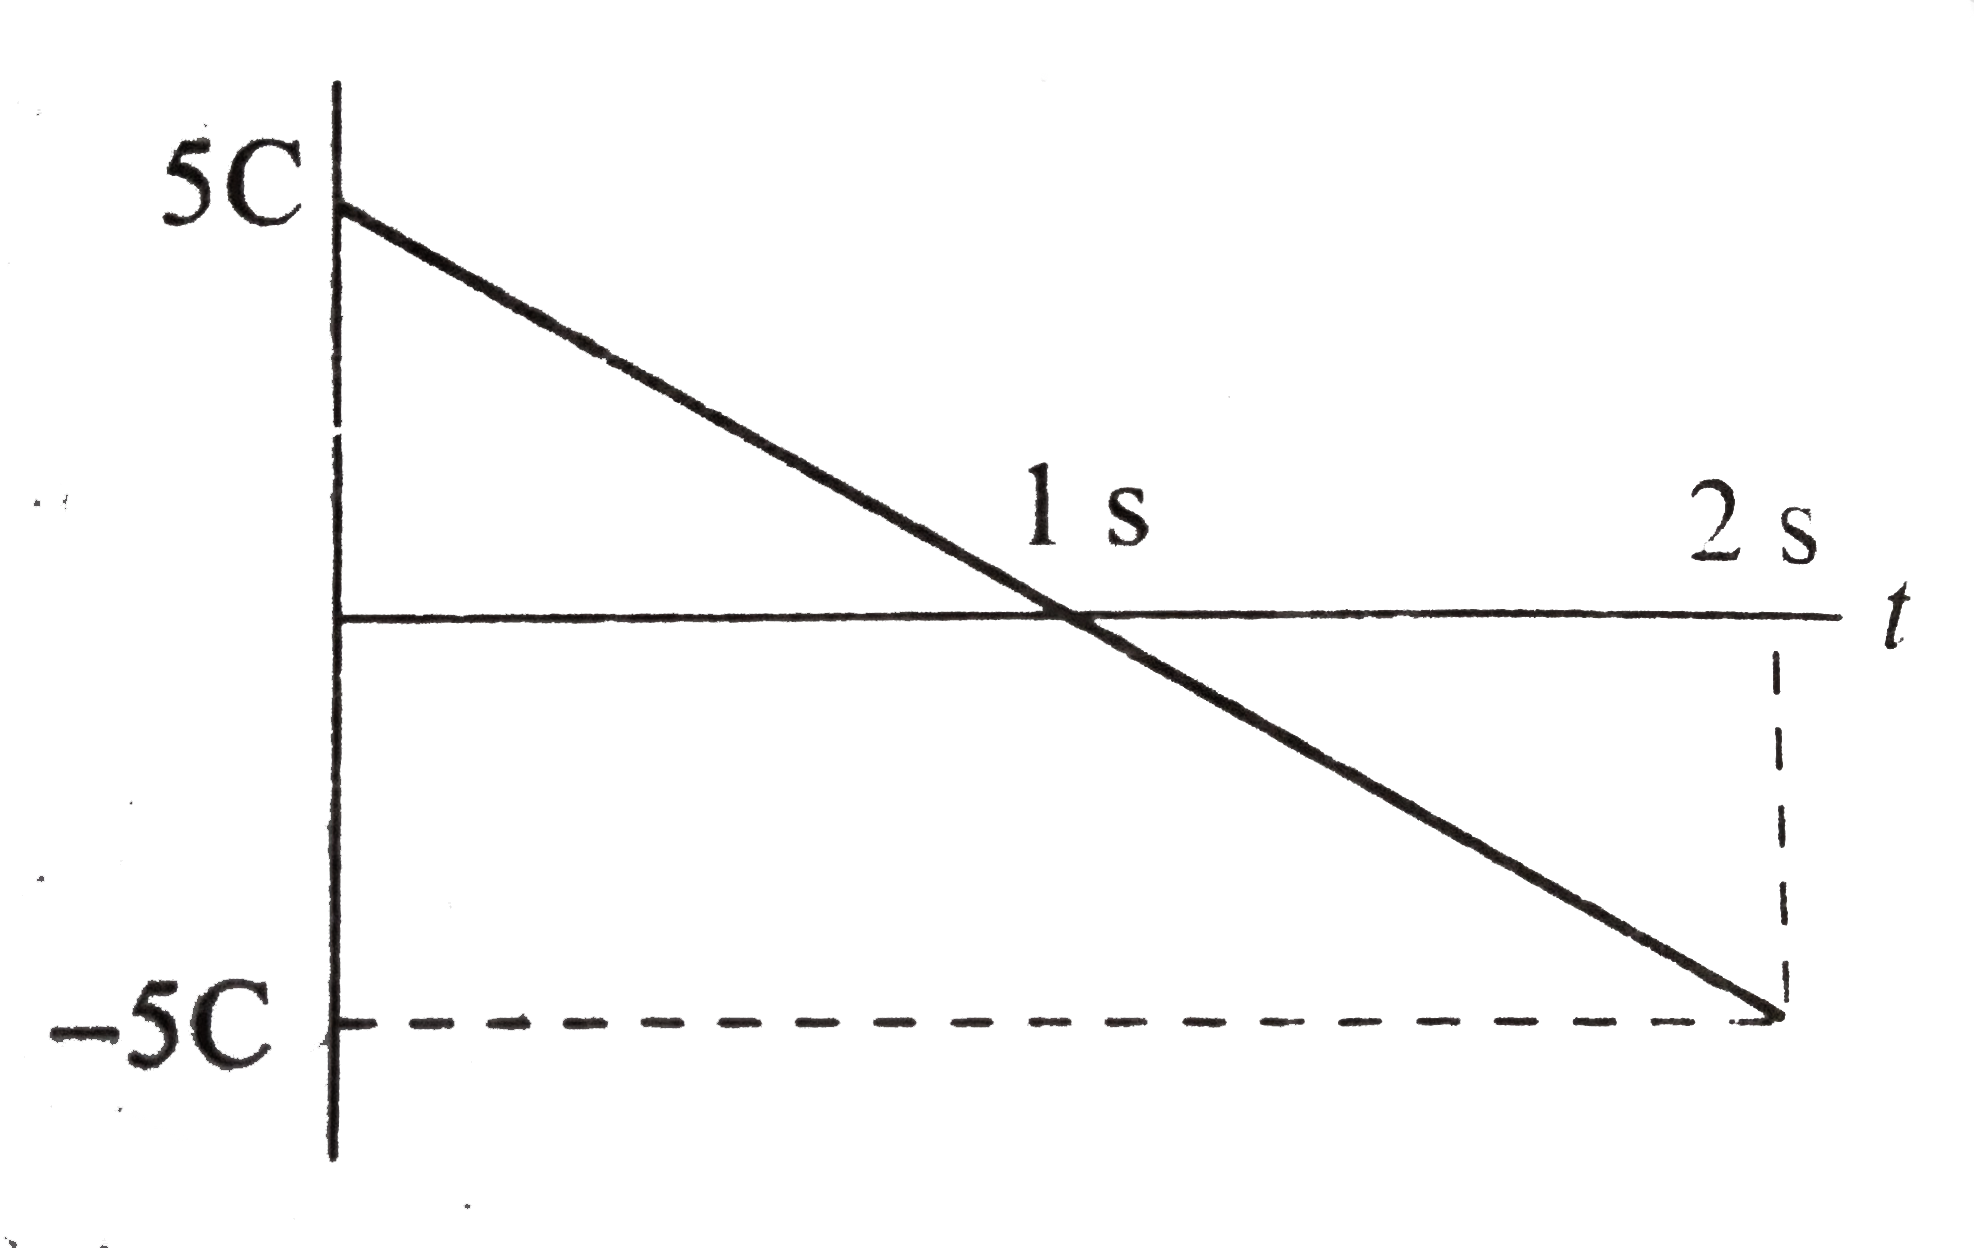
A charge passing through a resistor varies with time as shown in the figure. The amount of heat generated in time t is best represented (as a function of time ) by
 View Solution
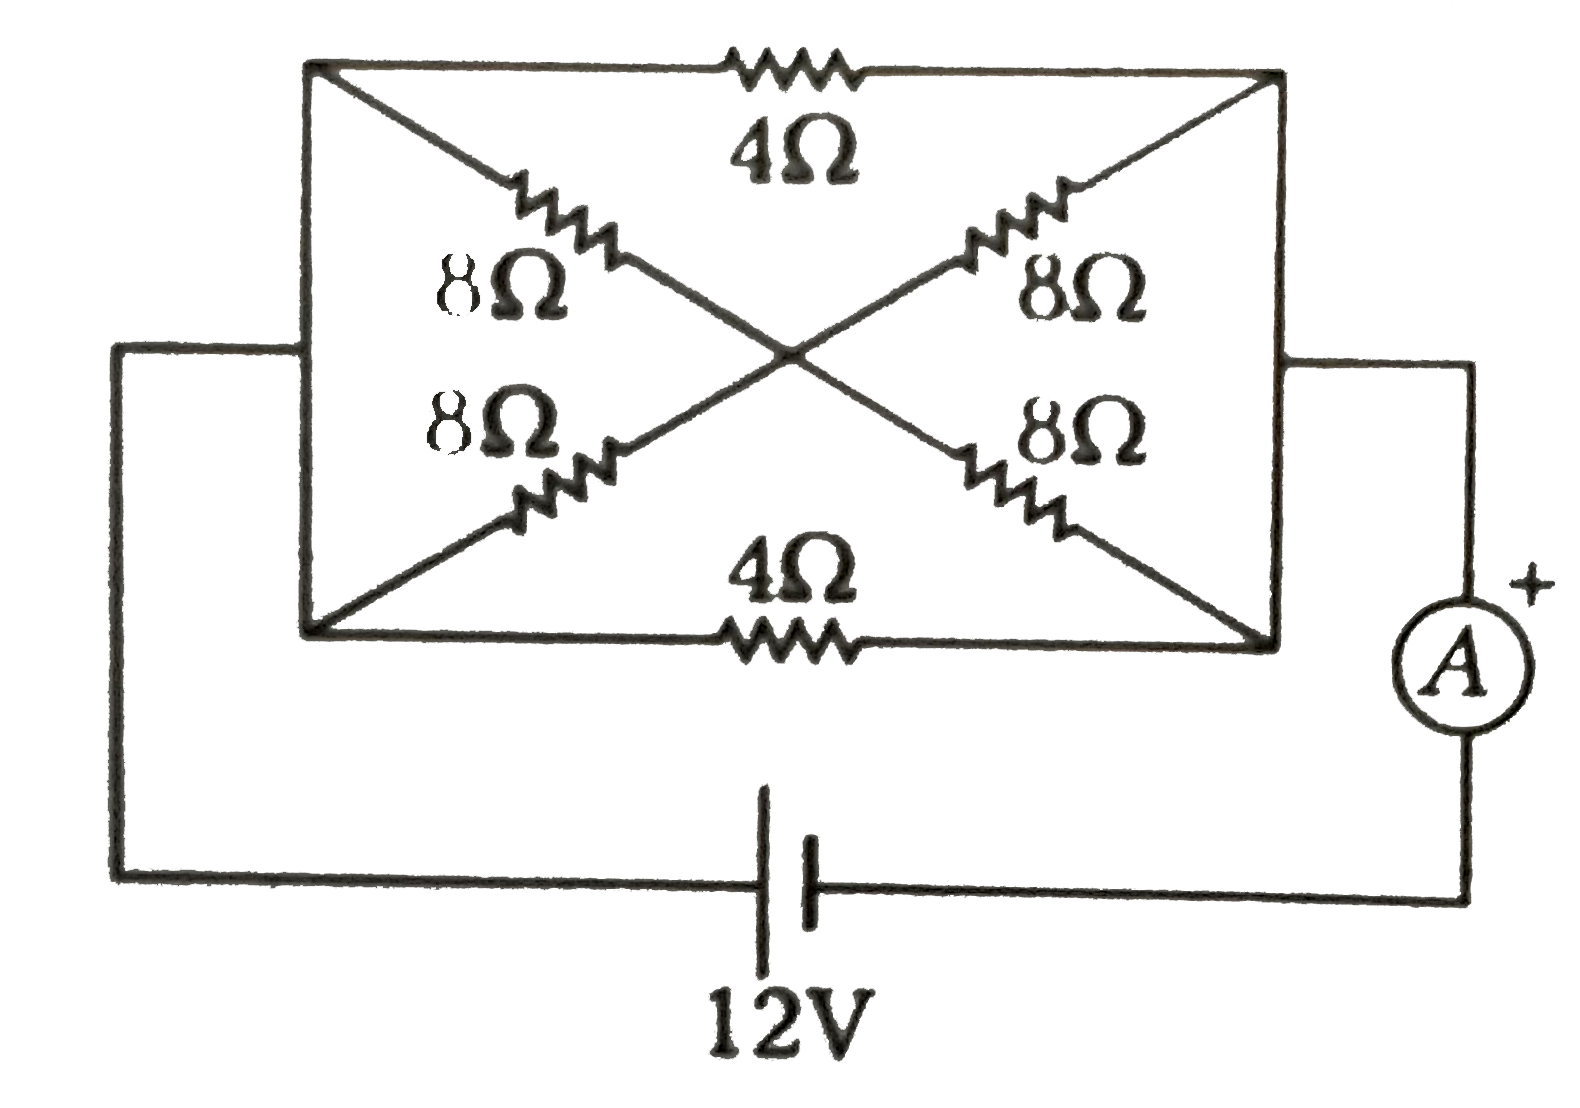
Calculate the current shown by the ammeter A in the circuit shown in figure.
 View Solution
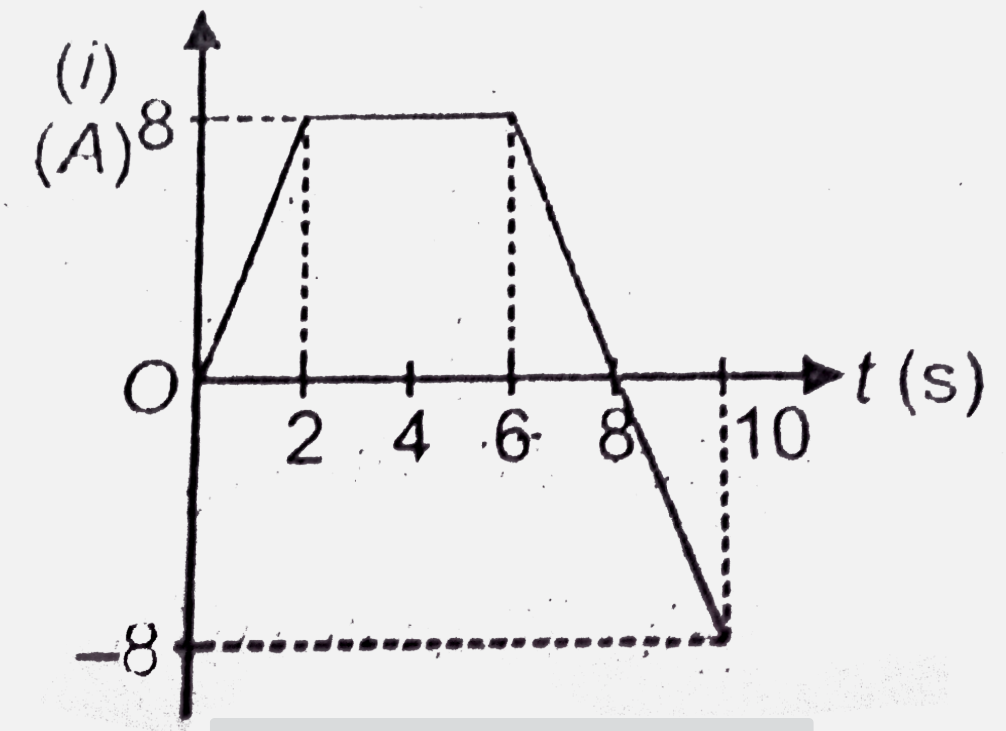
The current I through a conductor varies with time t as shown in figure. The average electric current during t=0 to t=10 s will be
 View Solution


