A constant current i is passed through a resistor. Taking the temperature coefficient of resistance into account, indicate which of the plots shown in Figure best represents the rate of production of thermal energy in the resistor
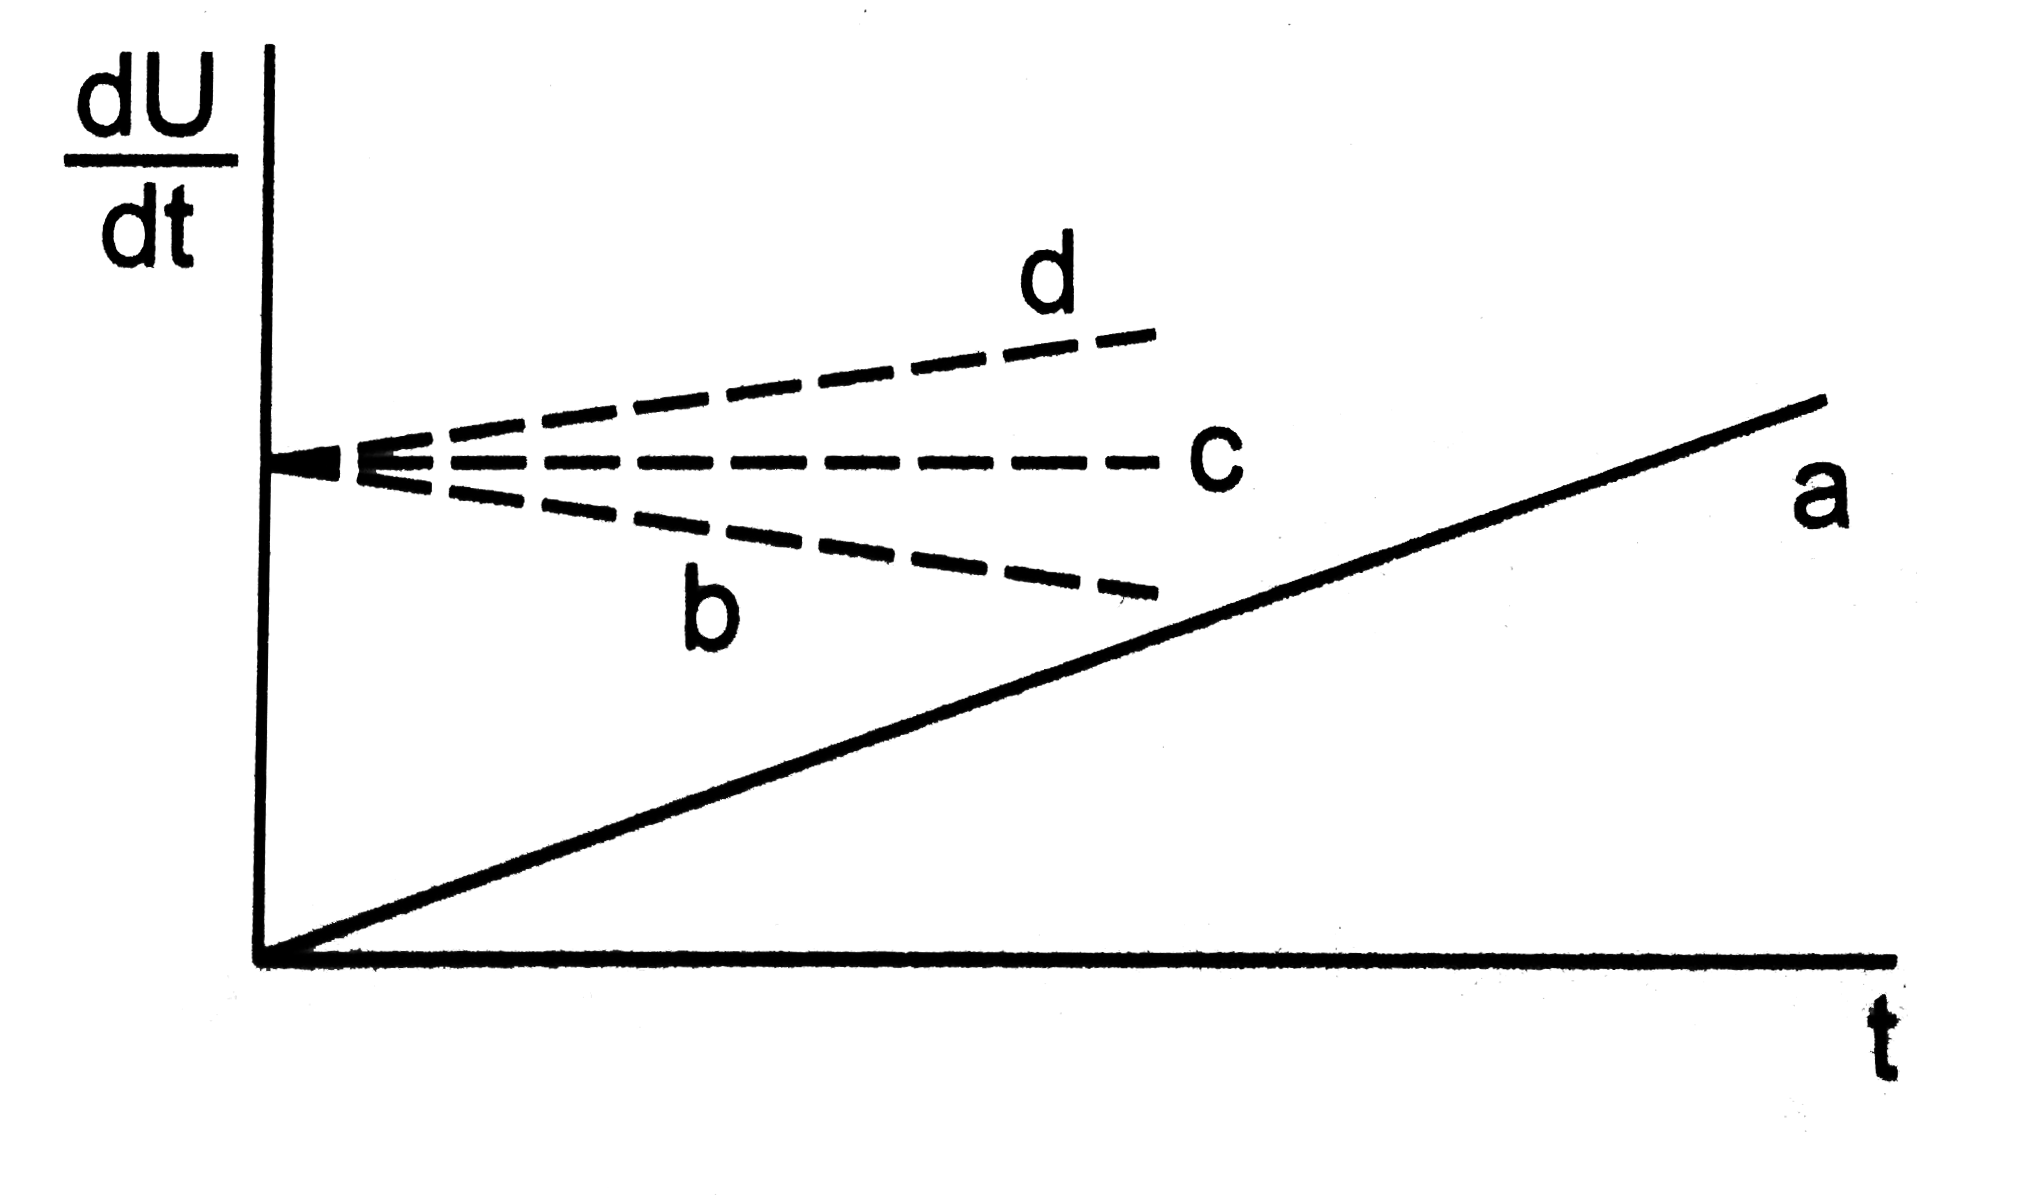
a
b
c
d
The correct Answer is:D
Step by step video & image solution for A constant current i is passed through a resistor. Taking the temperature coefficient of resistance into account, indicate which of the plots shown in Figure best represents the rate of production of thermal energy in the resistor by Physics experts to help you in doubts & scoring excellent marks in Class 12 exams.
Updated on:21/07/2023Topper's Solved these Questions
- HEATING EFFECT OF CURRENTBOOK - CENGAGE PHYSICS ENGLISHCHAPTER - HEATING EFFECT OF CURRENTEXERCISE - Calculating Thermal Power in Resistance
14 Videos
- GEOMETRICAL OPTICSBOOK - CENGAGE PHYSICS ENGLISHCHAPTER - GEOMETRICAL OPTICSEXERCISE - Integer Type
4 Videos
- INDUCTANCEBOOK - CENGAGE PHYSICS ENGLISHCHAPTER - INDUCTANCEEXERCISE - Concept Based
8 Videos
Similar Questions
When a current passes through a resistor, its temperature increases. Is it an adiabatic process?
View SolutionFind the currents through the three resistors shown in Figure
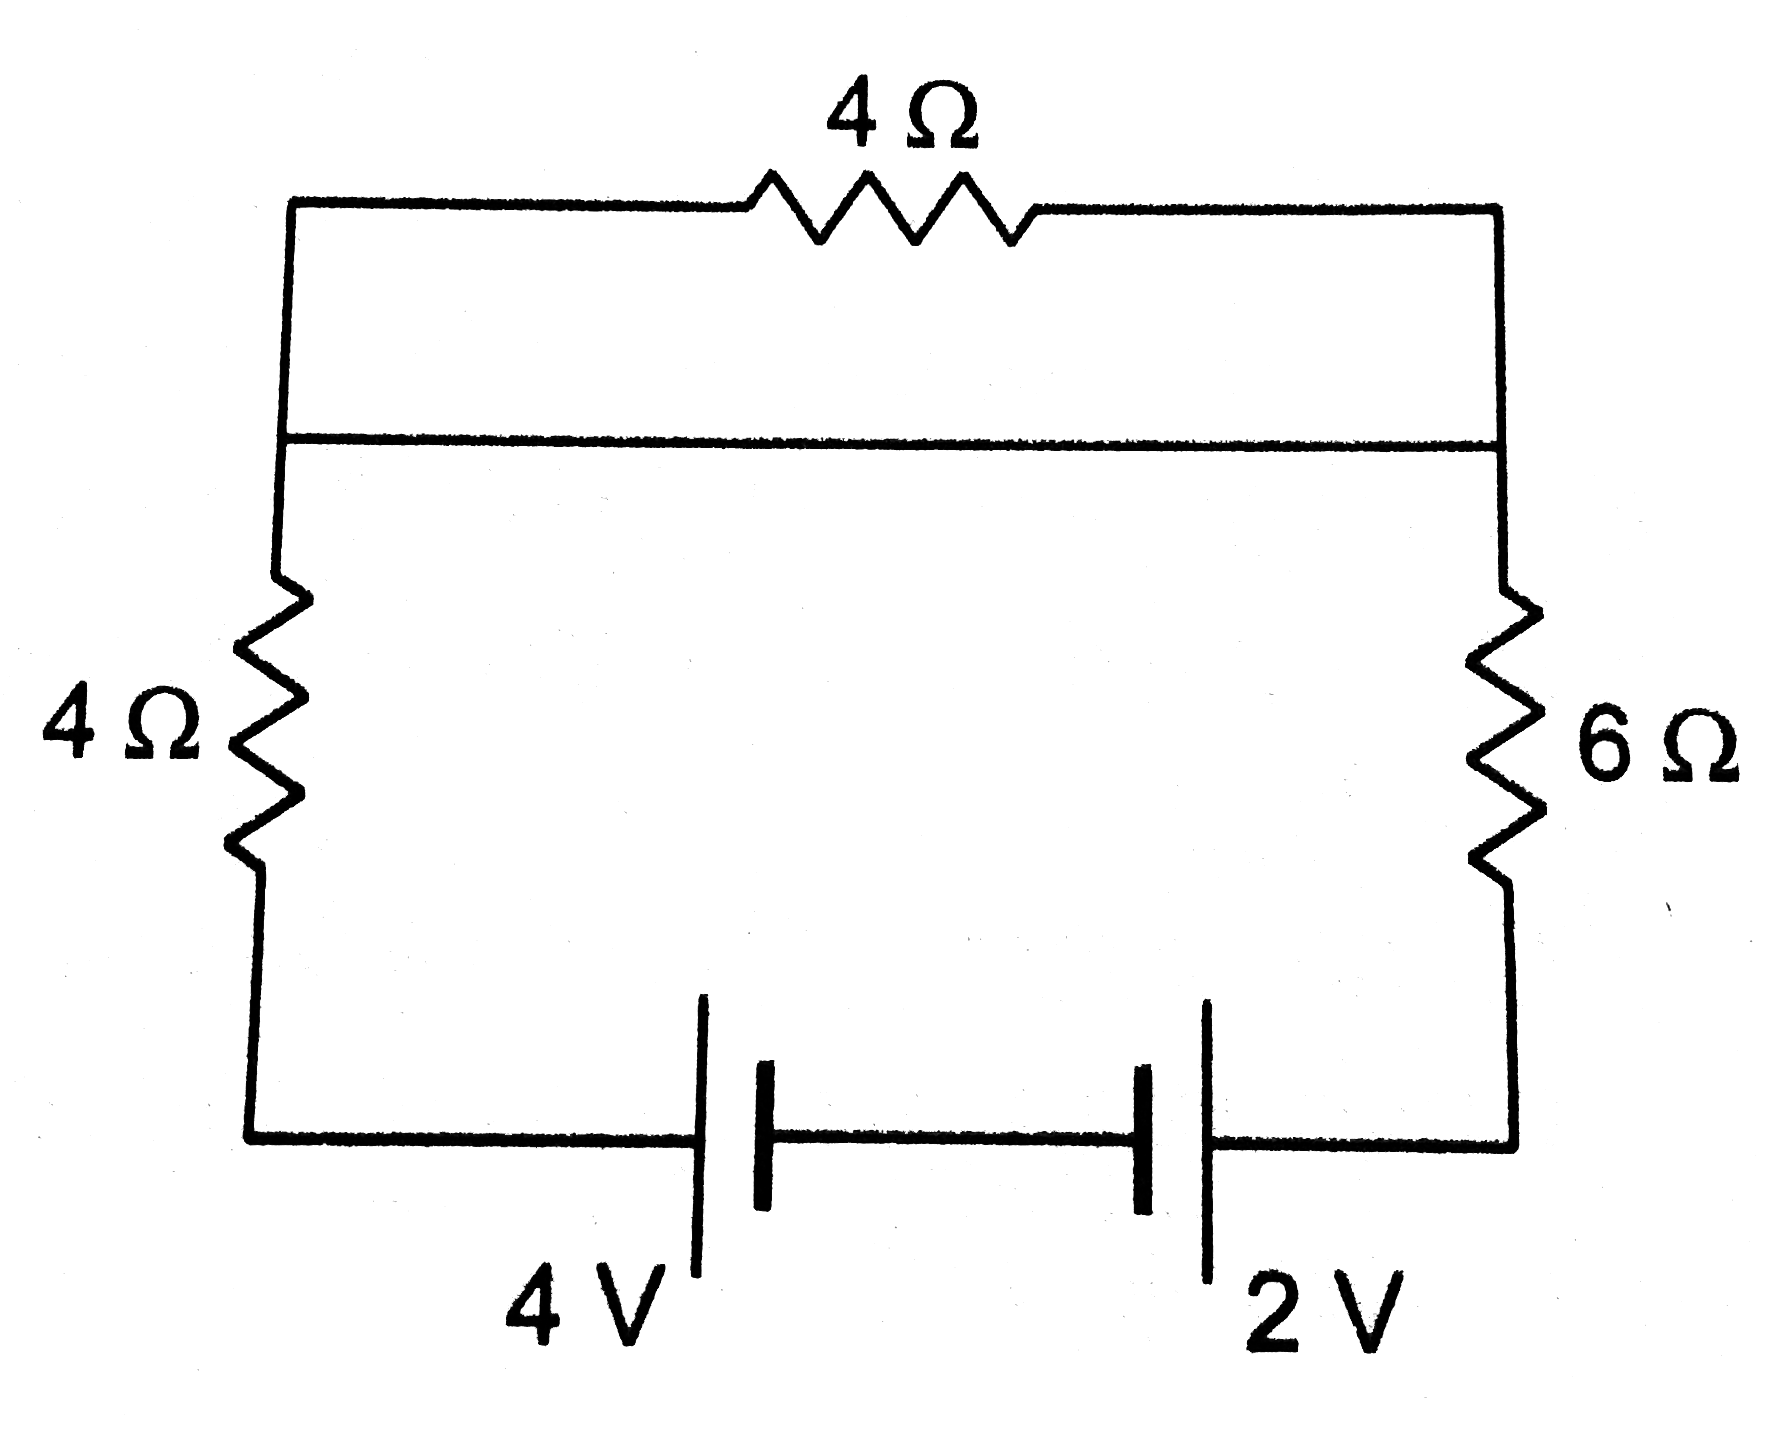
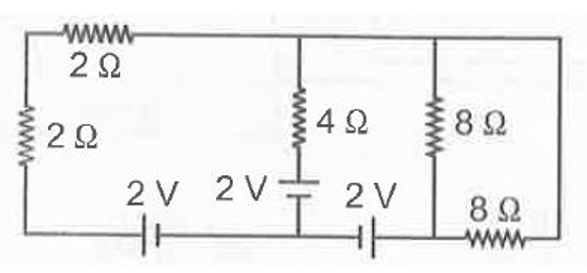
View SolutionFind the current through 4Ω resistor in the circuit shown in figure.
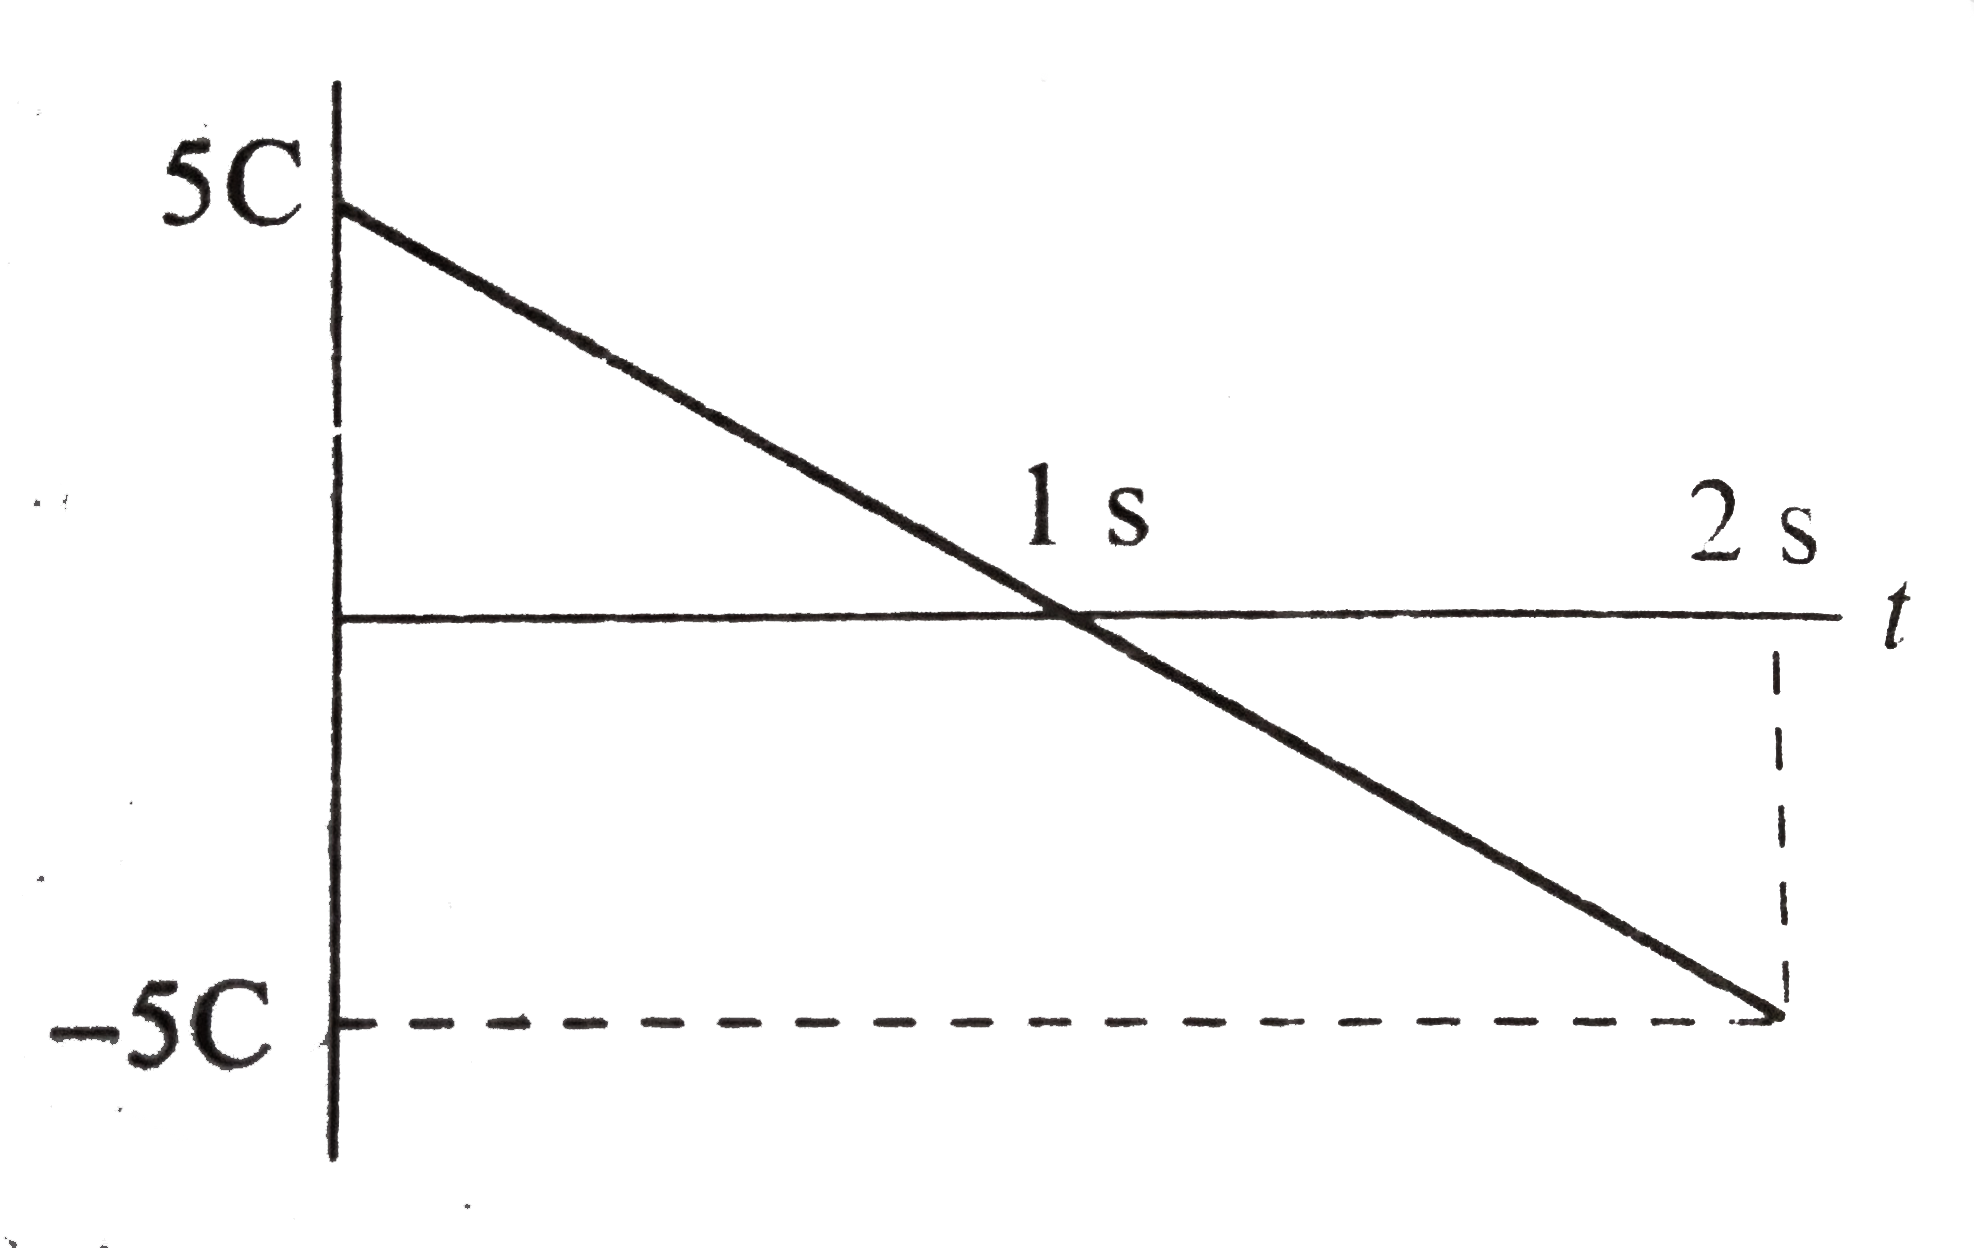
View SolutionA charge passing through a resistor varies with time as shown in the figure. The amount of heat generated in time t is best represented (as a function of time ) by
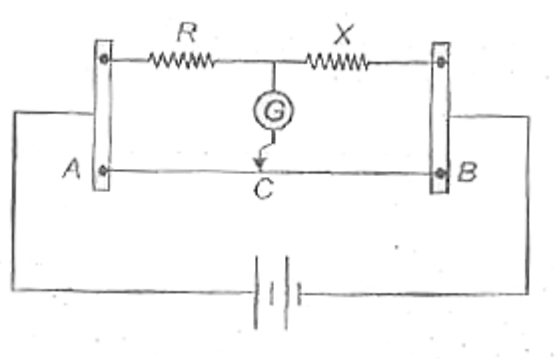
View SolutionIn the meter bridge shown , the resistance X has a negative temperature coefficient of resistance Negiecting the variaiton in other resistors, when current is passed for some time , in the circuit balance point should shift towards .
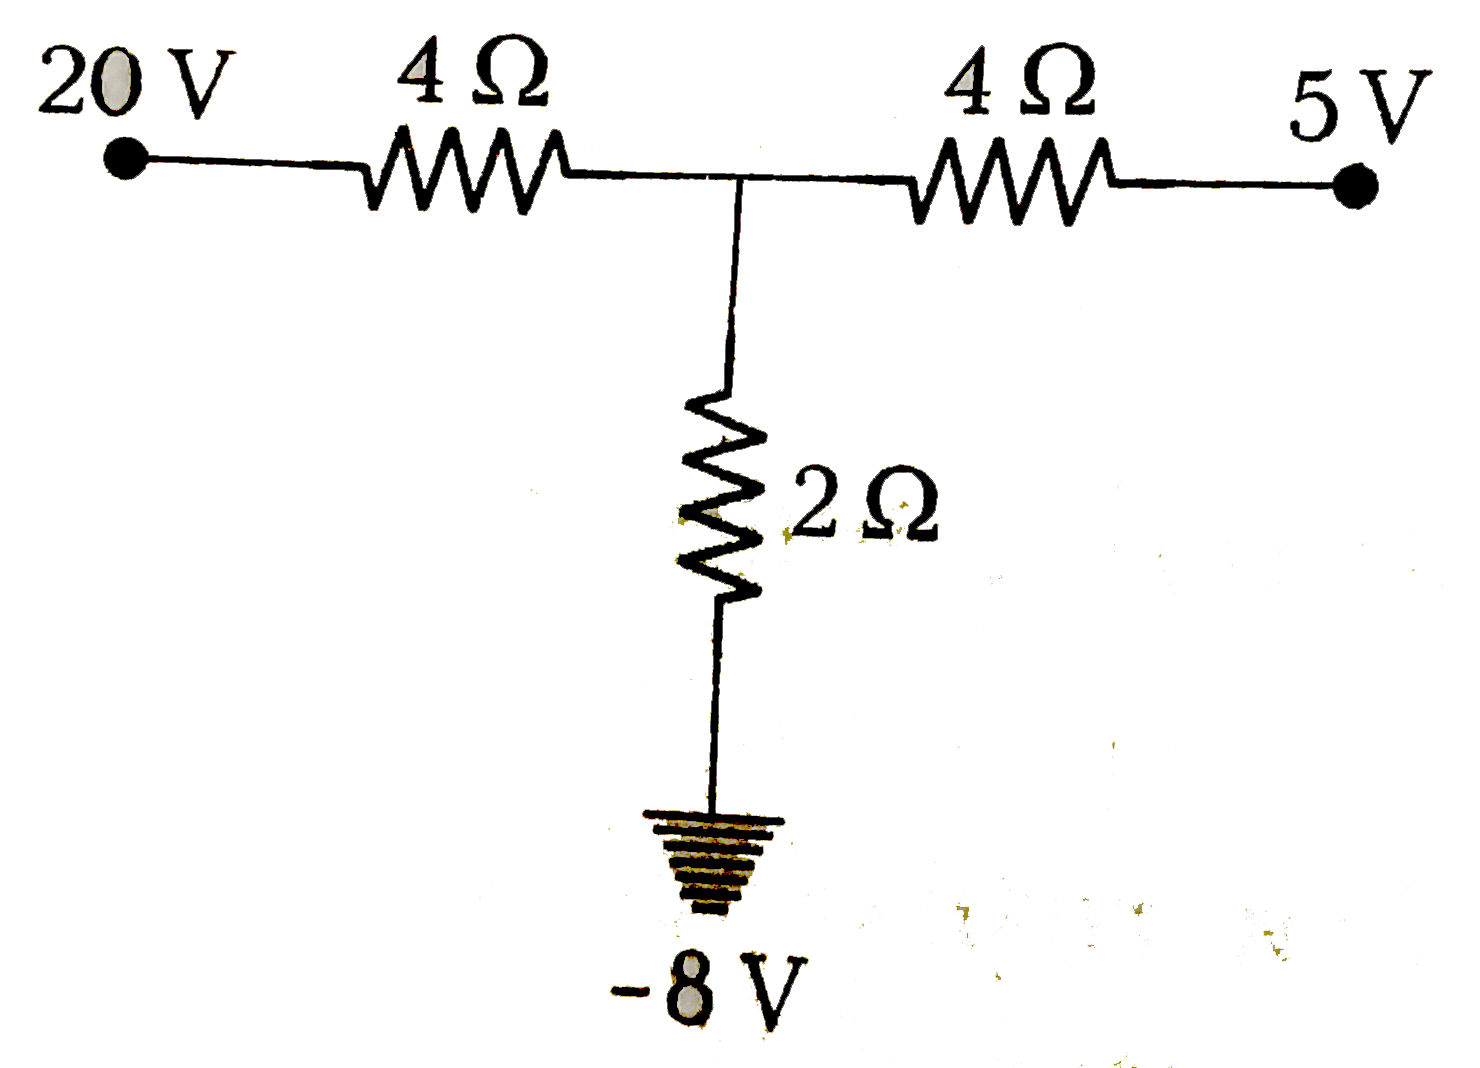
View SolutionThree resistances are connected to form a T-shape as shown in the figure. Then, the current in the 4Ω resistor is
View SolutionA constant potential difference is applied across a resistance. Consider variation of resistance with temperature. Which graph represents best the variation of power produced in resistance versus resistance?
View SolutionA current i passes through a wire of length l , radius of cross-section r and resistivity ρ . The rate of heat generation is
View SolutionFind the current through the 10(Ω)resistor shown in figure.
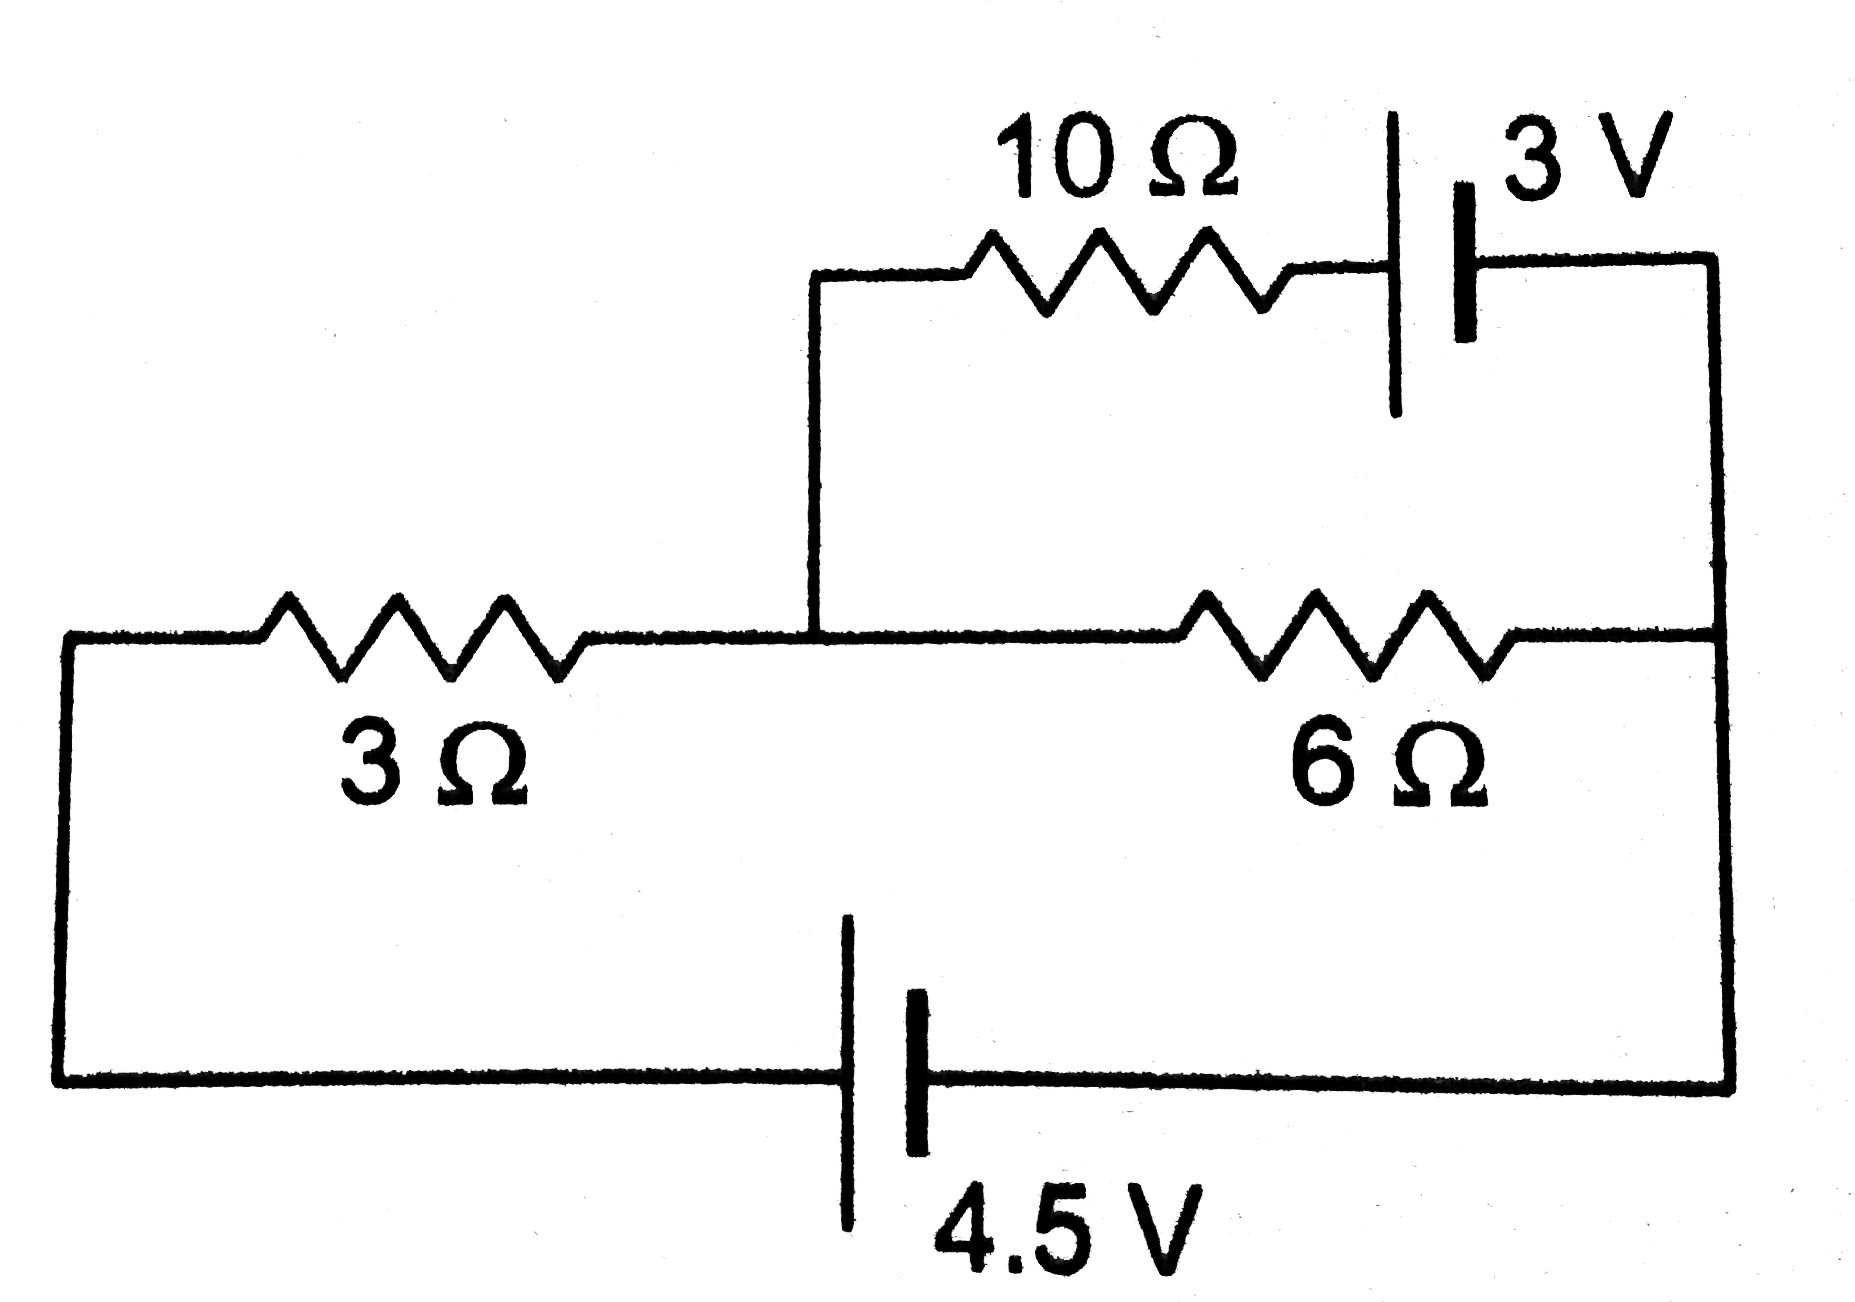
View SolutionFind the current through the 10(Ω)resistor shown in figure.

View Solution