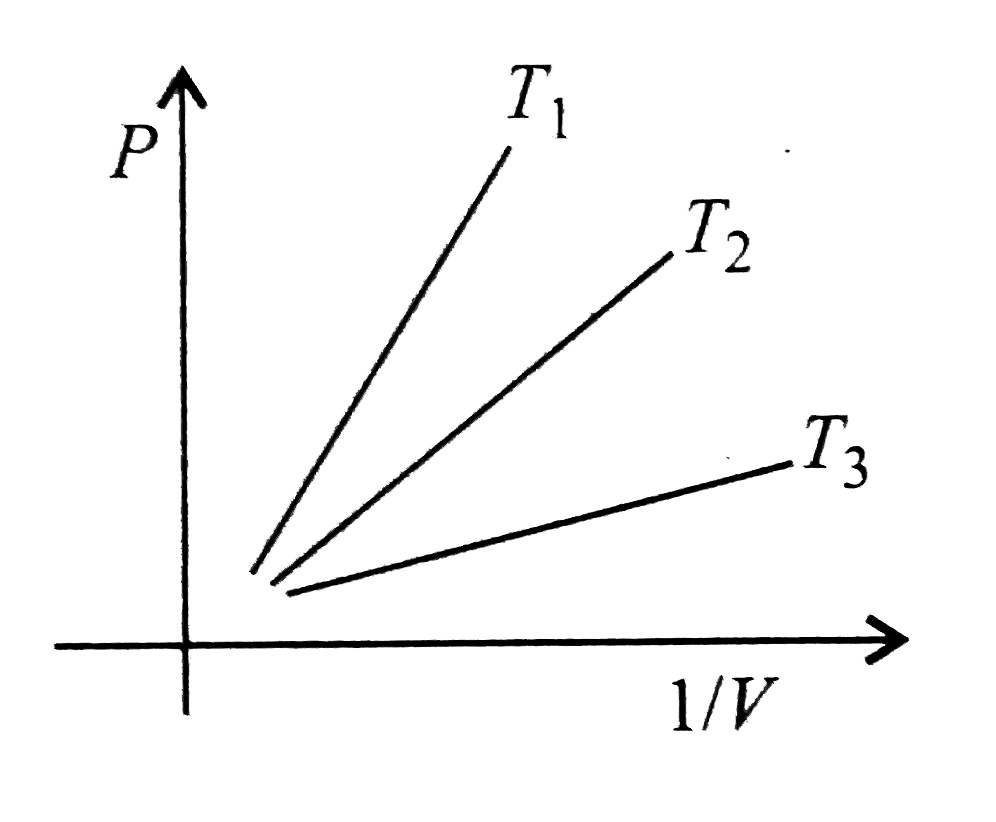
The curve drawn below shows the variations of P as a function of 1/V for a fixed mass and temperature of an ideal gas. It follows from the curve that:
T3>T2>T1
T1>T2>T3
T1=T2=T3
Nothing can be predicted about temperatures
For ideal gas PV=nRT
or P=nRTV
Therefore, the slope increases with temperature.
Topper's Solved these Questions
- STATES OF MATTERBOOK - CENGAGE CHEMISTRY ENGLISHCHAPTER - STATES OF MATTEREXERCISE - Illustration
2 Videos
- STATES OF MATTERBOOK - CENGAGE CHEMISTRY ENGLISHCHAPTER - STATES OF MATTEREXERCISE - Exercises
21 Videos
- SOME BASIC CONCEPTS AND MOLE CONCEPTBOOK - CENGAGE CHEMISTRY ENGLISHCHAPTER - SOME BASIC CONCEPTS AND MOLE CONCEPTEXERCISE - Archives Subjective
11 Videos
- STOICHIOMETRYBOOK - CENGAGE CHEMISTRY ENGLISHCHAPTER - STOICHIOMETRYEXERCISE - Archives Subjective
33 Videos
Similar Questions
The given curve represents the variation of temperature as a function of volume for one mole of an ideal gas. Which of the following curves best represents the variation of pressure as a function of volume?
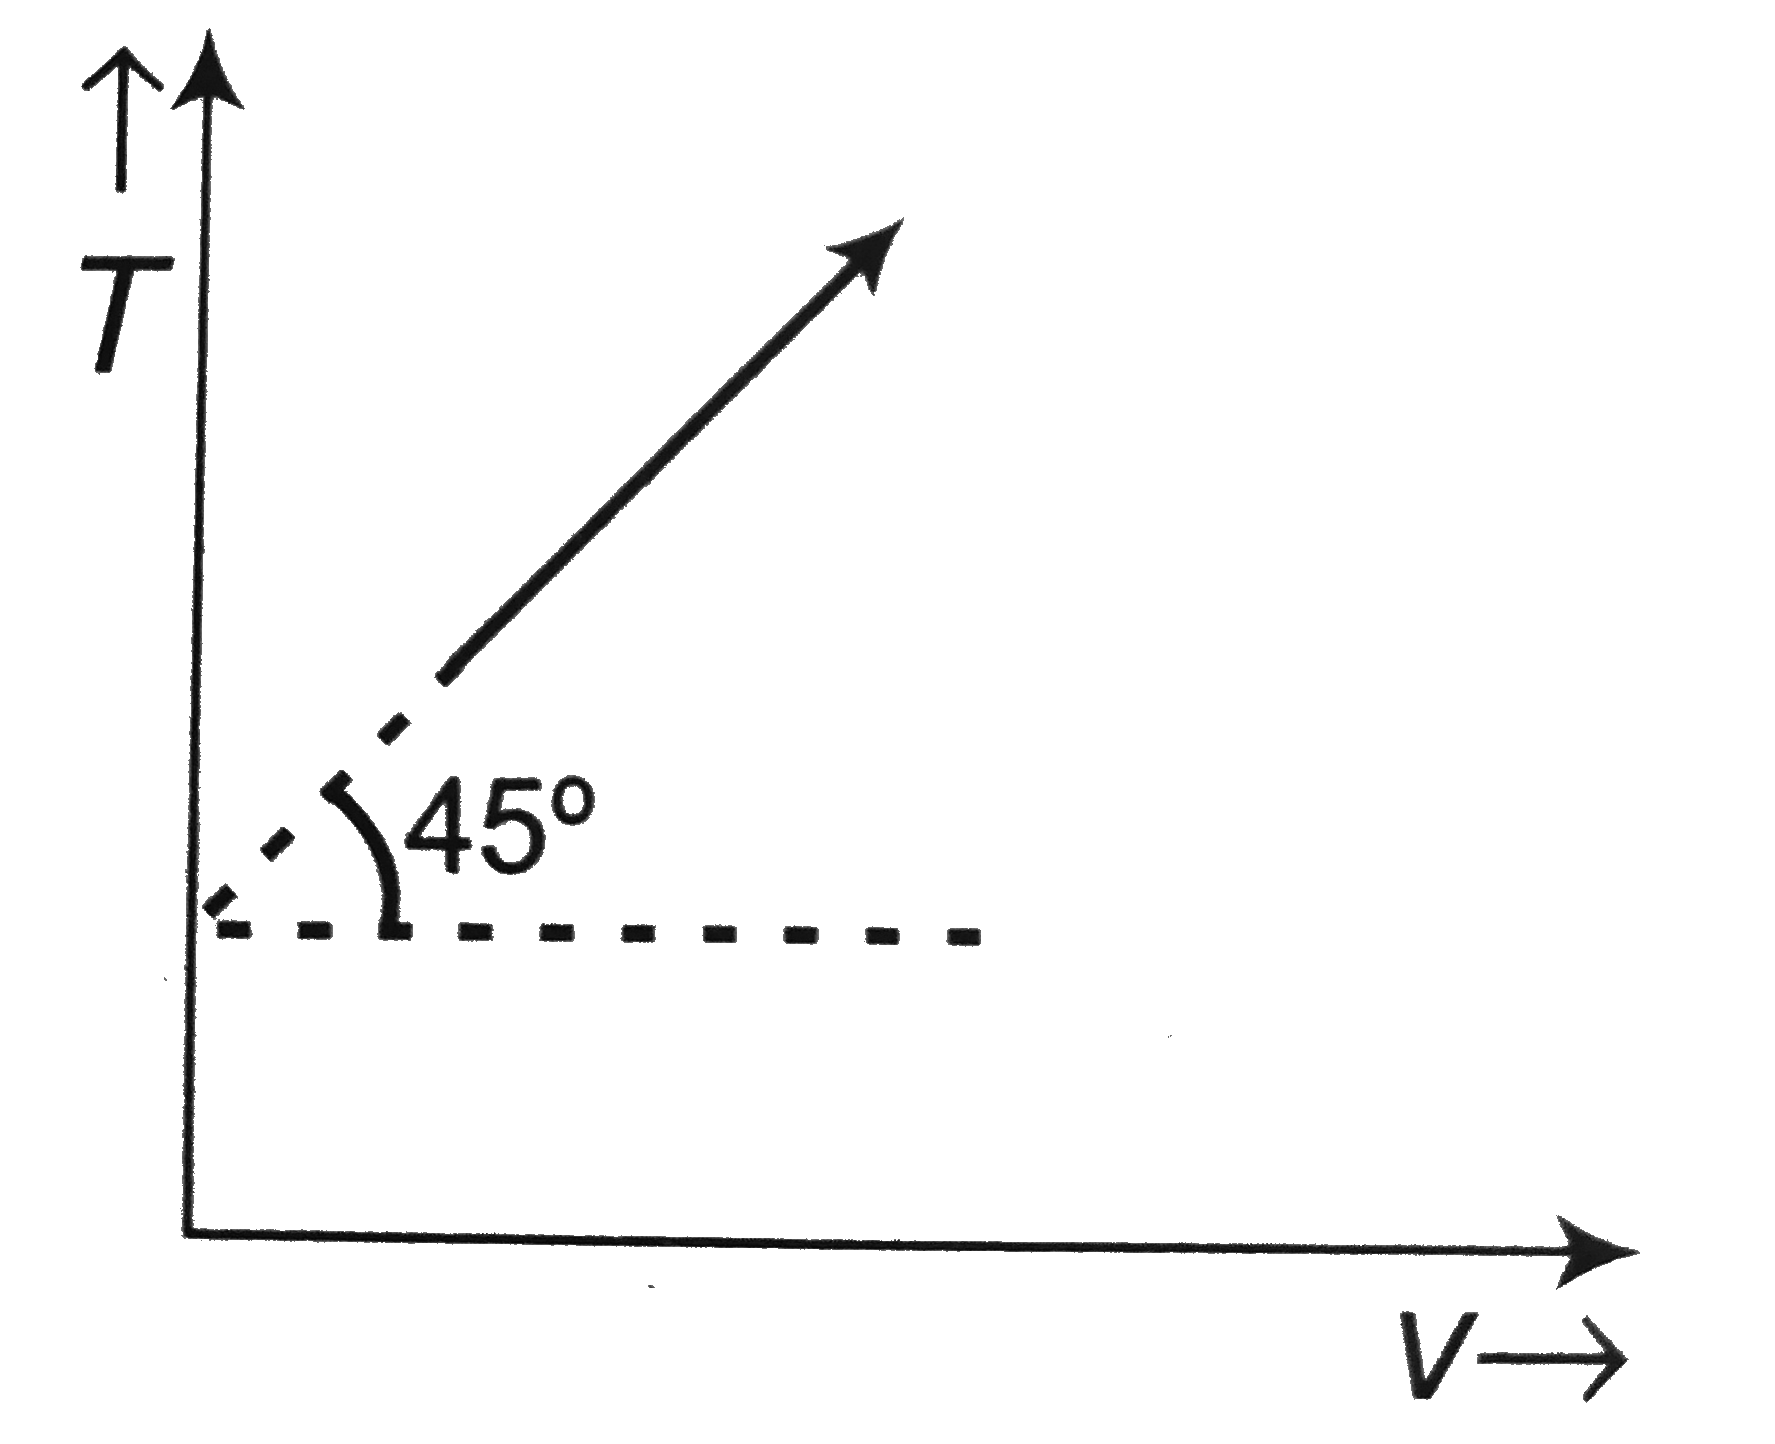
View SolutionThe given curve represents the variation of temperature as a function of volume for one mole of an ideal gas. Which of the following curves best represents the variation of pressure as a function of volume?

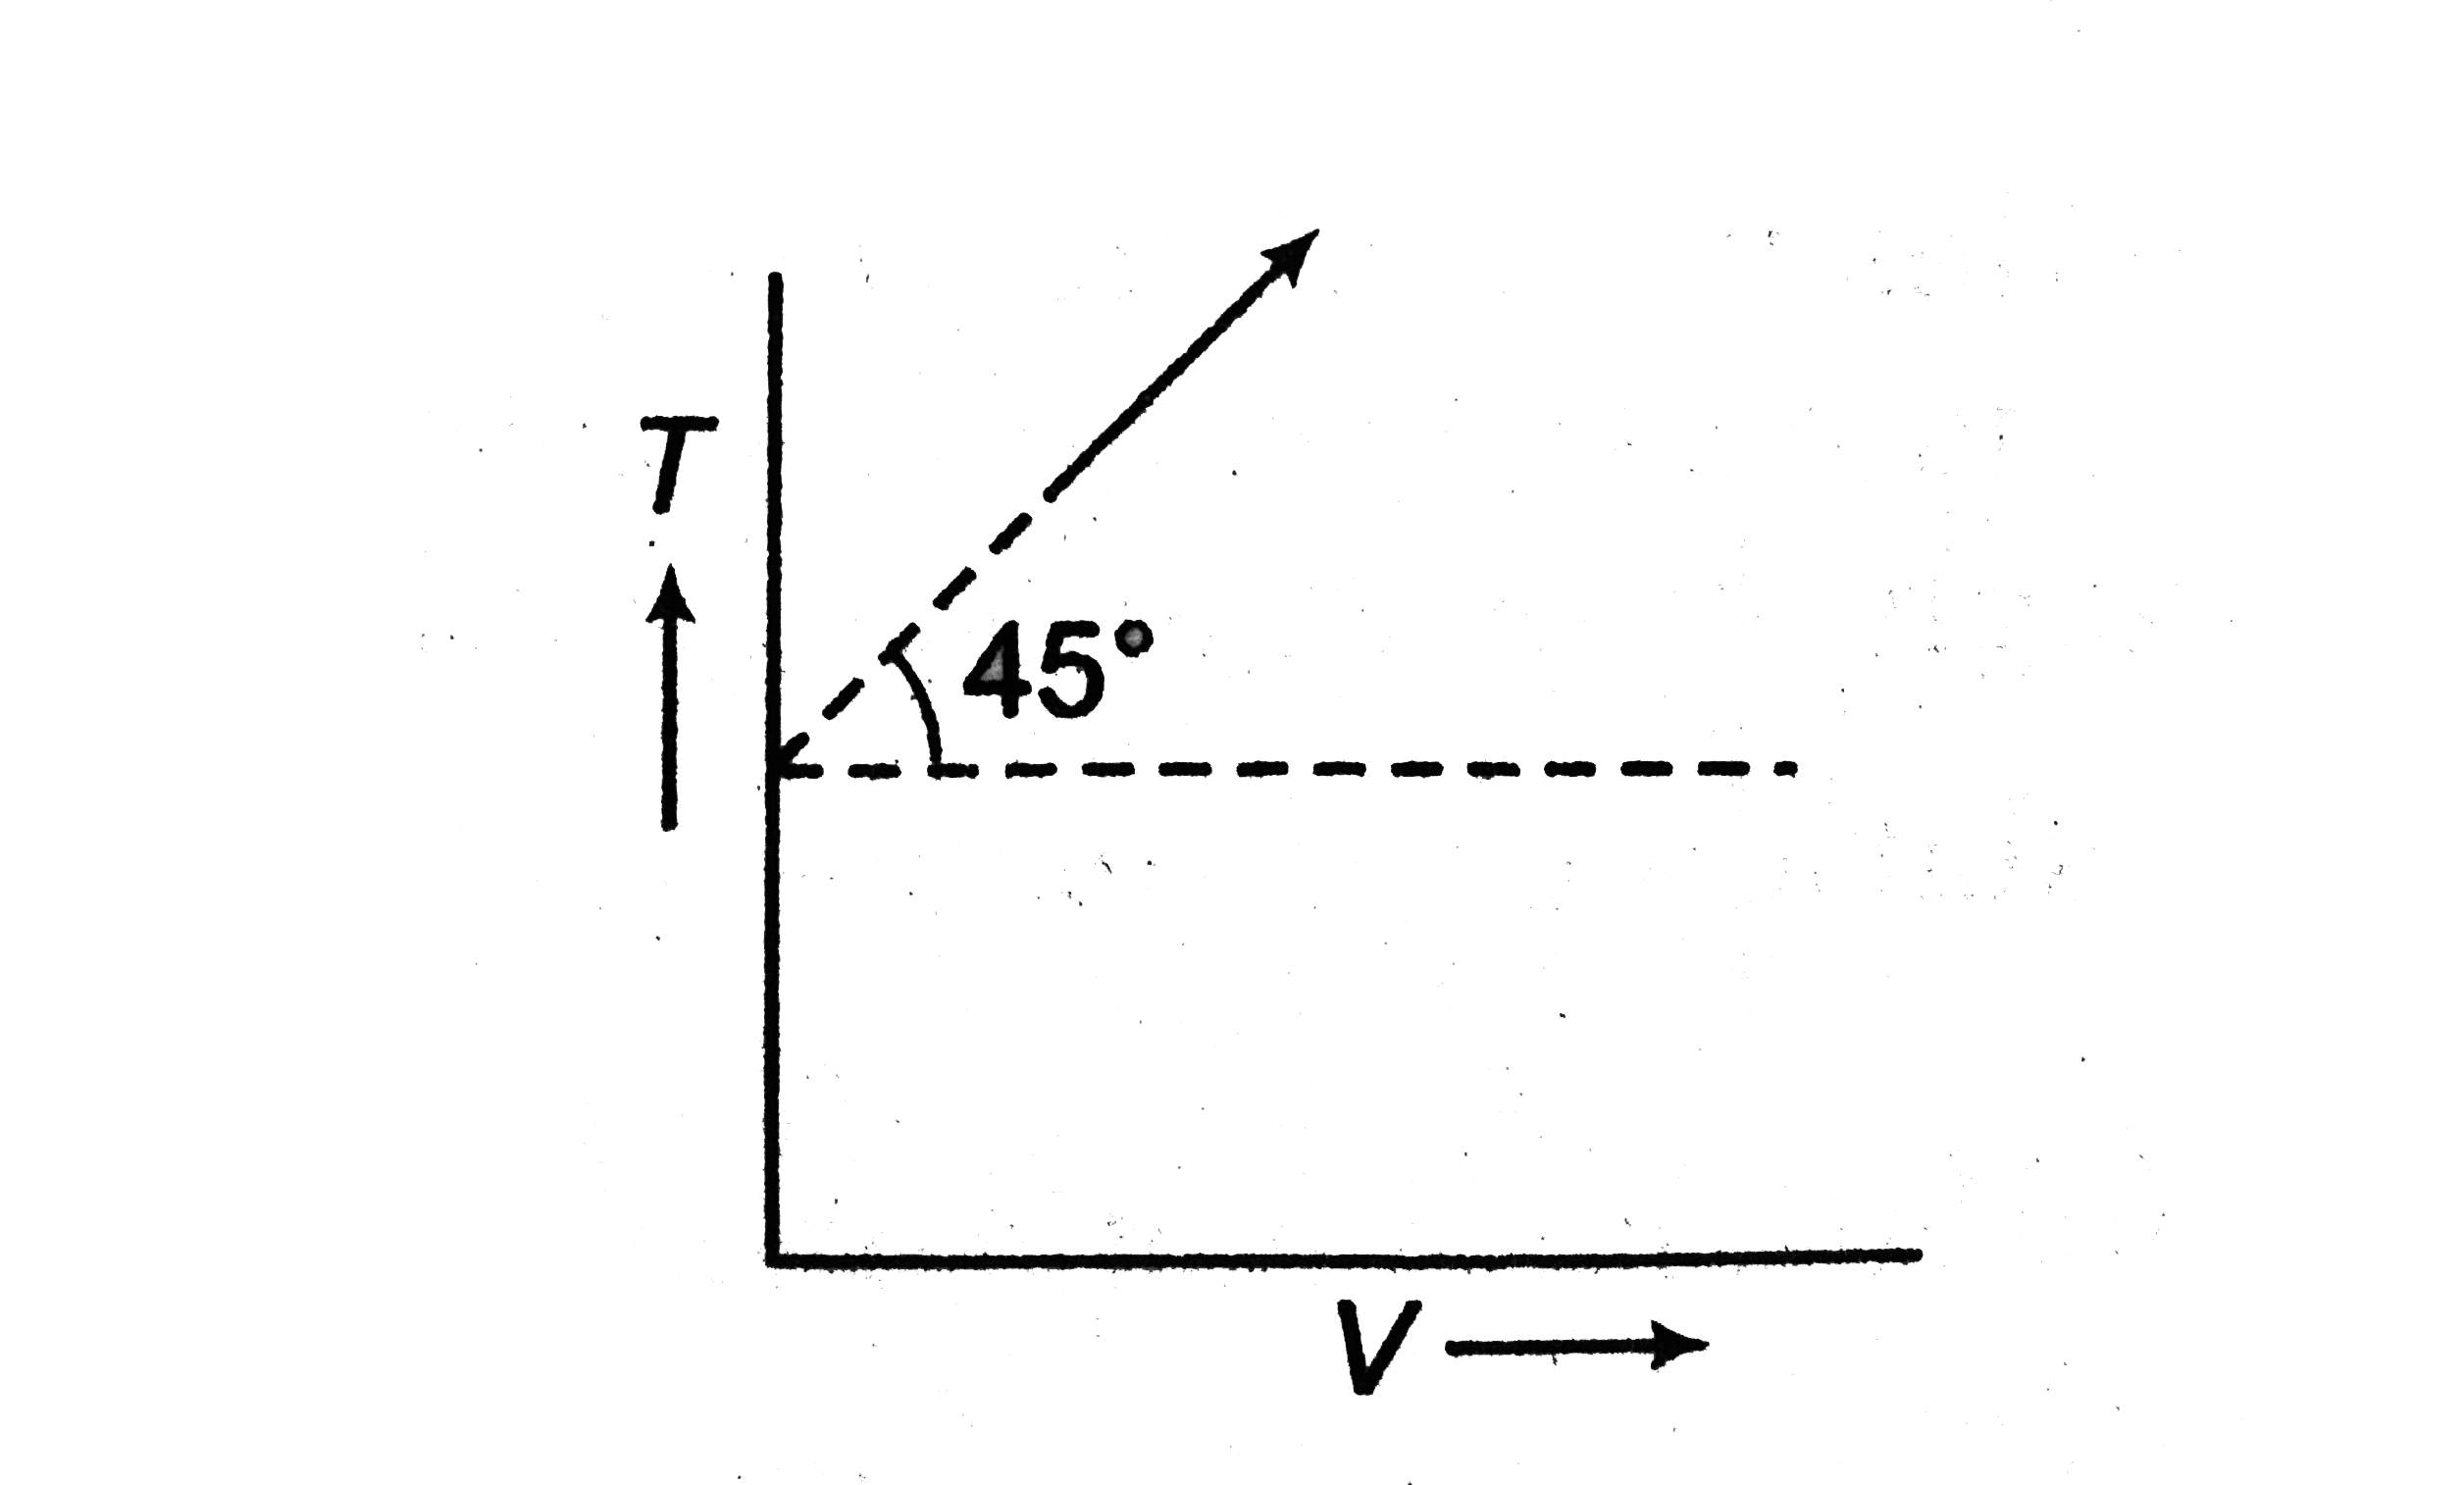
View SolutionThe given curve represents the variation of temperatue as a function of volume for one mole of an ideal gas. Which of the following curves best represents the variation of pressure as a function of volume ?
 .
.
View SolutionThe given curve represents the variation of temperatue as a function of volume for one mole of an ideal gas. Which of the following curves best represents the variation of pressure as a function of volume ?
 .
.
View SolutionDraw a graph of logP and log(1/V) for a fixed amount of gas at constant temperature.
View SolutionWhat is the shape of the curve obtained on plotting P against PV at constant temperature for an ideal gas ?
View SolutionDraw a graph of log P vs log (1/V) for a fixed amount of a gas at constant temperature.
View SolutionThe graph shows the variation of lnRv/s1T2, where R is resistance and T is temperature. Then find R as function T.
_2019_CBT5_E01_037_Q01.png)
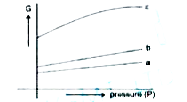
View SolutionThe following curve represents the variation of Gibbs function 'G' with pressure at constant temperature. Correct match of given plots with the physical state of a substance is
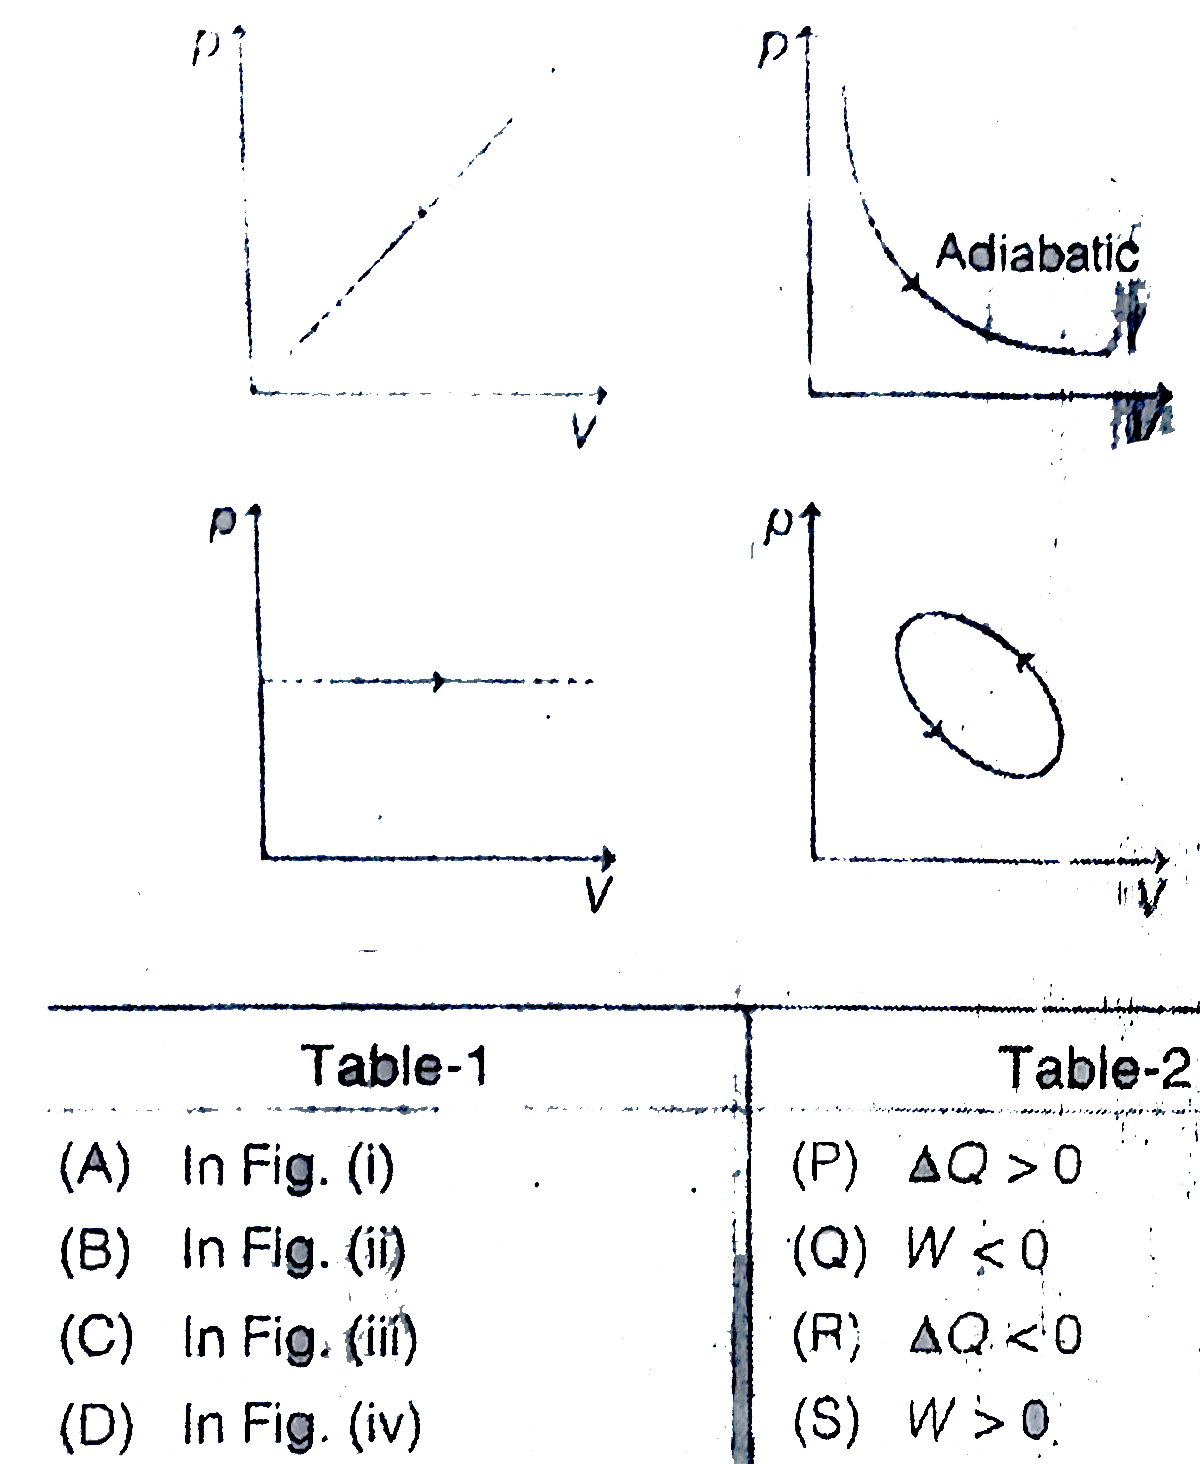
View SolutionThe figures given below show different processes (relating pressure P and volume V) for a given amount of an ideal gas. W is work done by the gas and ΔQ is heat absorbed by the gas.
View Solution
