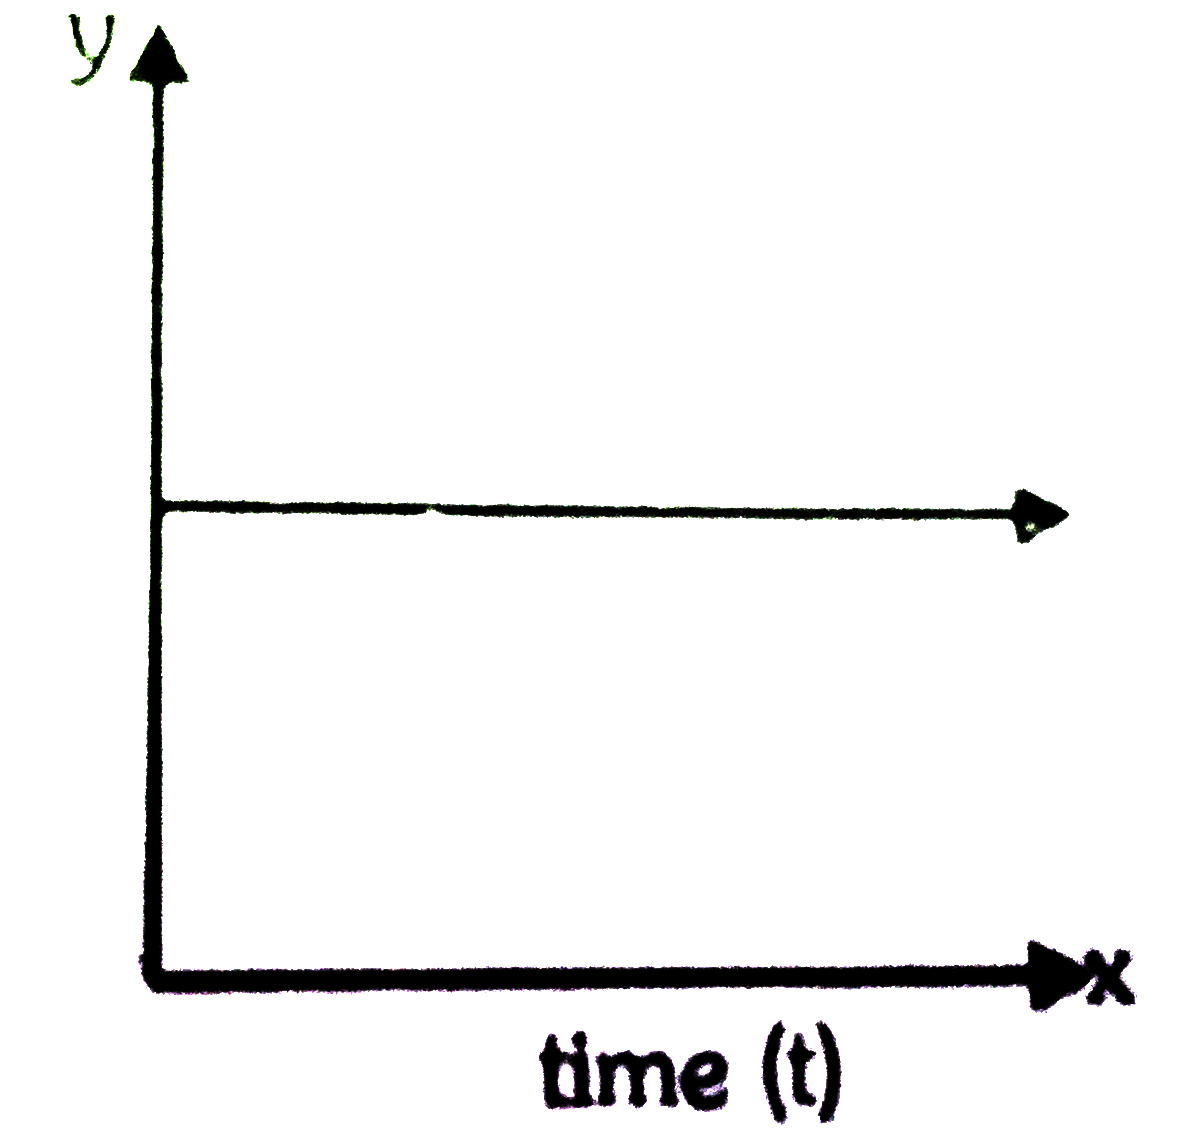
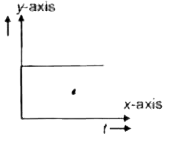
In the graph shown in figure, which quanitity associated with projectile motion is plotted along y-axis ?
Kinetic energy
Momentum
Horizontal velocity
None of these
The correct Answer is:C
Step by step video & image solution for In the graph shown in figure, which quanitity associated with projectile motion is plotted along y-axis ? by Physics experts to help you in doubts & scoring excellent marks in Class 12 exams.
Updated on:21/07/2023Similar Questions
Knowledge Check
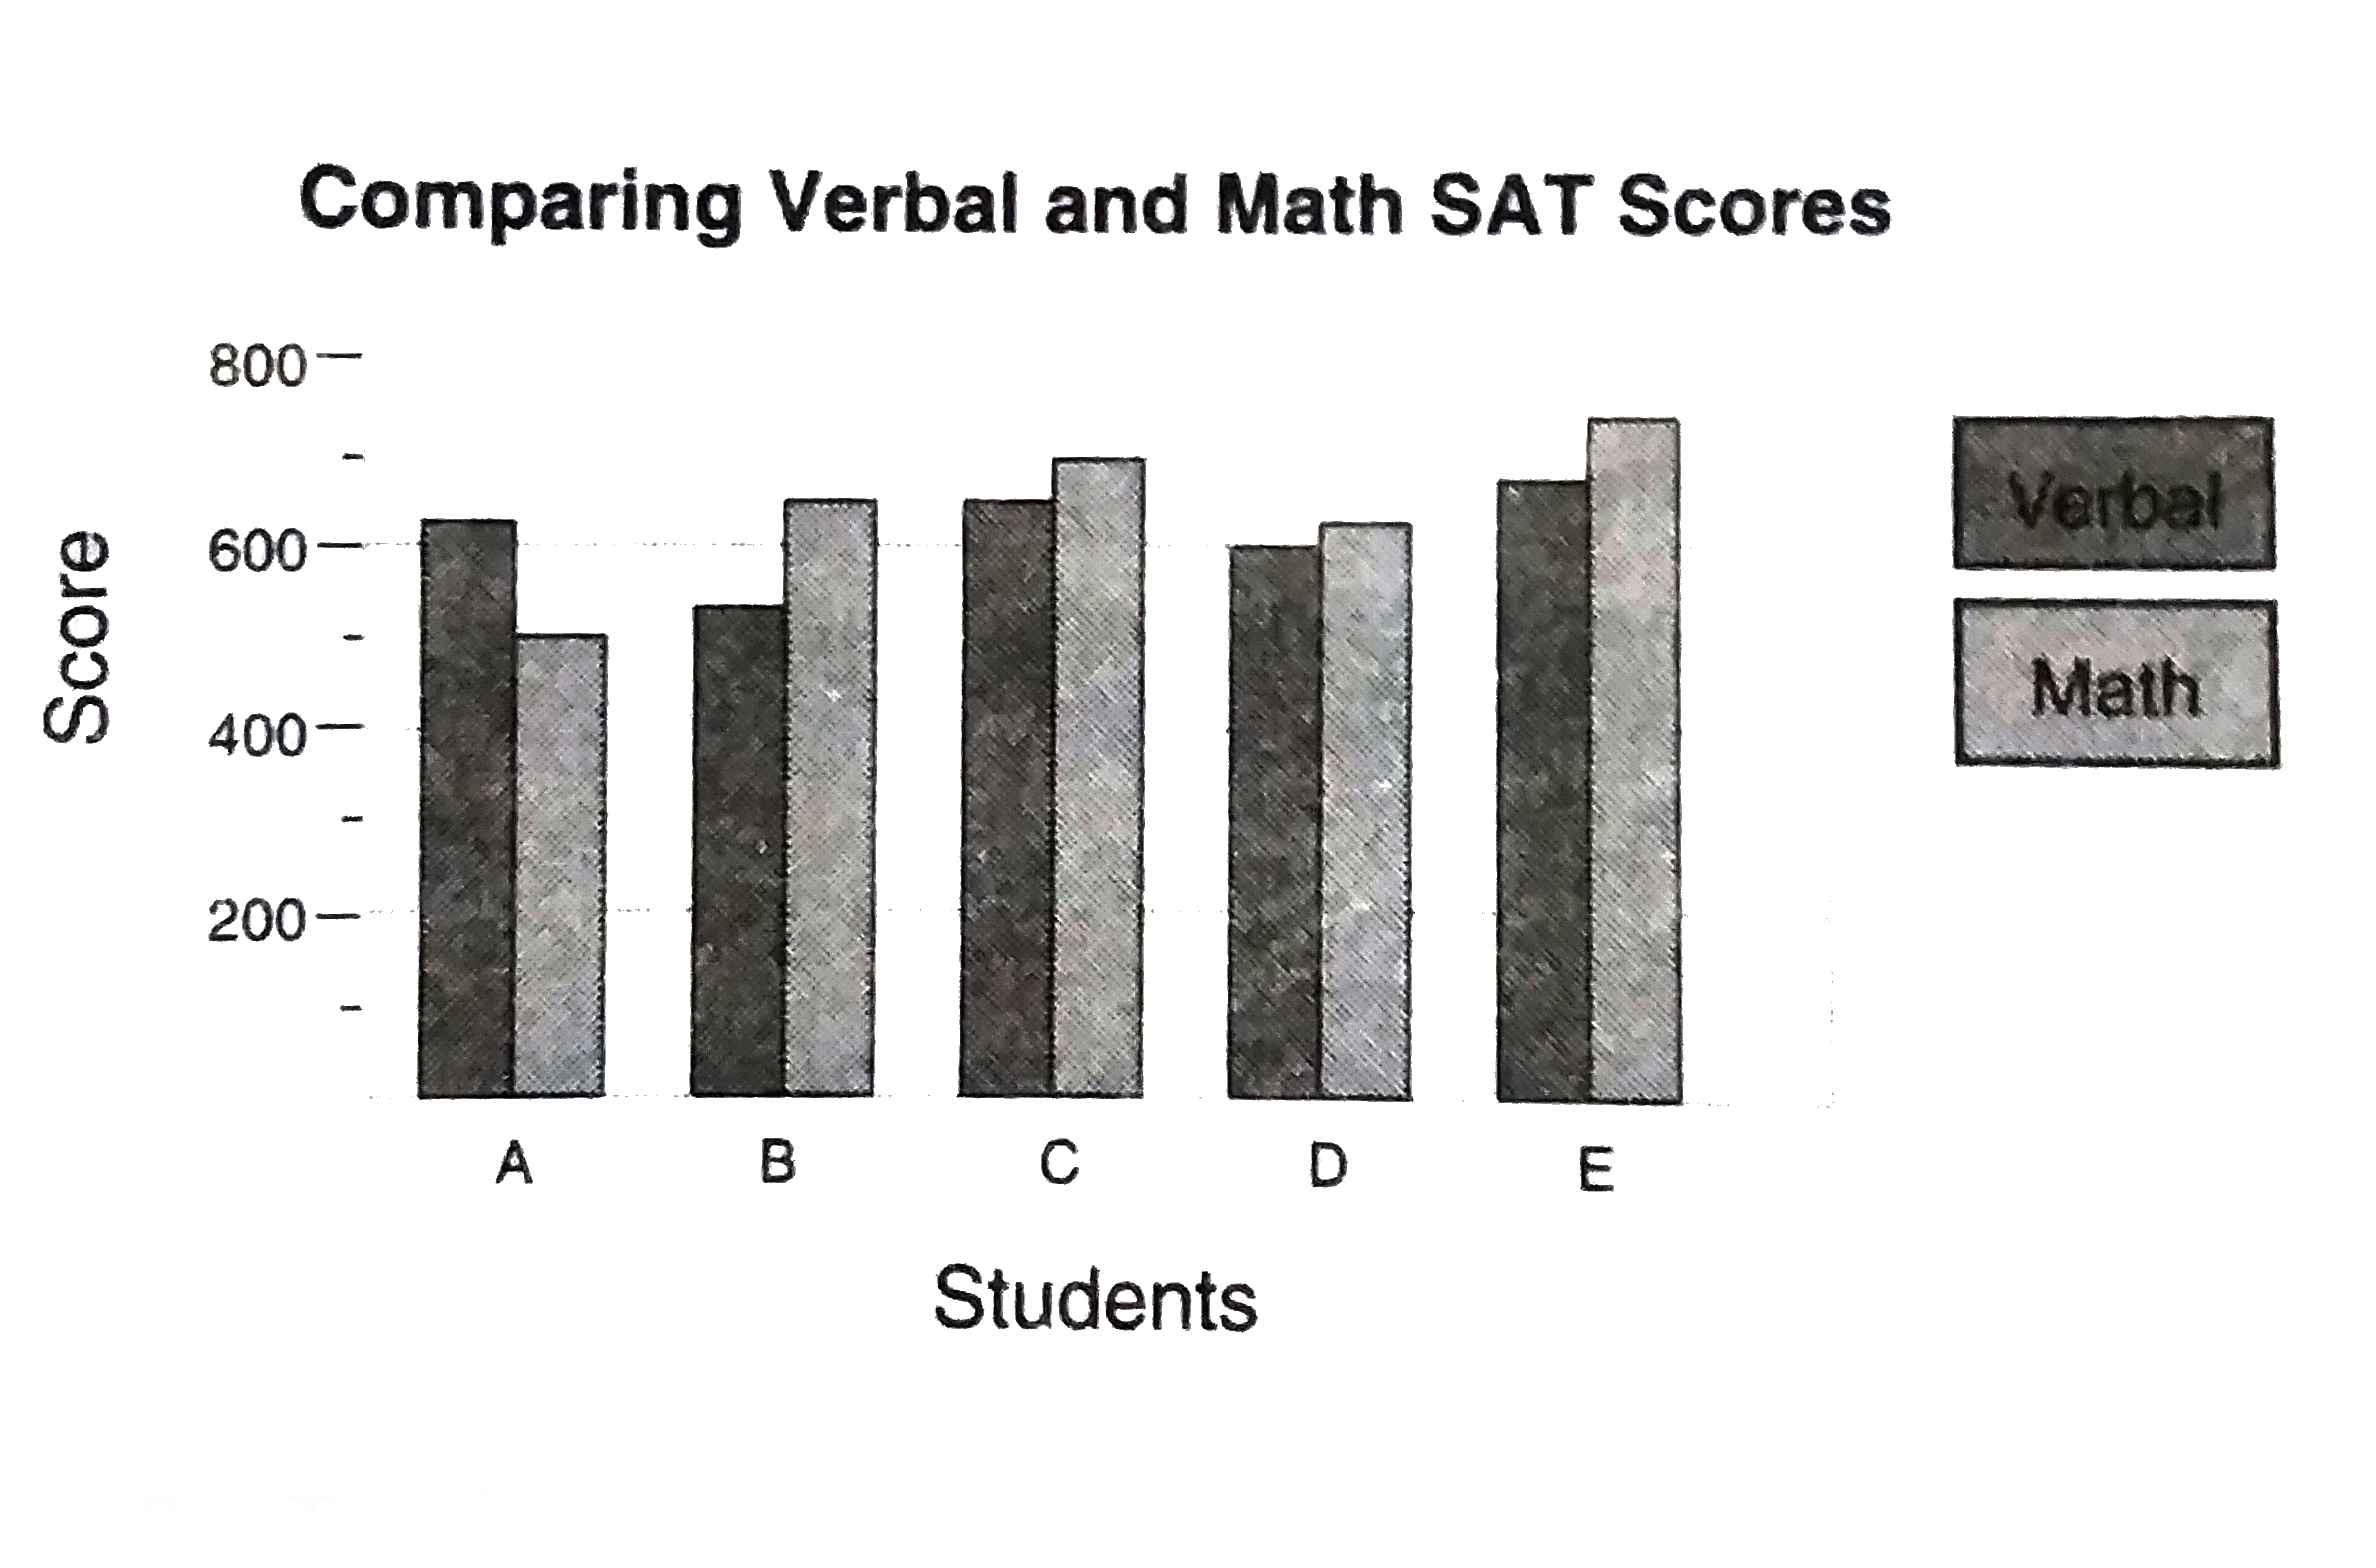
The bar graph above shows the verbal and math SAT scores for five students labeled A through E. If a scatterplot of the data in the bar graph is made such that the math SAT score for each student is plotted along the x-axis and their verbal SAT score is plotted along the y-axis, how many of the data points would lie above the line y=x?A1B2C3D4
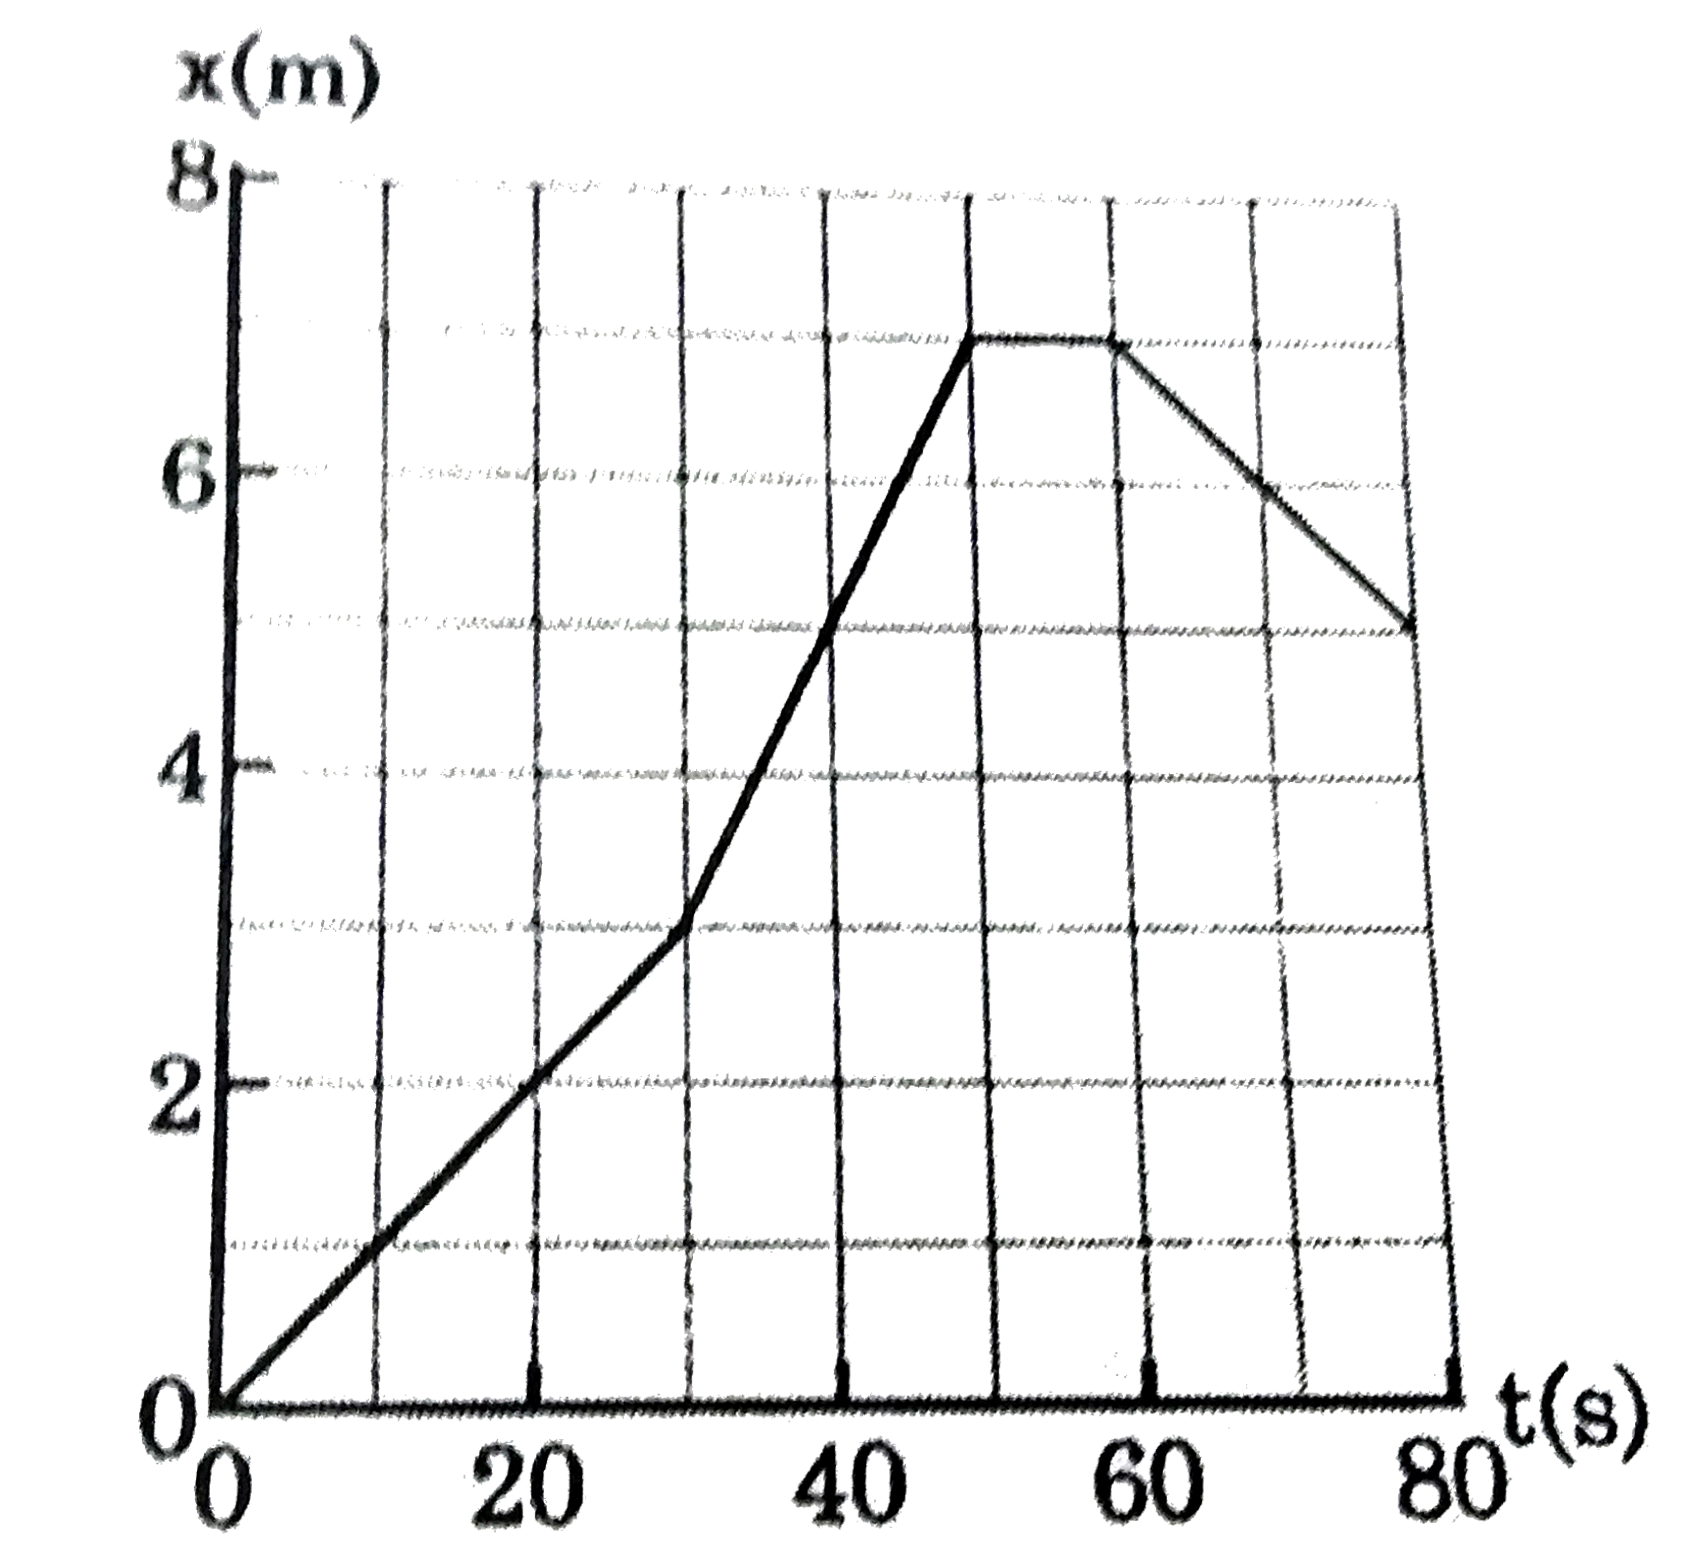
Graph represents motion of an object along X-axis for 80 s :-
View SolutionA non viscous liquid is flowing through a frictionless duct, cross-section varying as shown in figure.

Which of the following graph represents the variation of pressure p along the axis of tube ?
View SolutionA non viscous liquid is flowing through a frictionless duct, cross-section varying as shown in figure.

Which of the following graph represents the variation of pressure p along the axis of tube ?
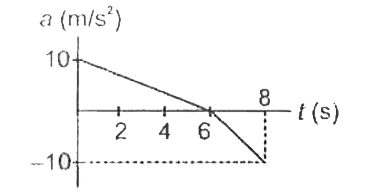
View SolutionThe acceleration - time graph for a particle moving along x - axis is shown in figure, If the initial velocity of particle is −5m/s, the velocity at t = 8 s is
View SolutionIn the figure shown, find.
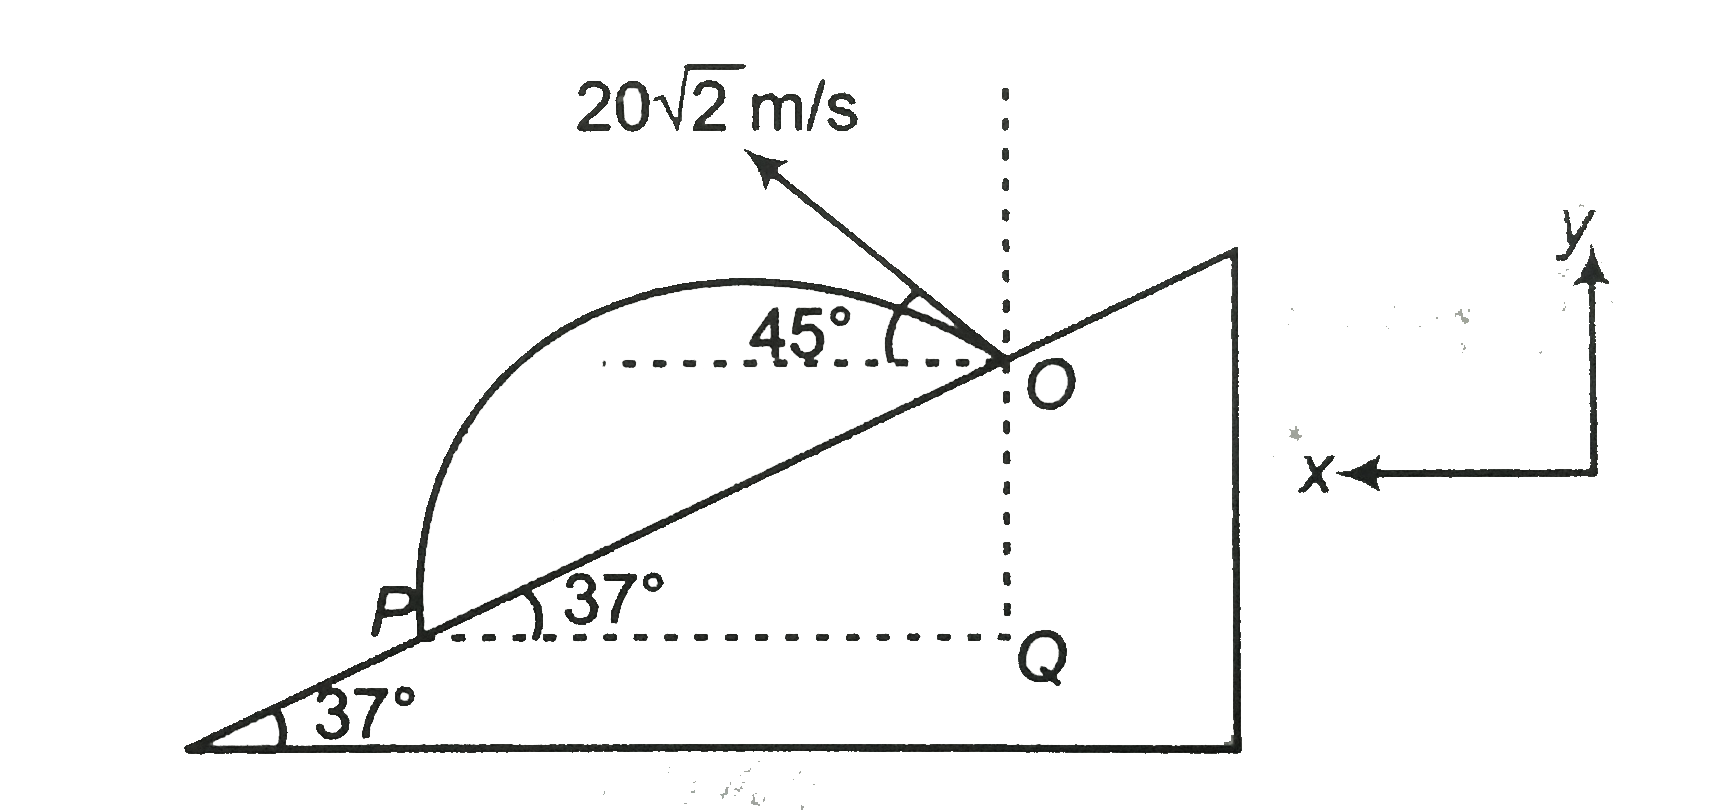
(a) time of flight of the projectile along the inclined plane.
(b) range OP.
View SolutionIn the figure shown, find.
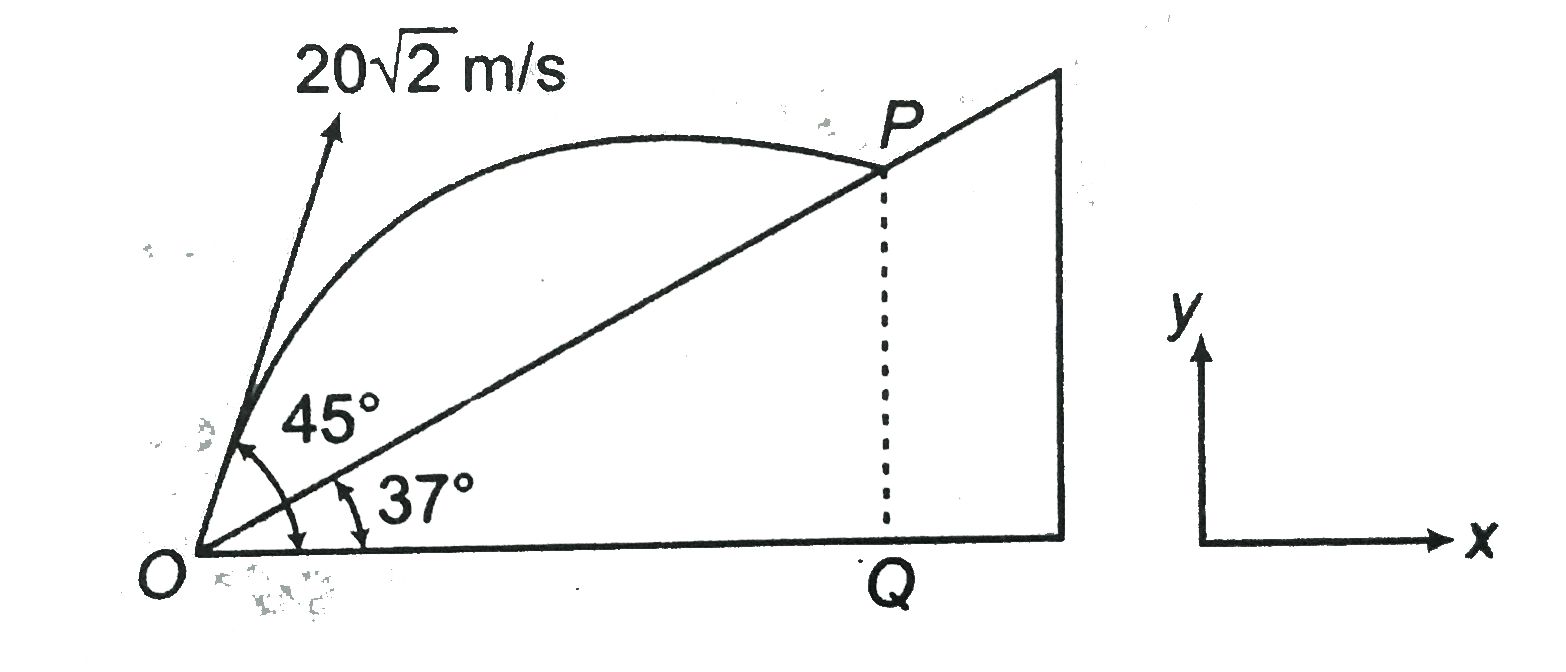
(a) time of flight of the projectile along the inclined plane.
(b) range OP.
View Solutionwhen a constant power is delivered to an object, then the graph between velocity and position of the object is( motion of object is along x-axis)
View Solution

