Which of the following curve represents the variation of λM with √C for AgNO3?
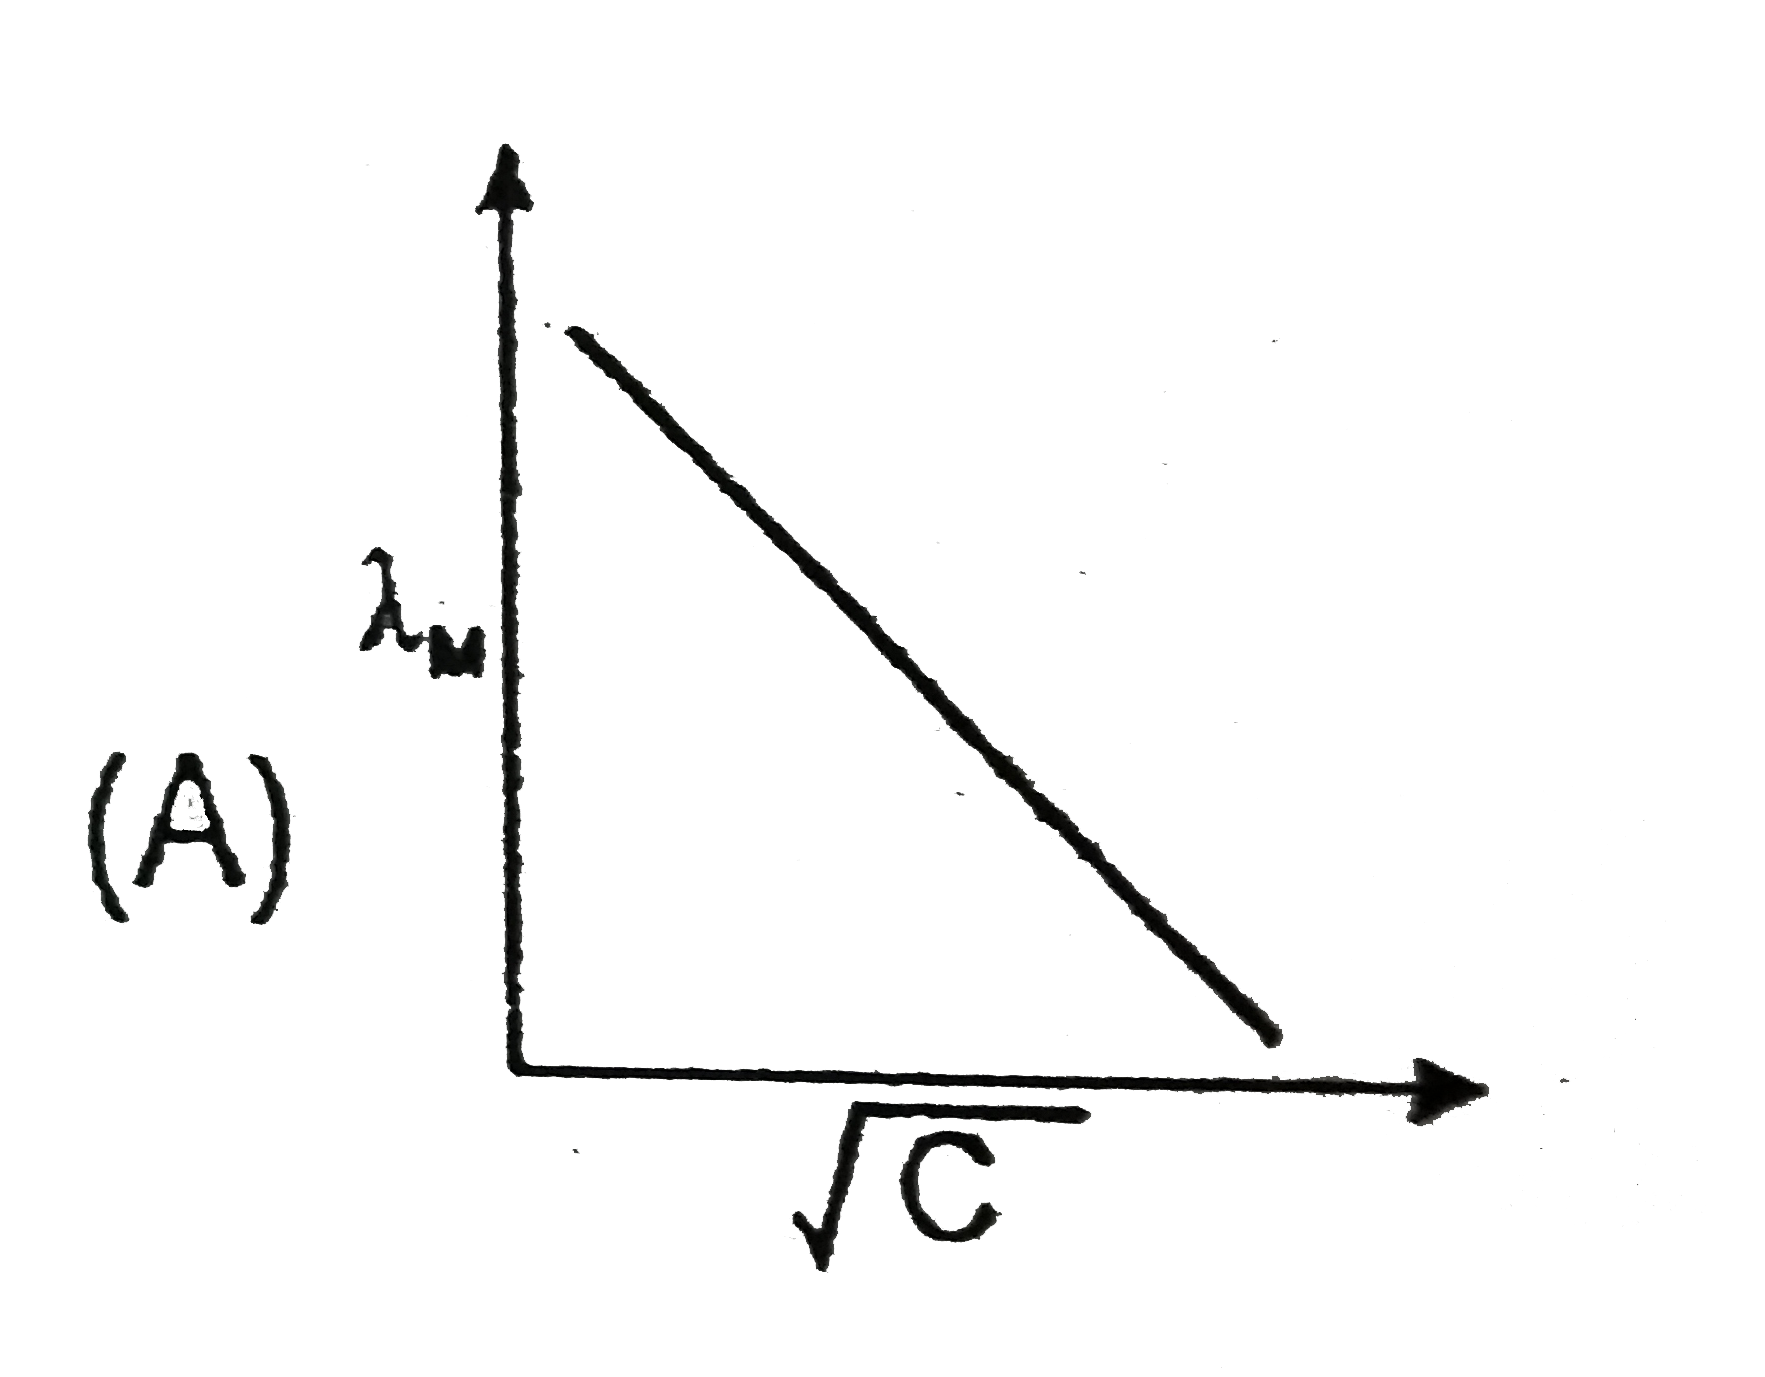
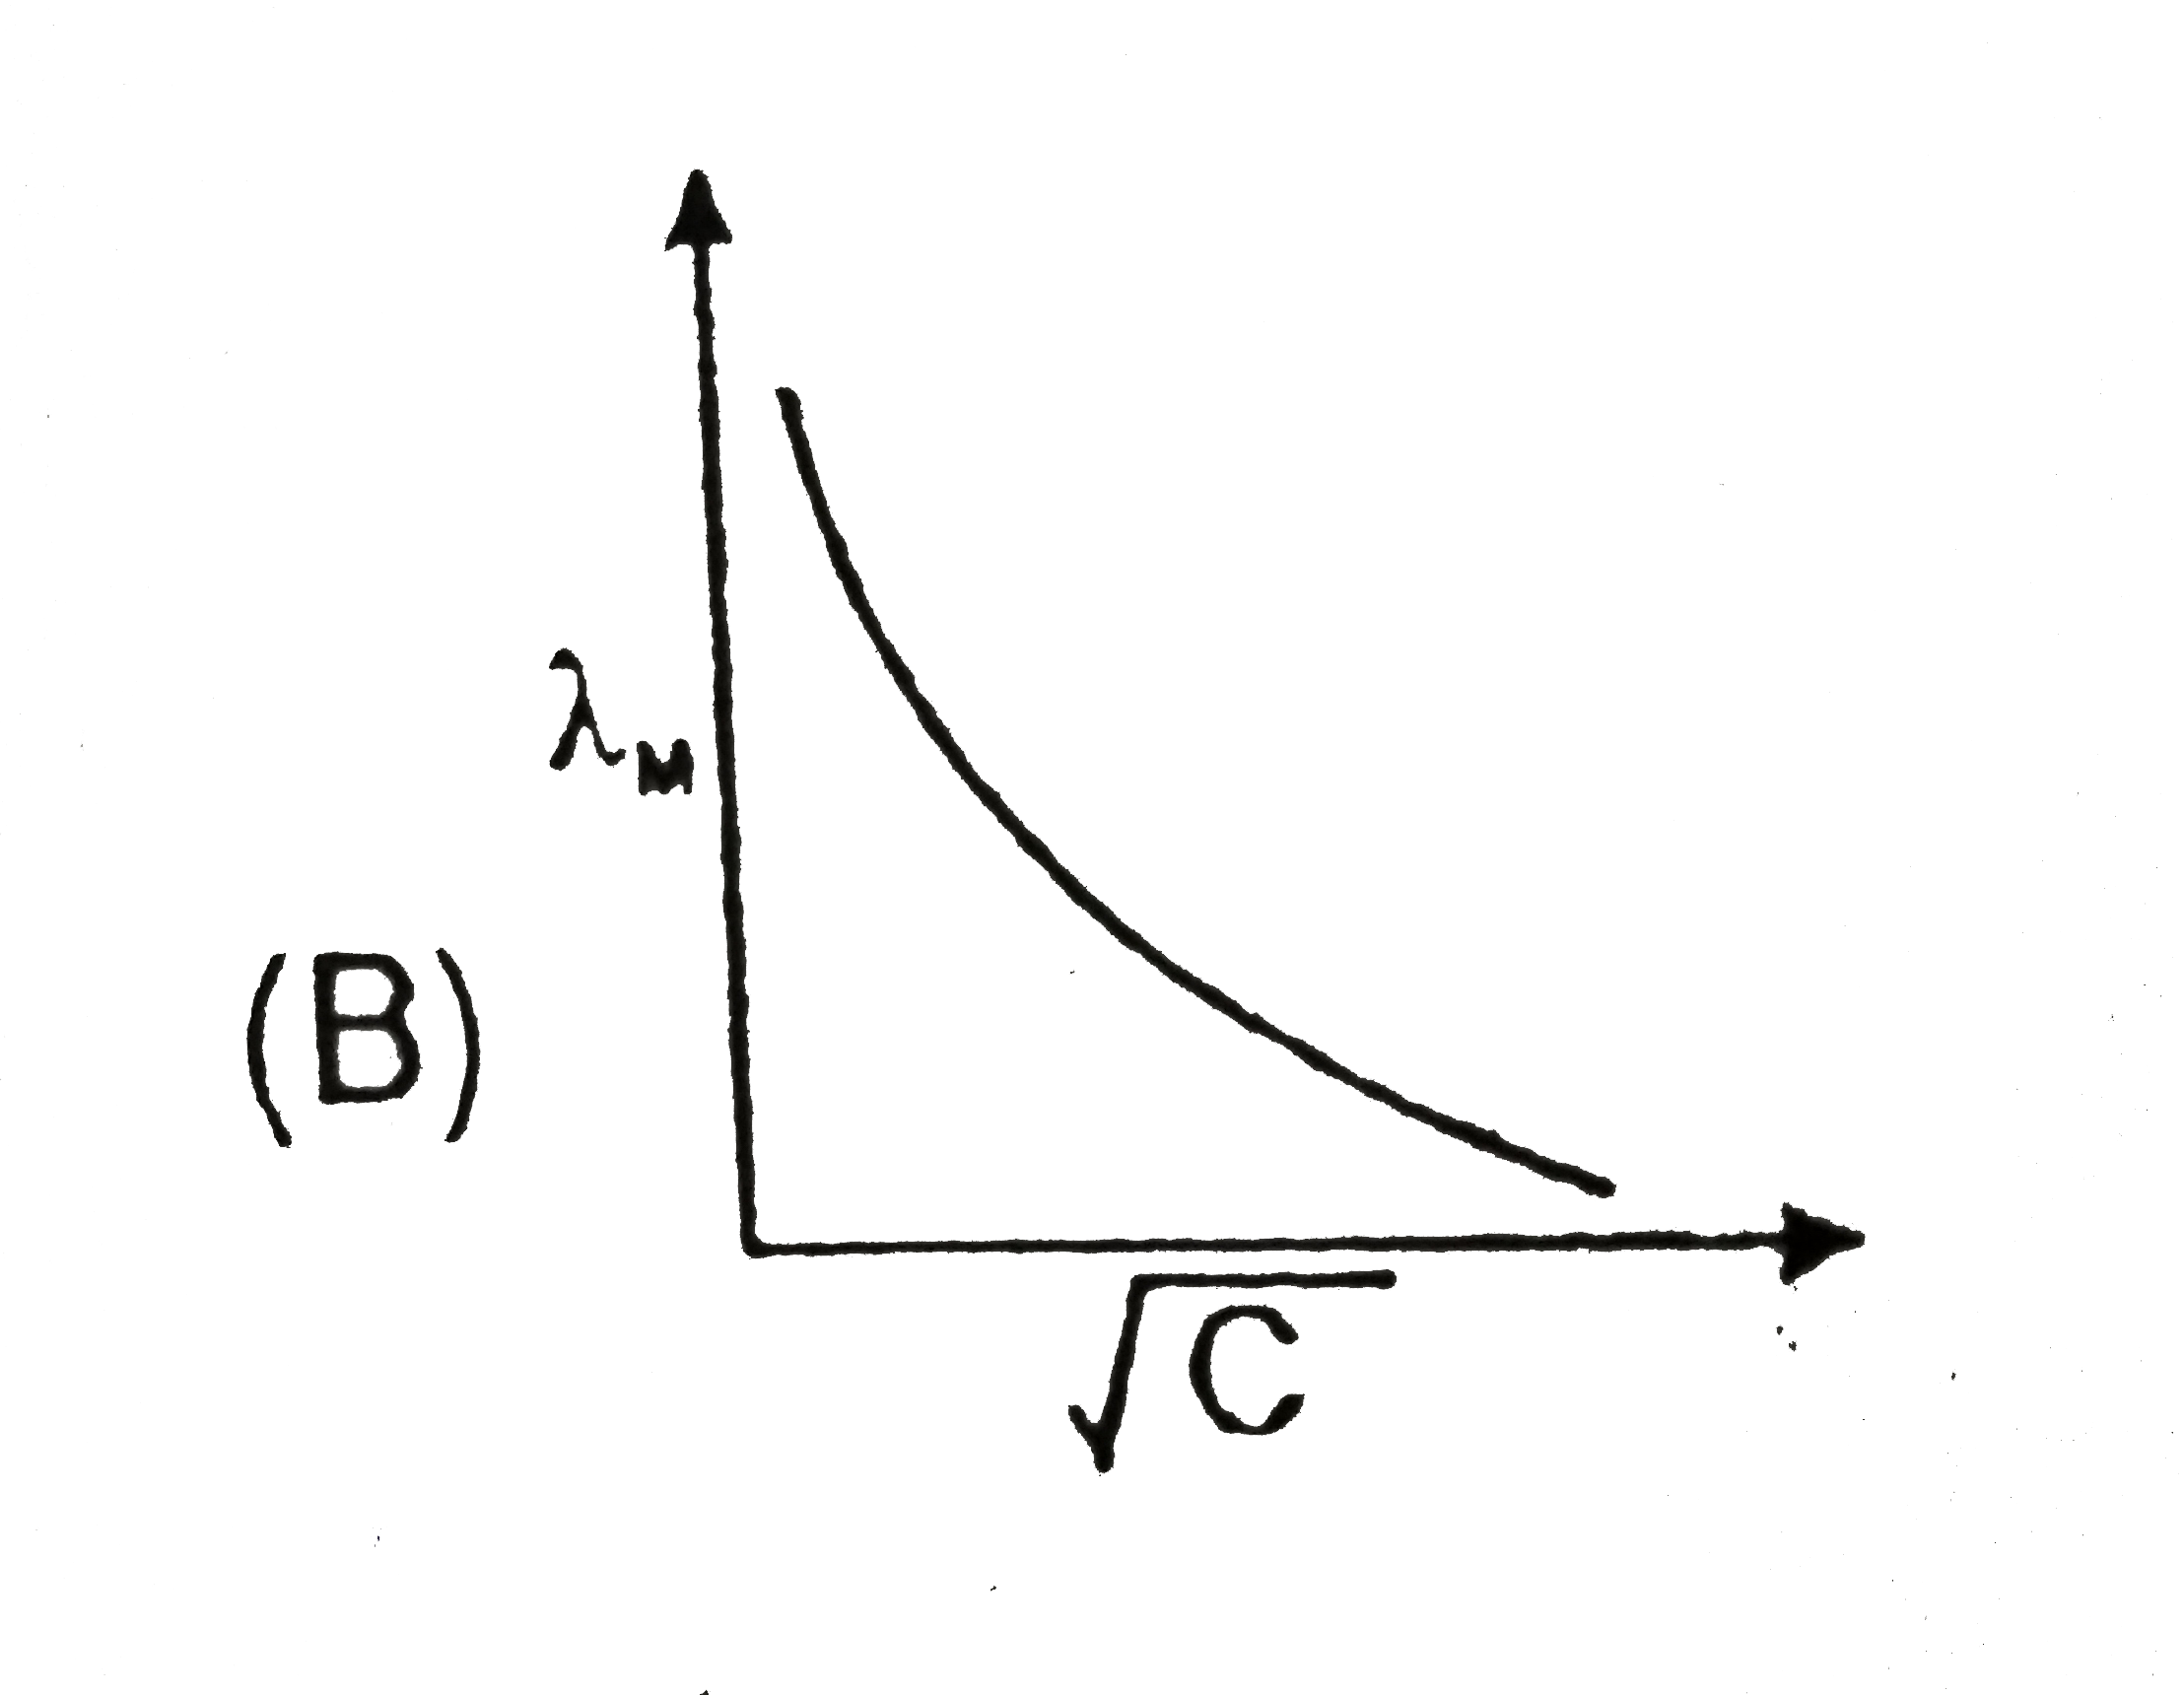
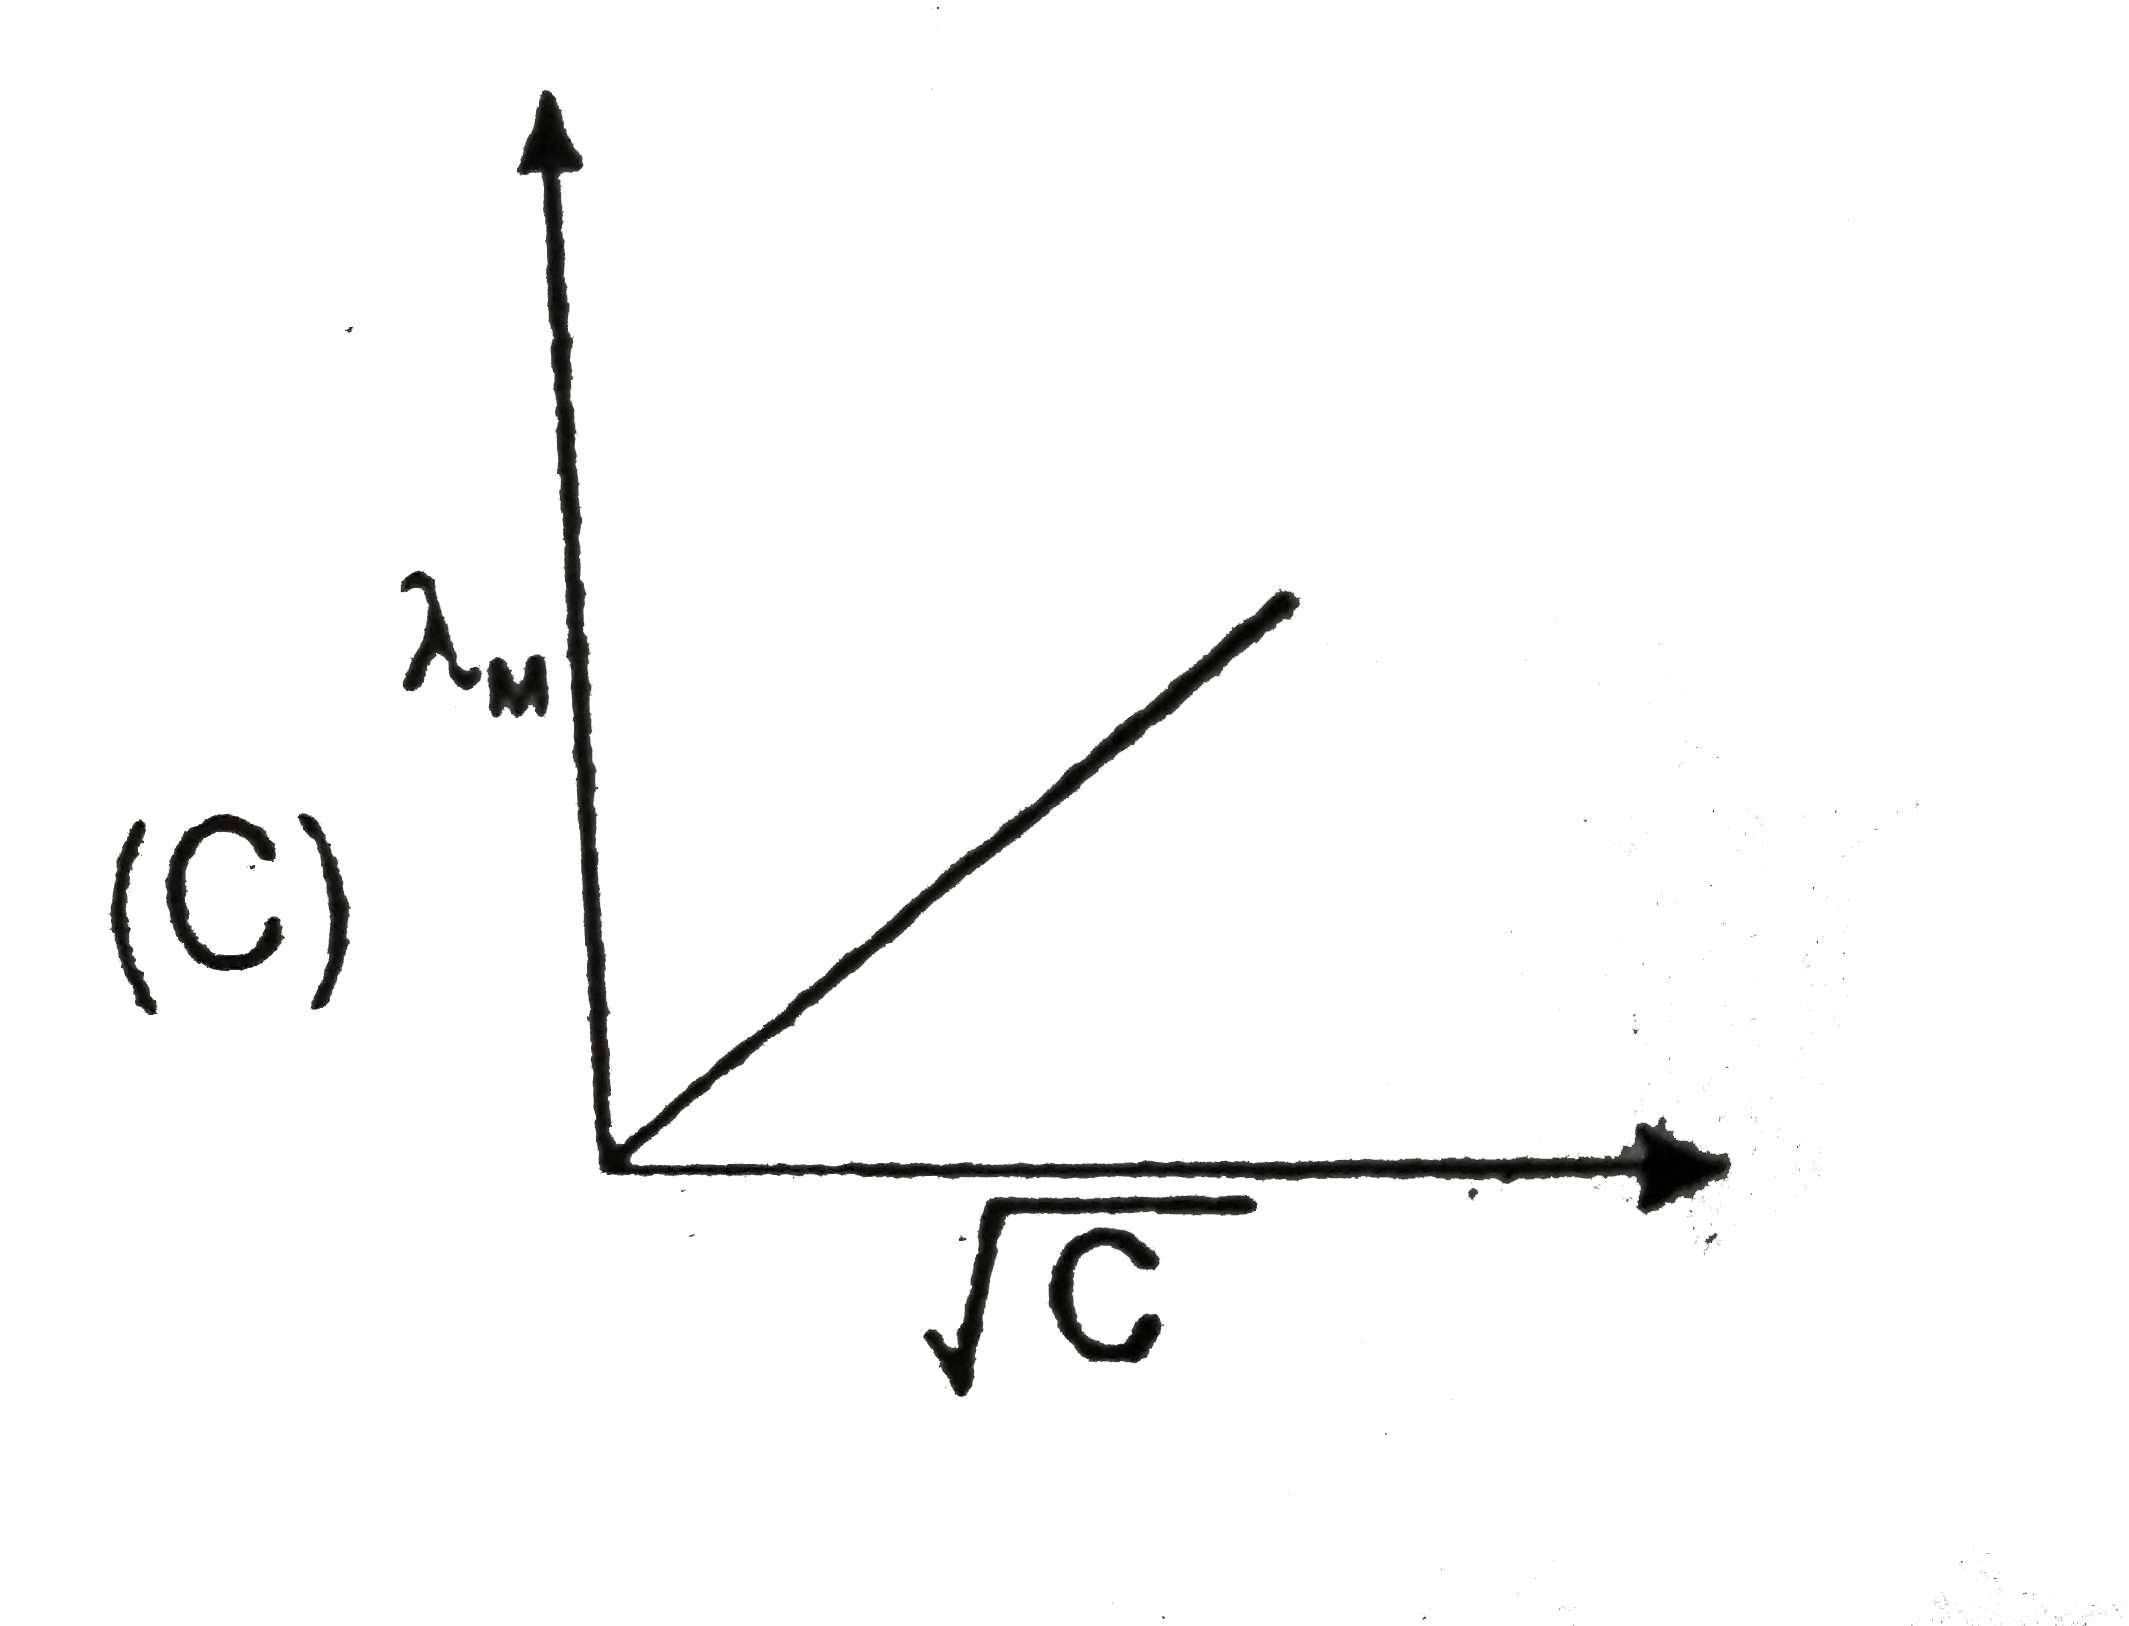
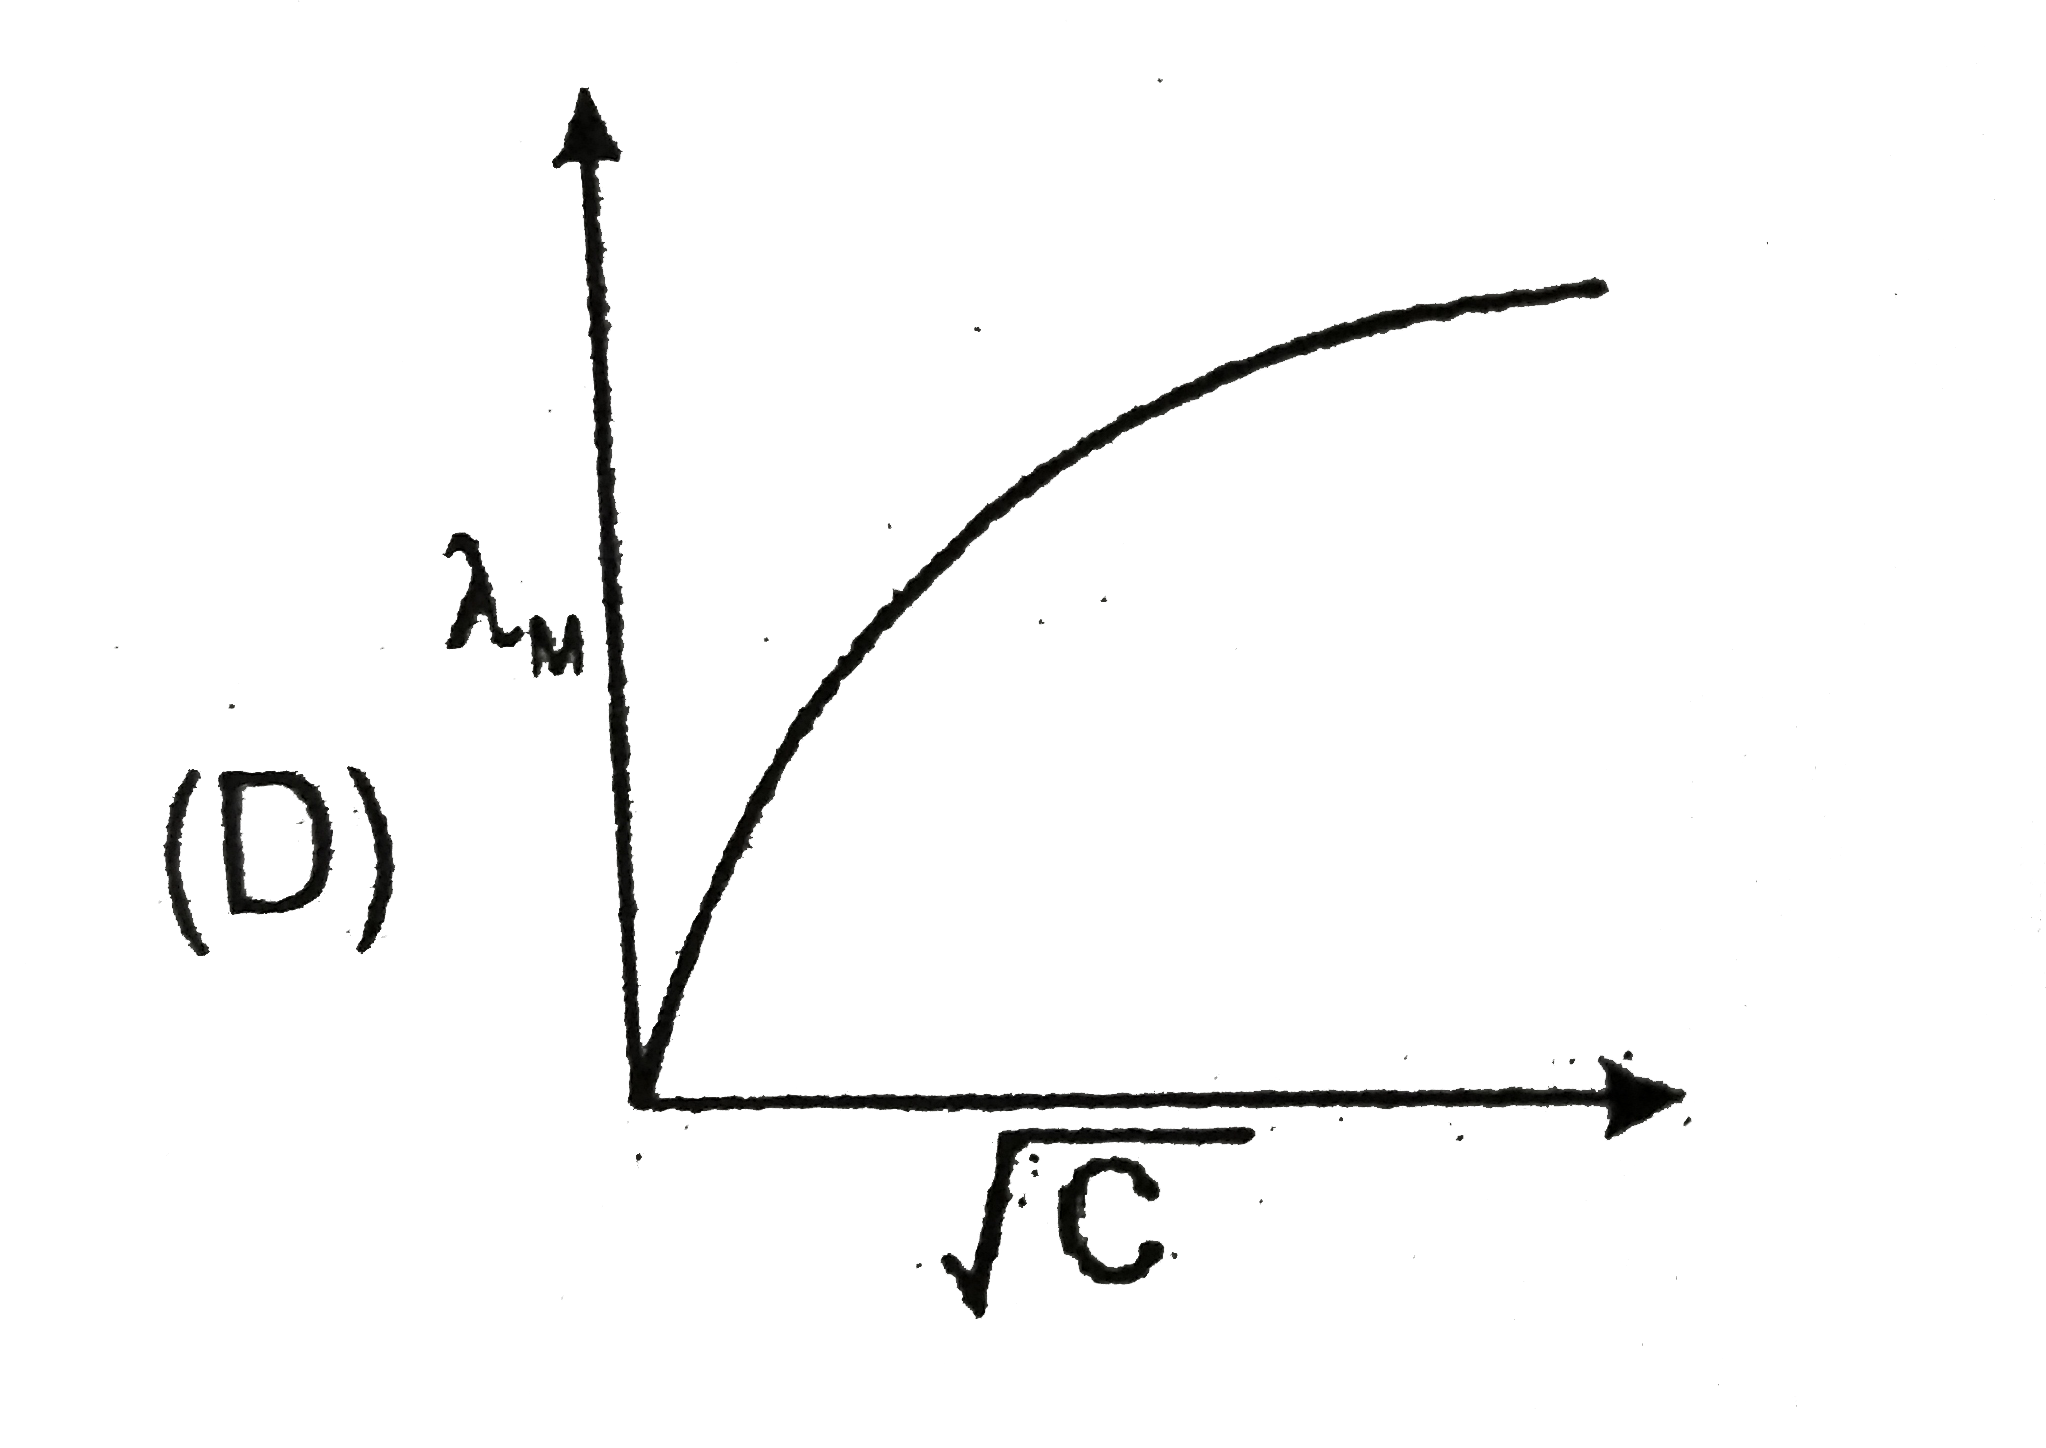
The correct Answer is:A
Step by step video & image solution for Which of the following curve represents the variation of lambda_(M) with sqrt(C) for AgNO_(3)? by Chemistry experts to help you in doubts & scoring excellent marks in Class 12 exams.
Updated on:21/07/2023Topper's Solved these Questions
- ELECTROCHEMISRYBOOK - RESONANCE ENGLISHCHAPTER - ELECTROCHEMISRYEXERCISE - Assertion Reasoning
11 Videos
- ELECTROCHEMISRYBOOK - RESONANCE ENGLISHCHAPTER - ELECTROCHEMISRYEXERCISE - Subjective Questions
14 Videos
- ELECTROCHEMISRYBOOK - RESONANCE ENGLISHCHAPTER - ELECTROCHEMISRYEXERCISE - Board Level Exercise
20 Videos
- ELECTRO CHEMISTRYBOOK - RESONANCE ENGLISHCHAPTER - ELECTRO CHEMISTRYEXERCISE - PHYSICAL CHEMITRY (ELECTROCHEMISTRY)
53 Videos
- EQUIVALENT CONCEPT & TITRATIONSBOOK - RESONANCE ENGLISHCHAPTER - EQUIVALENT CONCEPT & TITRATIONSEXERCISE - Part -IV
22 Videos
Similar Questions
Knowledge Check
Which of the following curve gives the variation of Λmwith√C for CH3COOH ?
A B
B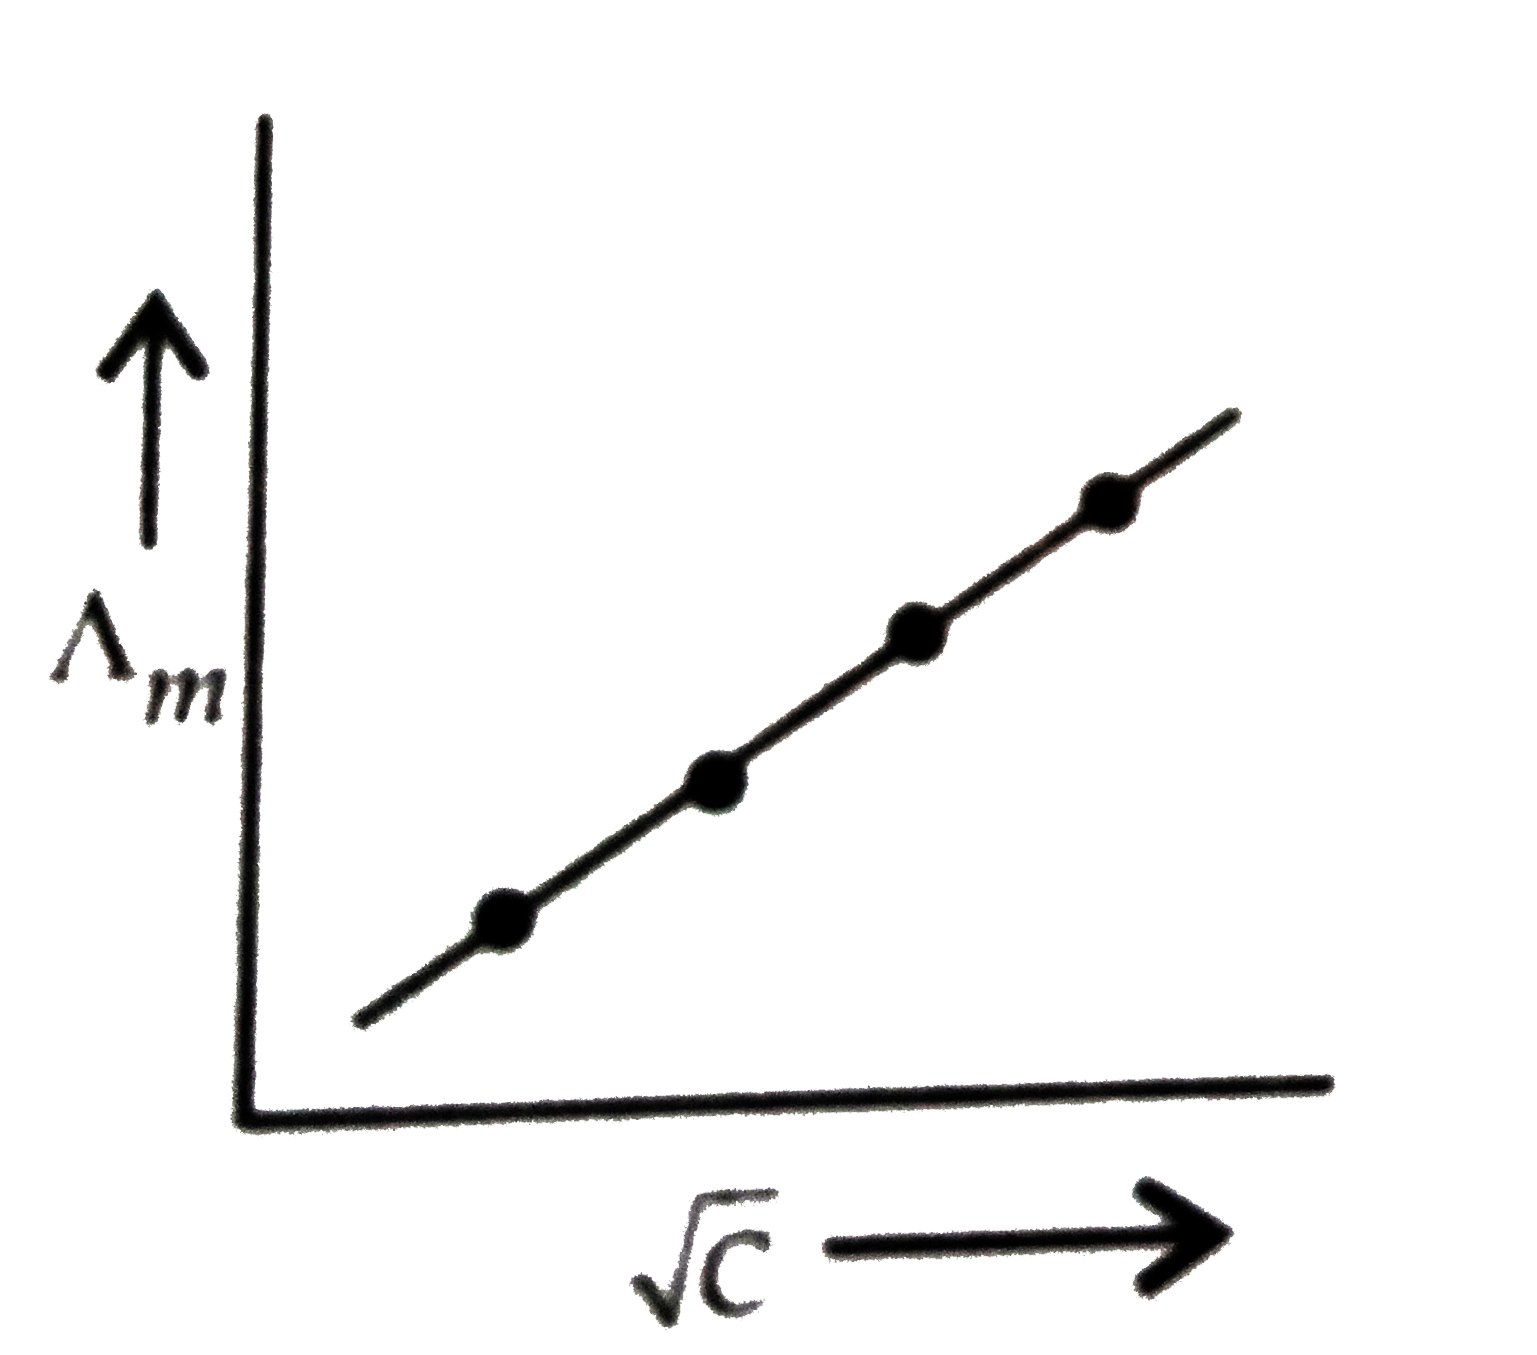 C
C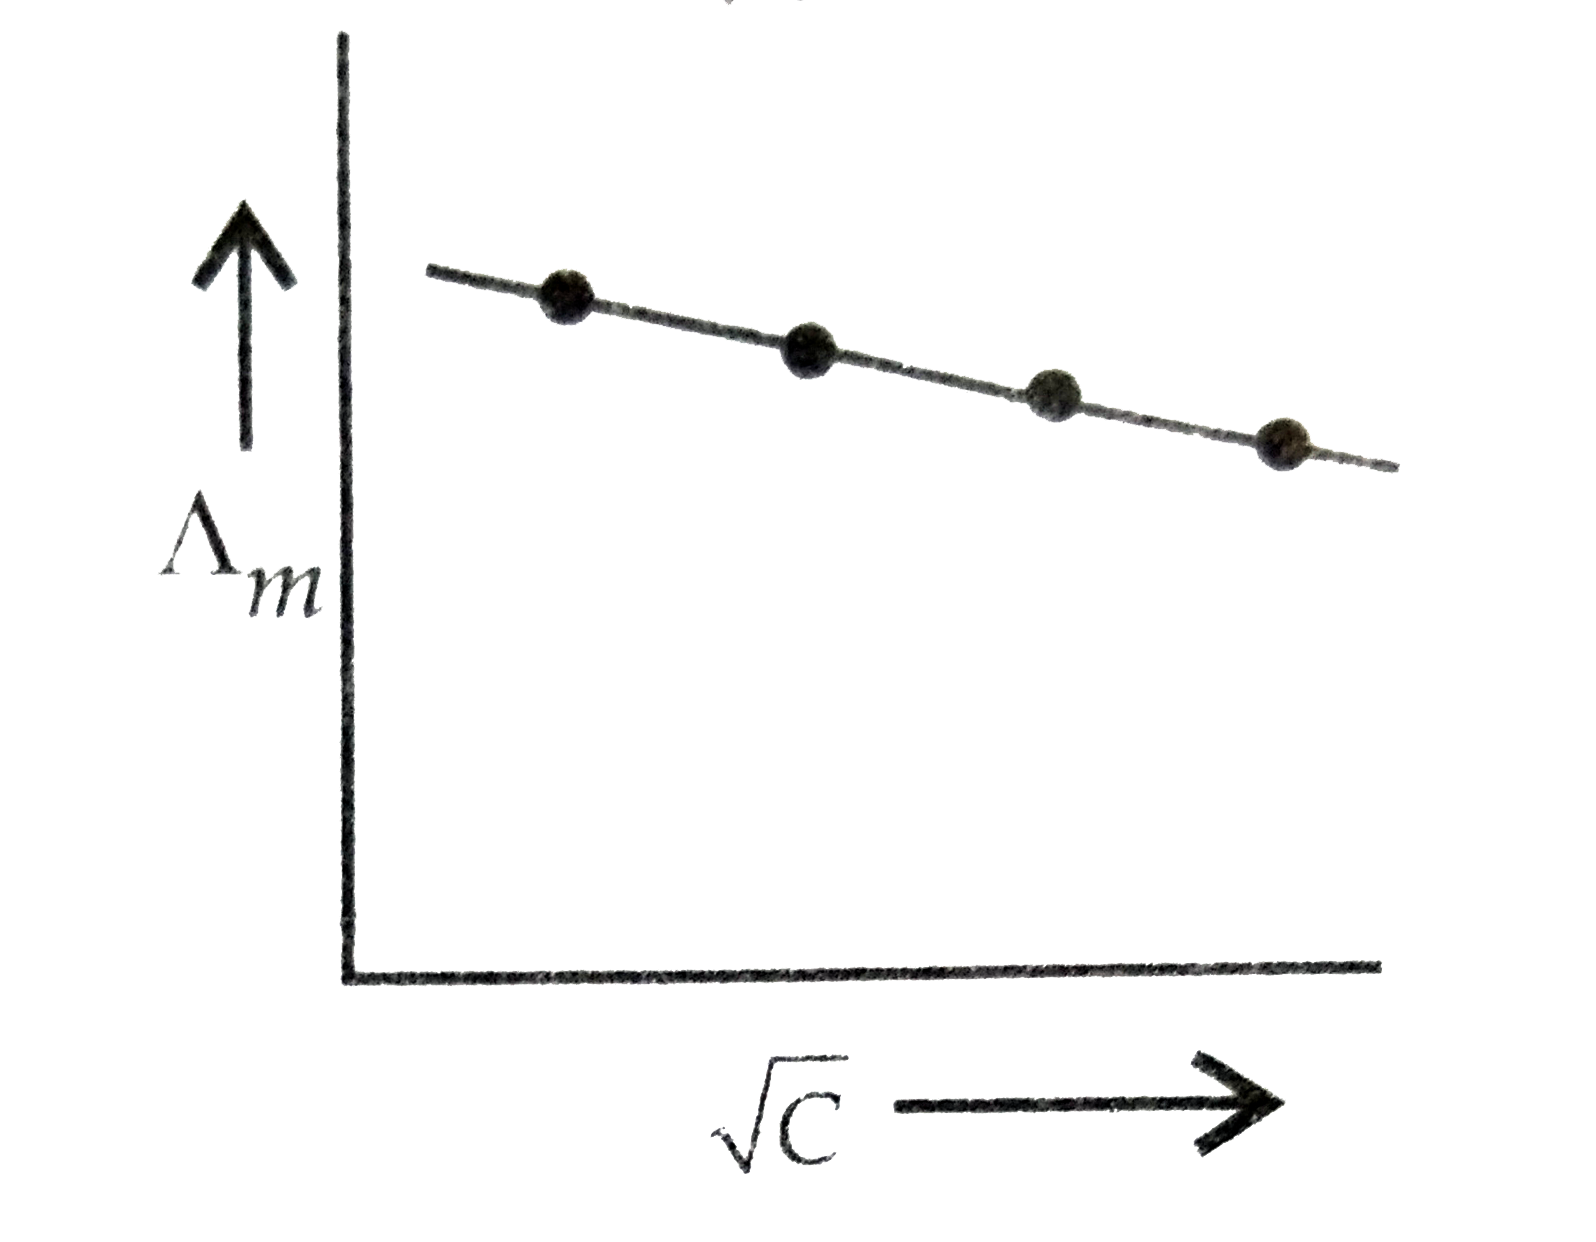 DNone of these
Which of the following may represent the curve x = 2y+ 3?
View SolutionWhich of the following graphs correctly represents the variation of g on the - Earth?
View SolutionA point source of light is used in an experiment on photoelectric effect . Which of the following curves best represents the variation of photo current (i) with distance (d) of the source from the emitter ?

View SolutionWhich of the following curve represent variation of density of water with temperature best-
View SolutionWhich of the following represents logistic growth curve?
View SolutionWhich of the following can represent the curve x2=−2y ?
View SolutionWhich of the following curve will represent the variation of conductance C during titration of CH3COOH by gradual addition of NaOH solution (V)
View Solution
