A particle falls from a height h and rebounds to a height h1(h1<h), then which of the graph represents the motion correct ?
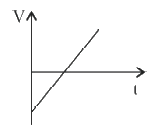
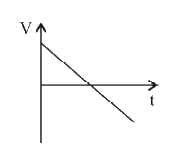
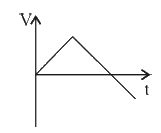
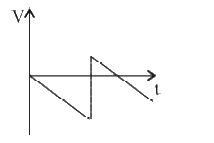
The correct Answer is:B
To solve the problem of determining which graph represents the motion of a particle falling from height h and rebounding to height h1 (where h1<h), we will analyze the motion step by step.
Step 1: Understand the Motion
The particle falls freely from height h under the influence of gravity. Initially, it has zero velocity and accelerates downwards due to gravity.
Step 2: Analyze the Falling Motion
When the particle is falling, its velocity v can be expressed as:
v=−gt
where g is the acceleration due to gravity and t is the time of fall. The negative sign indicates that the velocity is directed downwards.
Step 3: Identify the Velocity During Fall
As the particle falls, its velocity increases in the negative direction (downwards). Therefore, during this phase, the graph of velocity vs. time should show a line with a negative slope starting from zero and moving downwards.
Step 4: Analyze the Rebound Motion
Upon reaching the ground, the particle rebounds to a height h1. The rebound is not elastic, meaning it does not reach the original height h. The velocity just before the rebound is negative (downward), and upon hitting the ground, it instantaneously changes direction to positive.
Step 5: Express the Velocity During Rebound
For the upward motion after the rebound, the velocity can be expressed as:
v=u−gt
where u is the initial velocity at the moment of rebound (which is now positive). The particle will decelerate until it reaches the peak height h1 where the velocity will be zero.
Step 6: Identify the Velocity During Rebound
During the rebound phase, the velocity starts from a positive value and decreases to zero as the particle reaches the maximum height h1. Thus, the graph should show a line starting from a positive value and decreasing to zero.
Step 7: Combine Both Phases
The complete motion consists of two parts:
1. A downward motion with negative velocity increasing in magnitude.
2. An upward motion starting from a positive velocity and decreasing to zero.
Step 8: Determine the Correct Graph
From the analysis, the correct graph should:
- Start from zero, go downwards (negative velocity) as time increases during the fall.
- Then, instantaneously change direction at the ground (velocity becomes positive).
- Finally, decrease to zero as it reaches the height h1.
Conclusion
The graph that represents this motion correctly is the one that shows negative velocity during the fall and a positive velocity that decreases to zero during the rebound.
The particle falls freely from height h under the influence of gravity. Initially, it has zero velocity and accelerates downwards due to gravity.
When the particle is falling, its velocity v can be expressed as:
v=−gt
where g is the acceleration due to gravity and t is the time of fall. The negative sign indicates that the velocity is directed downwards.
As the particle falls, its velocity increases in the negative direction (downwards). Therefore, during this phase, the graph of velocity vs. time should show a line with a negative slope starting from zero and moving downwards.
Upon reaching the ground, the particle rebounds to a height h1. The rebound is not elastic, meaning it does not reach the original height h. The velocity just before the rebound is negative (downward), and upon hitting the ground, it instantaneously changes direction to positive.
For the upward motion after the rebound, the velocity can be expressed as:
v=u−gt
where u is the initial velocity at the moment of rebound (which is now positive). The particle will decelerate until it reaches the peak height h1 where the velocity will be zero.
During the rebound phase, the velocity starts from a positive value and decreases to zero as the particle reaches the maximum height h1. Thus, the graph should show a line starting from a positive value and decreasing to zero.
The complete motion consists of two parts:
1. A downward motion with negative velocity increasing in magnitude.
2. An upward motion starting from a positive velocity and decreasing to zero.
From the analysis, the correct graph should:
- Start from zero, go downwards (negative velocity) as time increases during the fall.
- Then, instantaneously change direction at the ground (velocity becomes positive).
- Finally, decrease to zero as it reaches the height h1.
The graph that represents this motion correctly is the one that shows negative velocity during the fall and a positive velocity that decreases to zero during the rebound.
Topper's Solved these Questions
- MOTION IN A STRAIGHT LINE & PLANE BOOK - VMC MODULES ENGLISHCHAPTER - MOTION IN A STRAIGHT LINE & PLANE EXERCISE - EFFICIENT
50 Videos
- MOTION IN A STRAIGHT LINE & PLANE BOOK - VMC MODULES ENGLISHCHAPTER - MOTION IN A STRAIGHT LINE & PLANE EXERCISE - IMPECCABLE
52 Videos
- MOTION IN A STRAIGHT LINE & PLANE BOOK - VMC MODULES ENGLISHCHAPTER - MOTION IN A STRAIGHT LINE & PLANE EXERCISE - IMPECCABLE
52 Videos
- MOCK TEST 9BOOK - VMC MODULES ENGLISHCHAPTER - MOCK TEST 9EXERCISE - PHYSICS (SECTION 2)
5 Videos
- Motion in Straight Line BOOK - VMC MODULES ENGLISHCHAPTER - Motion in Straight Line EXERCISE - IN-CHAPTER EXERCISE-J
10 Videos
Similar Questions
A rubber ball falls from a height h and rebounds to a height h/2. A rubber ball of double the mass falling from the same height h rebounds to a height
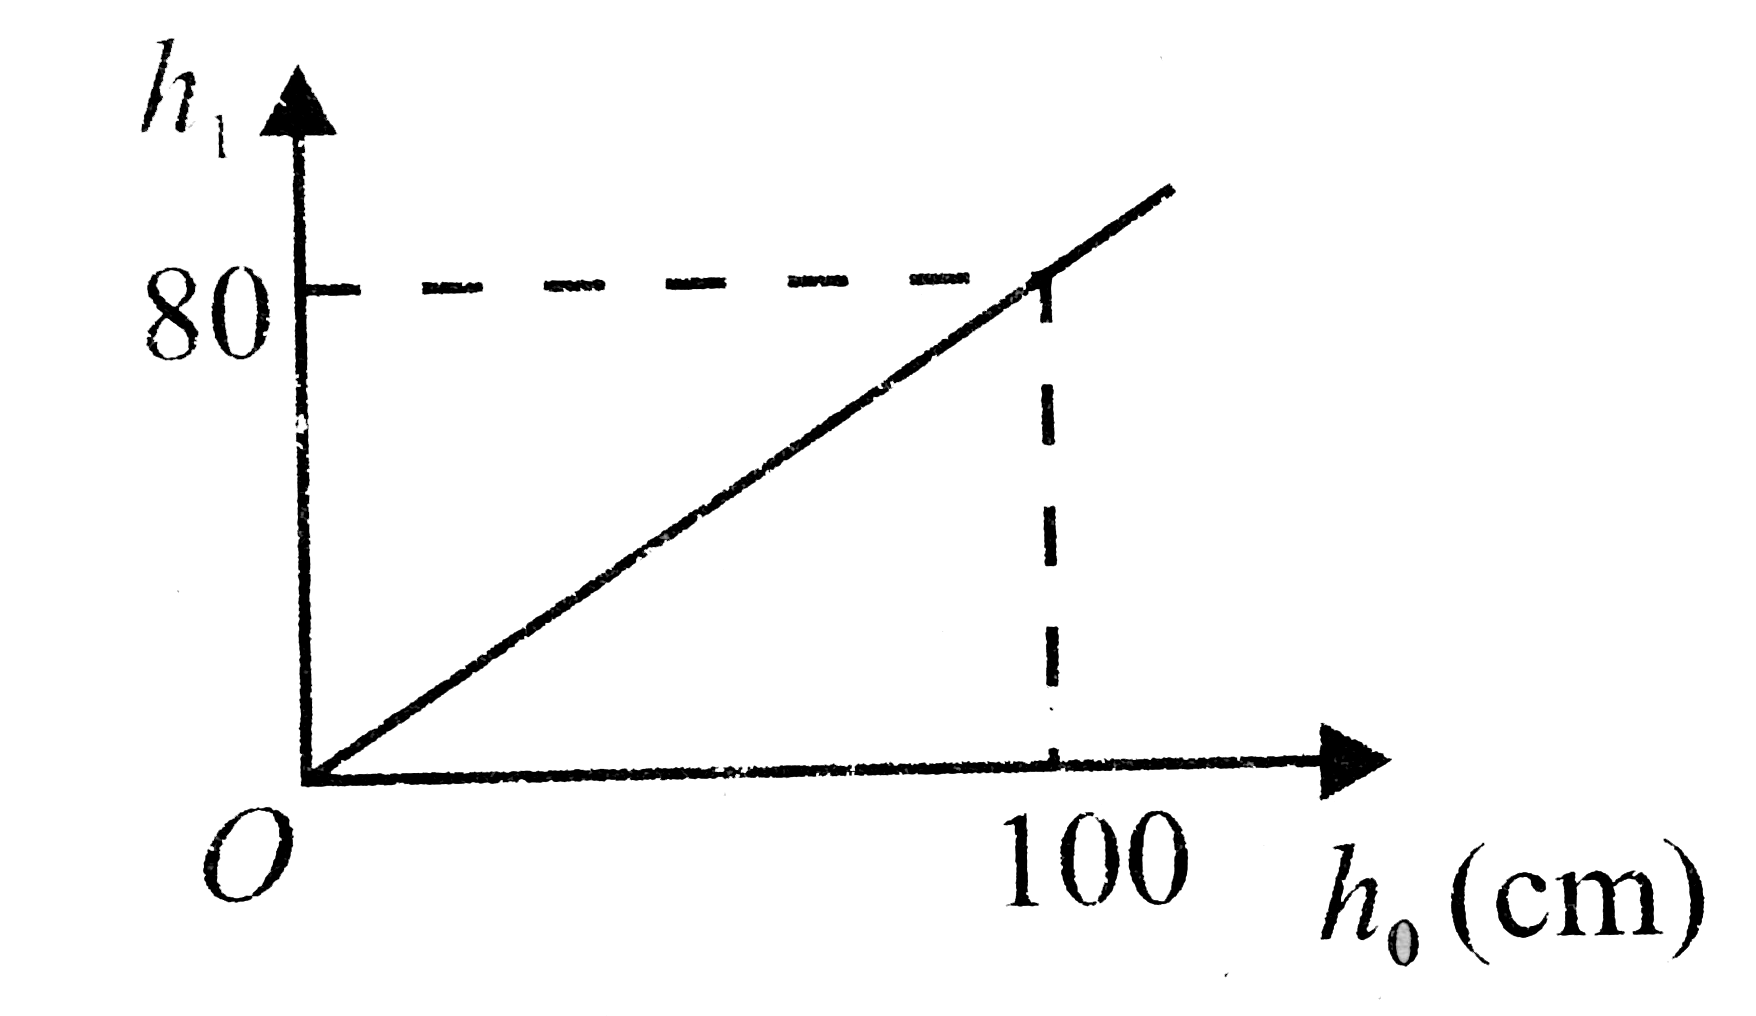
View SolutionA ball released from a height ho above a horizontal surface rebounds to a height h1, after one bounce. The graph that relates h0 to h1 is shown Fig. If the ball (of the mass m) was dropped from an initial height h and made three bounces, the kinetic energy of the ball immediately after the third impact with the surface was
View Solution
Knowledge Check
A particle is droped from a height H. The de-broglie wavelength of the particle as a function of height is proportional to
AHBH1/2CH0DH−1/2
A body of mass m falls from a height h1 and rises to a height h2. The magnitude of the change in momentum during the impact with the ground.
View SolutionA ball is dropped on a horizontal surface from height h. If it rebounds upto height h2 after first collision then coefficient of restitution between ball and surface is
View SolutionA partical falls from a height h upon a fixed horizontal plane and rebounds. If e is the coefficient of restitution, the total distance travelled before rebounding has stopped is
View SolutionA Tennis ball is released from a height h and after freely falling on a wooden floor it rebounds and reaches height h2. The velocity versus height of the ball during its motion may be represented graphically by :
(graph are drawn schematically and on not to scale )
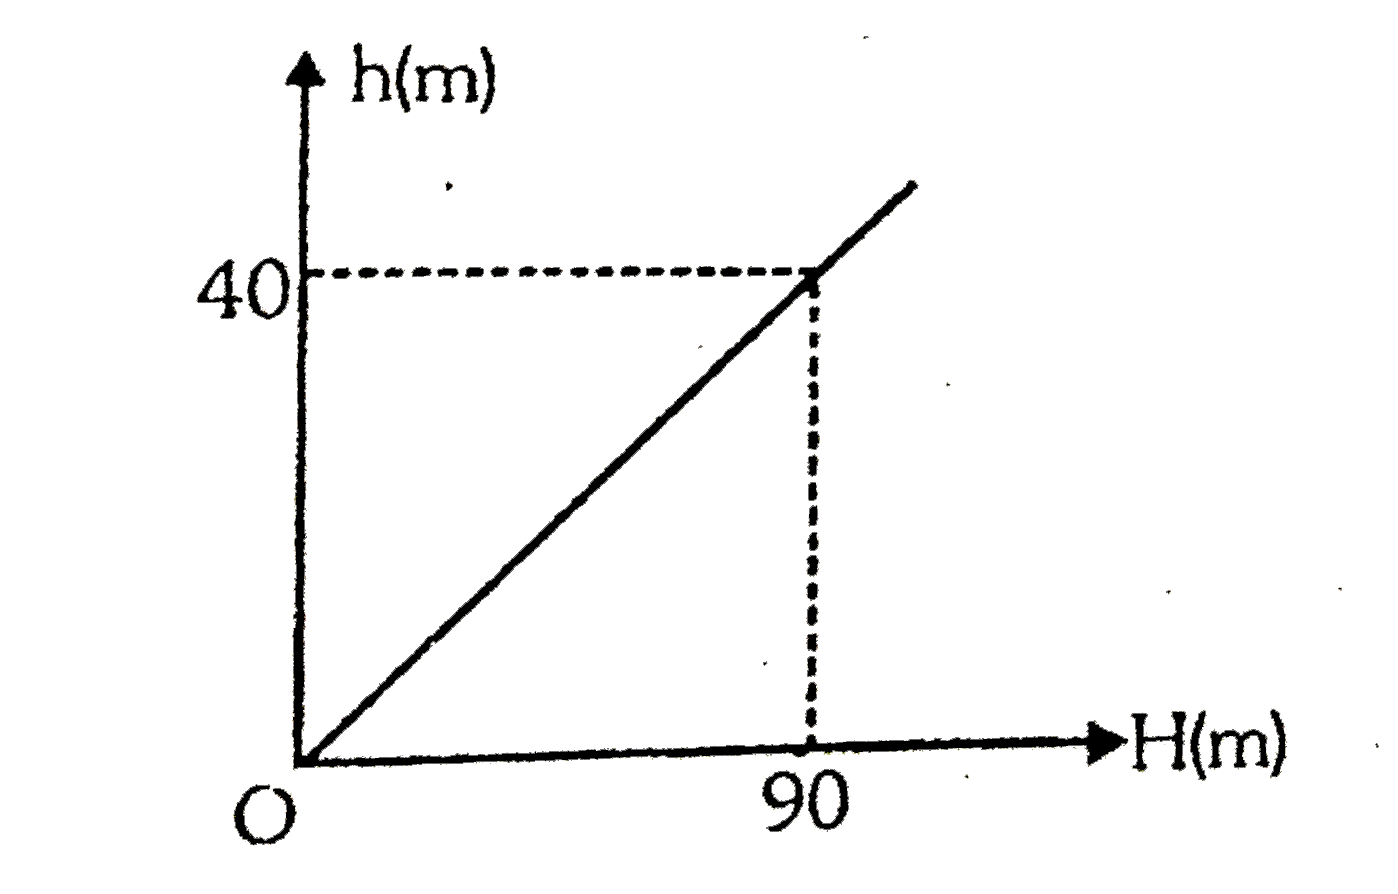
View SolutionA ball of mass 2kg dropped from a height H above a horizontal surface rebounds to a height h after one bounce. The graph that relates H to h is shown in figure. If the ball was dropped from an initial height of 81 m and made ten bounces, the kinetic energy of the ball immediately after the second impact with the surface was
View SolutionA ball falls from a height ‘h’ and collides with the ground. Each time it collides, its velocity is halved. Which of the following graphs are correct? Here t, v and y represent time, velocity and height above ground respectively. (vertically upwards direction is taken as positive and ground as y = 0)
View SolutionA particle is droped from a height H. The de-broglie wavelength of the particle as a function of height is proportional to
View Solution