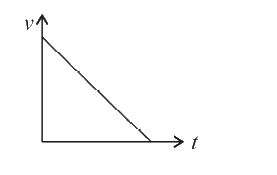
A ball is thrown vertically upwards and its velocity v varies with time t as shown in the figure. Which of the graphs (1),(2),(3),(4) shows the correct vurve of displacement versus time ?
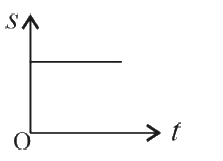
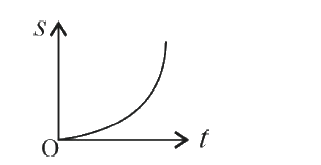
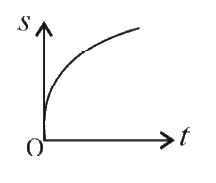
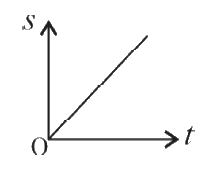
The correct Answer is:C
Step by step video & image solution for A ball is thrown vertically upwards and its velocity v varies with time t as shown in the figure. Which of the graphs (1),(2),(3),(4) shows the correct vurve of displacement versus time ? by Physics experts to help you in doubts & scoring excellent marks in Class 12 exams.
Updated on:21/07/2023Topper's Solved these Questions
- MOTION IN A STRAIGHT LINE & PLANE BOOK - VMC MODULES ENGLISHCHAPTER - MOTION IN A STRAIGHT LINE & PLANE EXERCISE - IMPECCABLE
52 Videos
- MOTION IN A STRAIGHT LINE & PLANE BOOK - VMC MODULES ENGLISHCHAPTER - MOTION IN A STRAIGHT LINE & PLANE EXERCISE - ENABLE
50 Videos
- MOCK TEST 9BOOK - VMC MODULES ENGLISHCHAPTER - MOCK TEST 9EXERCISE - PHYSICS (SECTION 2)
5 Videos
- Motion in Straight Line BOOK - VMC MODULES ENGLISHCHAPTER - Motion in Straight Line EXERCISE - IN-CHAPTER EXERCISE-J
10 Videos
Similar Questions
A ball thrown vertically upwards with an initial velocity of 1.4m/s. The total displcement of the ball is
View SolutionA particle is thrown vertically upwards with a velocity v. It returns to the ground in time T. which of the following graphs correctly represents the motion ?
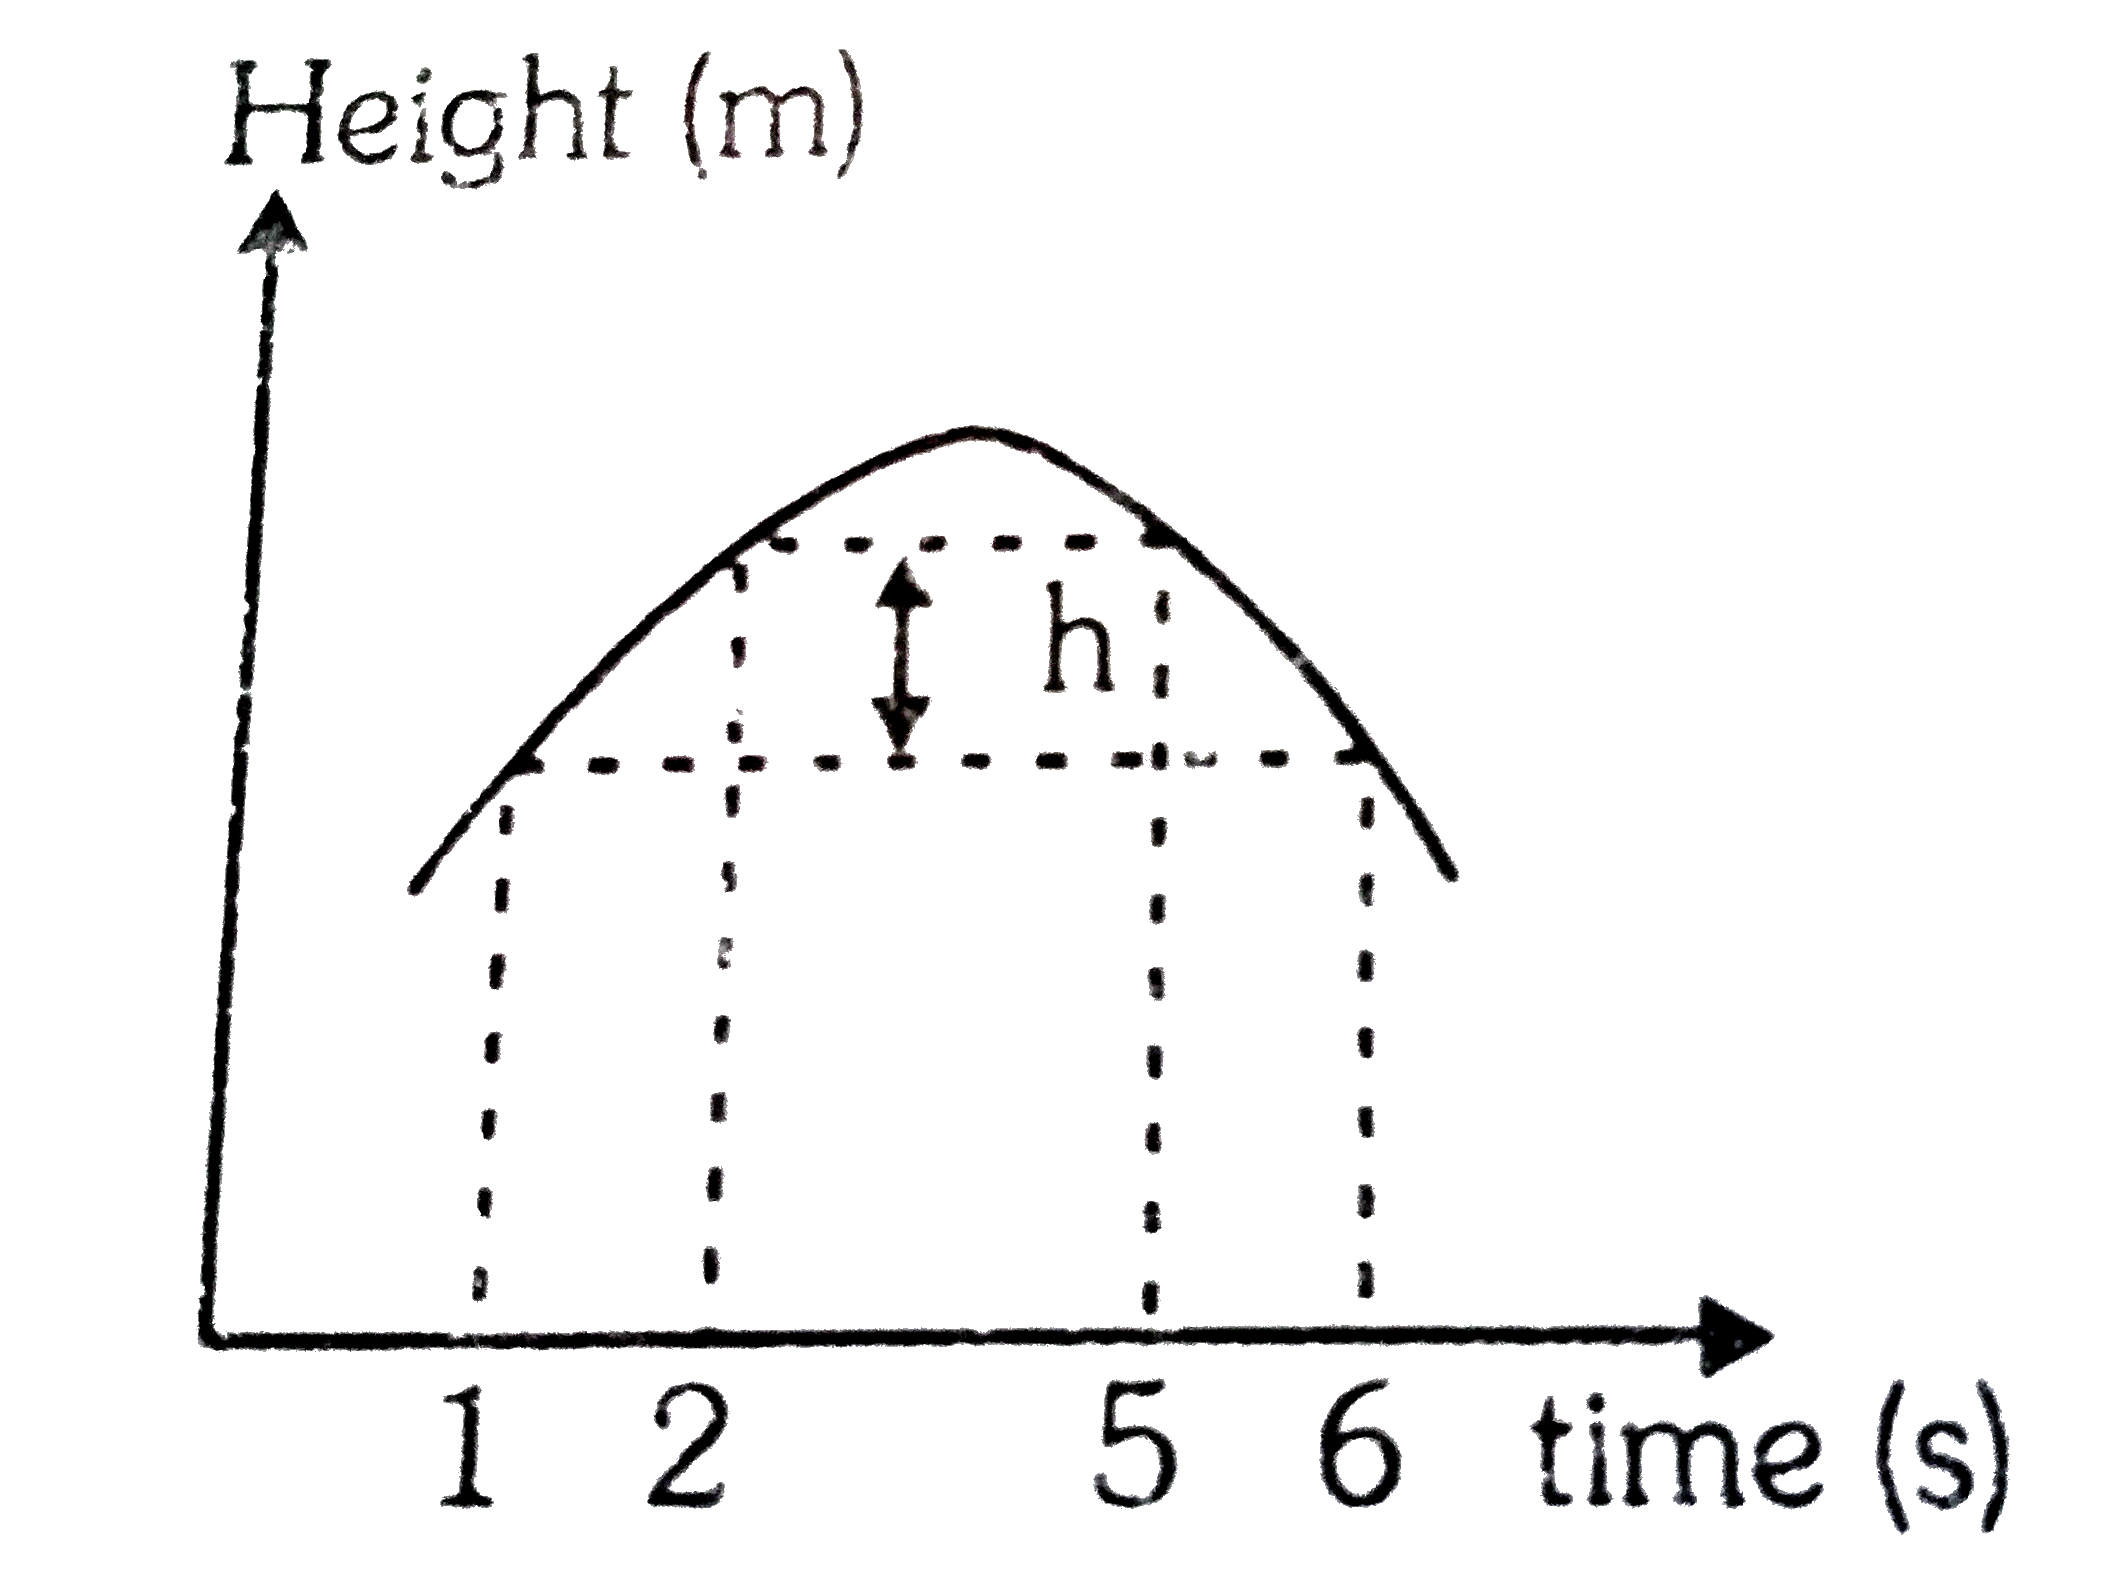
View SolutionA ball is thrown upwards . Its height varies with time as shown in figure. If the acceleration due to gravity is 7.5m/s2, then the height h is
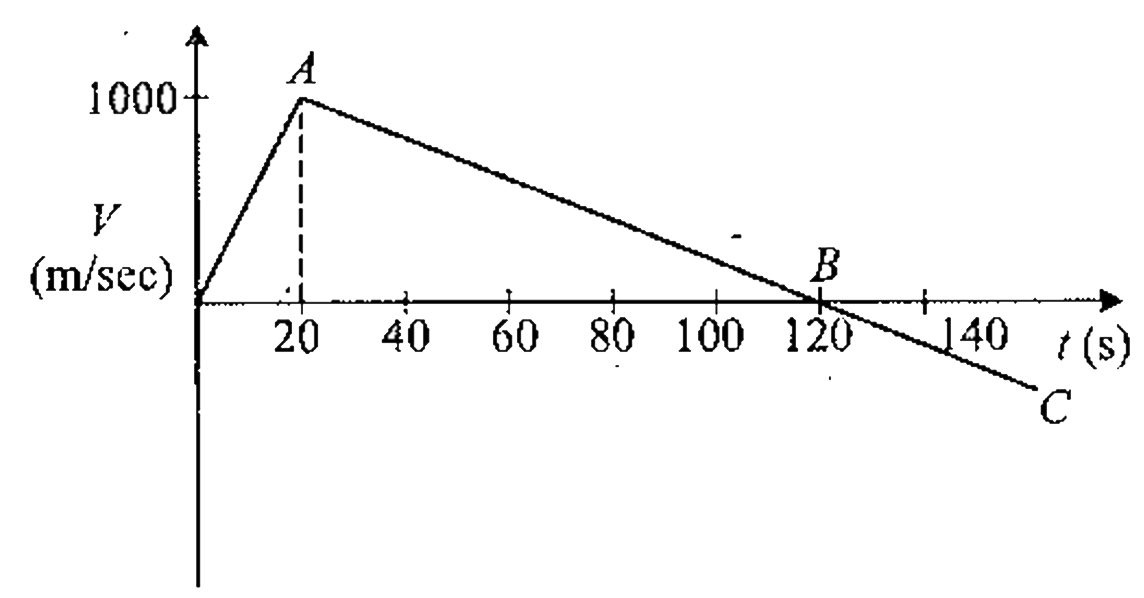
View SolutionA rocket is projected vertically upwards and its time velocity graph is shown in the figure-1.115. The maximum height attained by the rocket is :
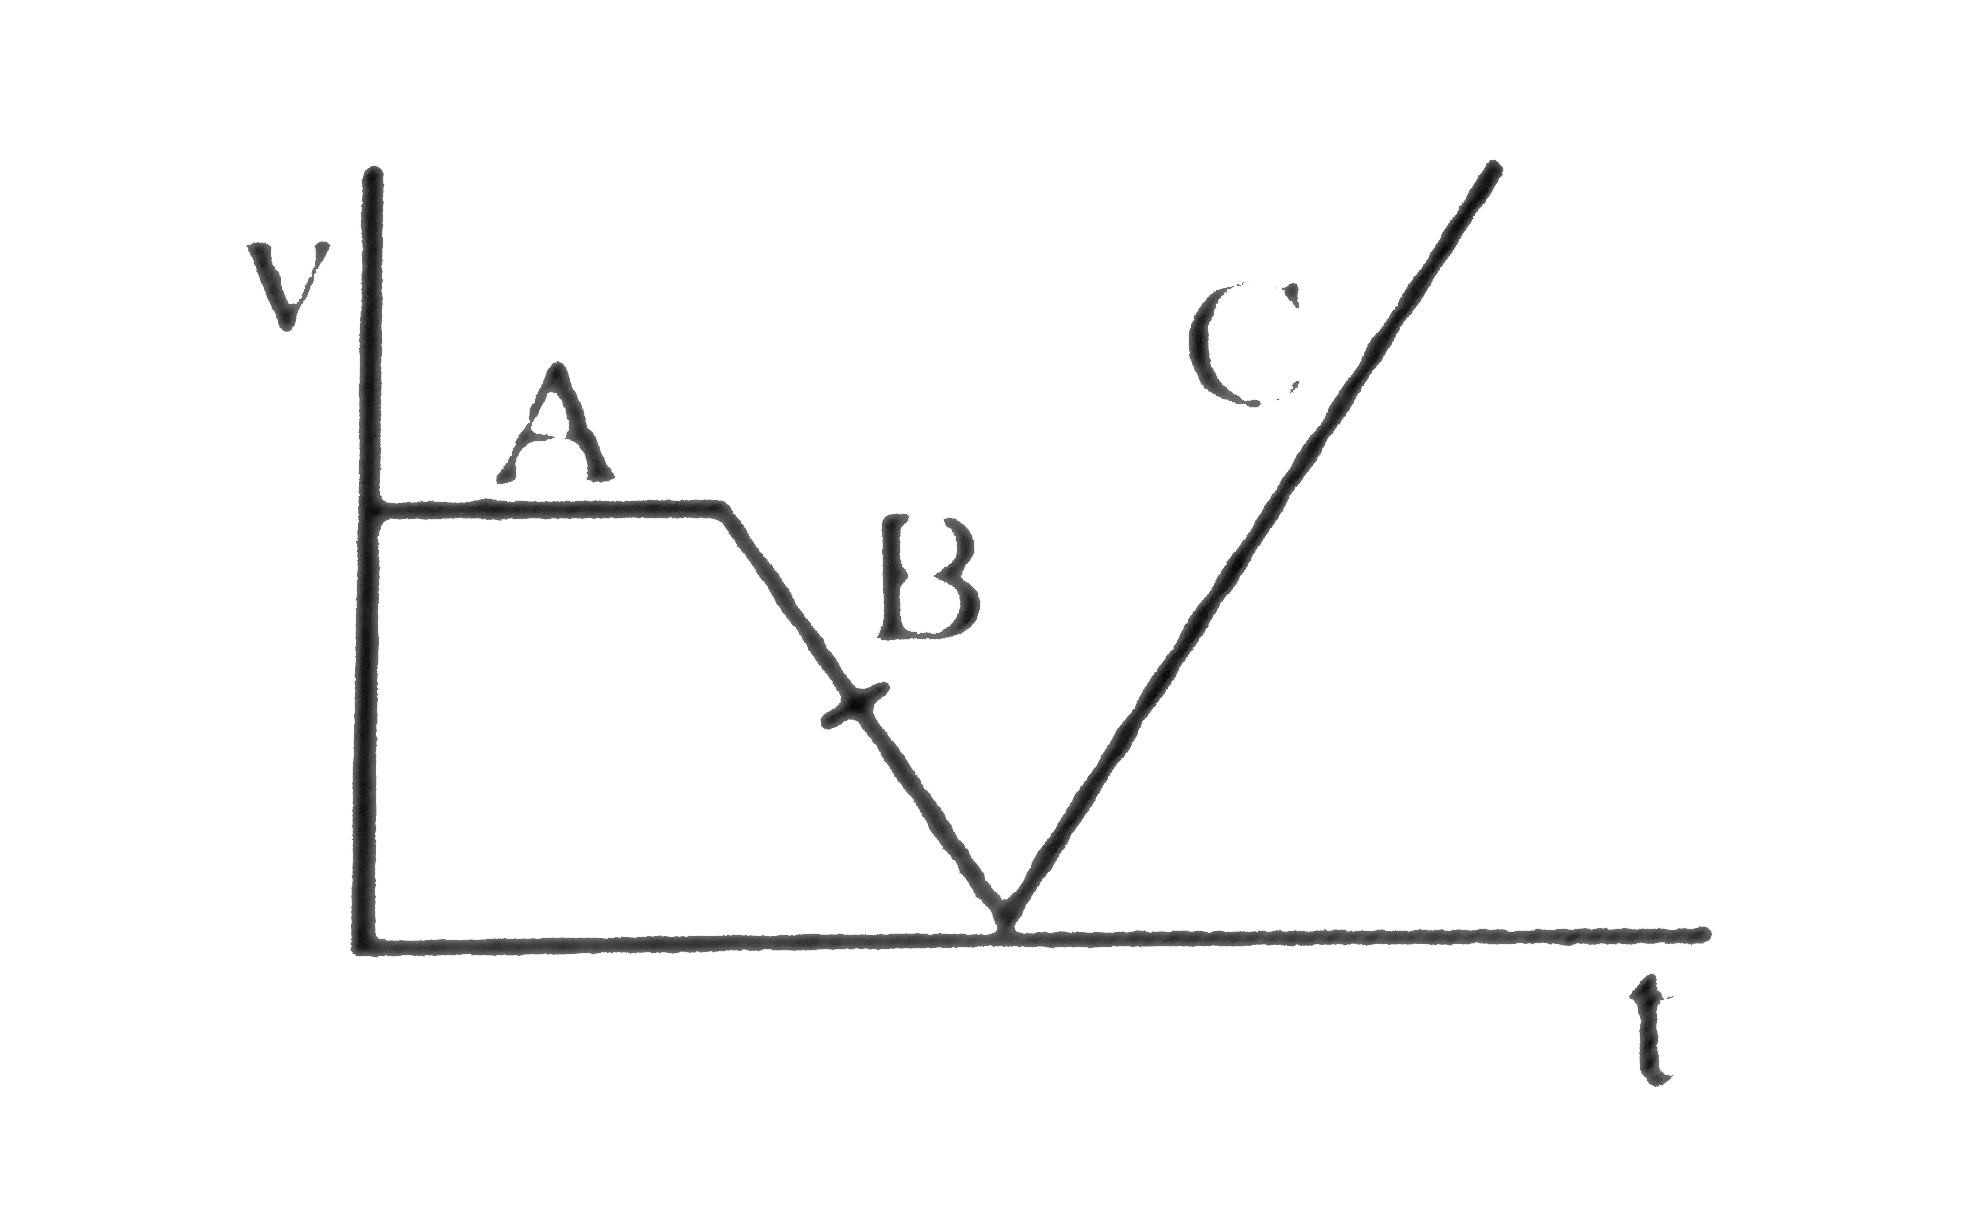
View SolutionA body is thrown vertically upwards which graph represents variation of velocity w.r.t time
View SolutionVelocity versus time graph of a body is shown in figure. It explains that
View SolutionA ball is thrown vertically upwards. It was observed at a height h twice after a time interval Δt. The initial velocity of the ball is
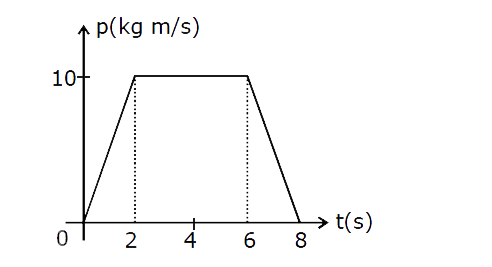
View SolutionThe momentum p of an object varies with time (t) as shown in figure. The corresponding force (F)- time (t) graph is -
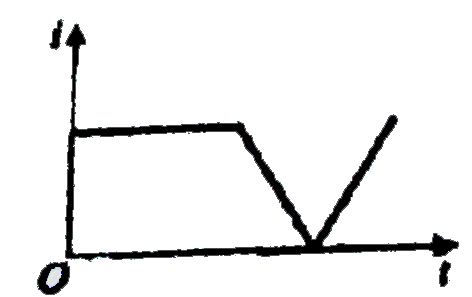
View SolutionThe current i in an induction coil varies with time t according to the graph shown in the figure-5.250. Which of the following graphs shows the induced EMF in the coil with time ?
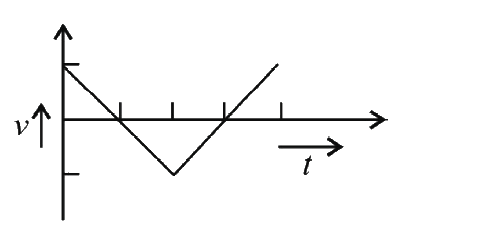
View SolutionThe graph in figure shows the velocity v versus time t for a body. Which of the graphs shown in figure represents the correesponding acceleration versus time graphs ?
View Solution
