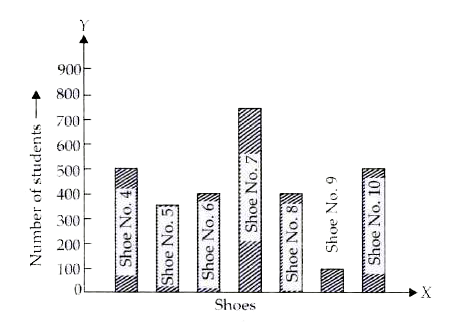
Observe the given bar graph carefully and answer the questions that follow.
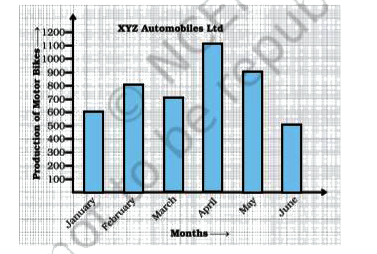
(a) What information does the bar graph depict?
(b) How many motor bikes were produced in the first three months?
(c) Calculate the increase in production in May over the production in January.
(d) In which month the production was minimum and what was it?
(e) Calculate the average (mean) production of bikes in 6 months.
Step by step video & image solution for Observe the given bar graph carefully and answer the questions that follow. (a) What information does the bar graph depict? (b) How many motor bikes were produced in the first three months? (c) Calculate the increase in production in May over the production in January. (d) In which month the production was minimum and what was it? (e) Calculate the average (mean) production of bikes in 6 months. by Maths experts to help you in doubts & scoring excellent marks in Class 7 exams.
Updated on:21/07/2023Topper's Solved these Questions
- DATA HANDLINGBOOK - NCERT EXEMPLARCHAPTER - DATA HANDLINGEXERCISE - THINK AND DISCUSS
3 Videos
- DATA HANDLINGBOOK - NCERT EXEMPLARCHAPTER - DATA HANDLINGEXERCISE - EXERCISE(TRUE OR FALSE)
18 Videos
- COMPARING QUANTITIESBOOK - NCERT EXEMPLARCHAPTER - COMPARING QUANTITIESEXERCISE - THINK AND DISCUSS
24 Videos
- EXPONENTS AND POWERSBOOK - NCERT EXEMPLARCHAPTER - EXPONENTS AND POWERSEXERCISE - EXERCISE
136 Videos
Similar Questions
Knowledge Check
Study the table graph carefully to answer the questions that follows
Production of main crops in India (in million tonnes)
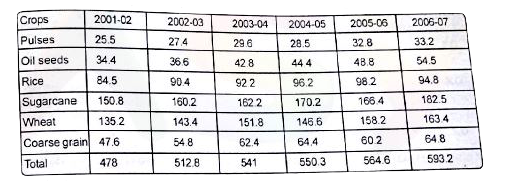
What was the average production of rice in the given years?A98 Million tonnesB95 Million tonnesC92.38 Million tonnesD100 Million tonnesGiven below is the bar graph showig the number of scooters produced in a factory during the first five months of a year.
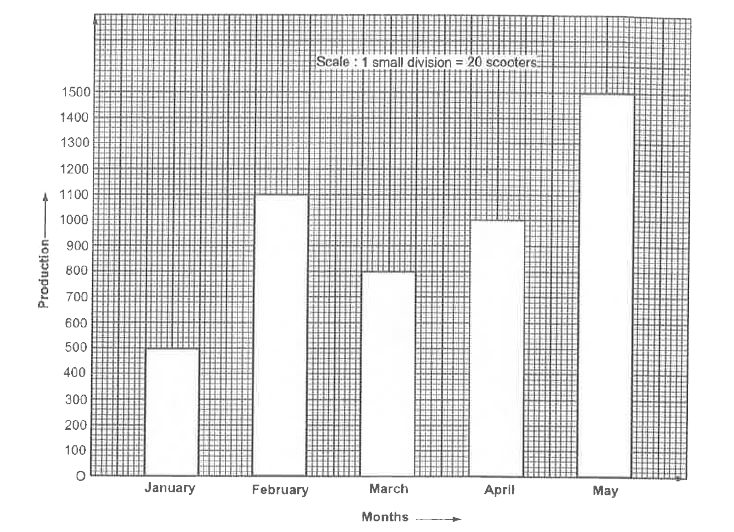
Read the above bar graph carefully nd answer the question given below:
How many scooters were produced in the month of March?
What was the increase in proudction in Feberuary over the production in January ?
What was teh decrease in proudction in March in comparison to the production in February ?
In which month was the production minimum and what was it ?A(i) 800 scooters
(ii) 600 scooters
(iii) 300 scooters less in March
(iv) Minimum production in january =500B(i) 700 scooters
(ii) 500 scooters
(iii) 300 scooters less in March
(iv) Minimum production in january =500C(i) 900 scooters
(ii) 600 scooters
(iii) 300 scooters less in March
(iv) Minimum production in january =200D(i) 750 scooters
(ii) 550 scooters
(iii) 300 scooters less in March
(iv) Minimum production in january =500
Read the following bar graph given in figure and answer the following questions.
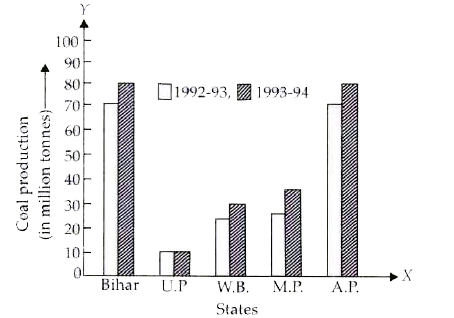
(i) What information is given by this bar graph?
View SolutionRead the graph and answer the following questions
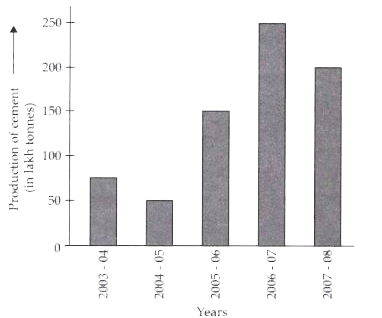
What information is conveyed by the bar graph
View SolutionStudy the bar graph given below and answer the questions that follow.
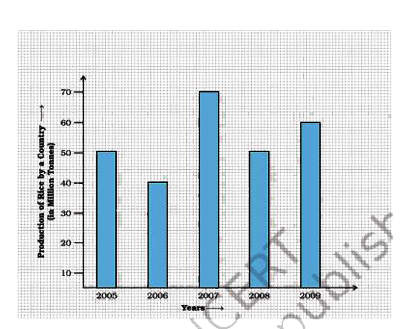
(a) What information does the above bar graph represent?
(b) In which year was production the least?
(c) After which year was the maximum rise in the production?
(d) Find the average production of rice during the 5 years.
(e) Find difference of rice production between years 2006 and 2008.
View SolutionRead the bar graph and answer the following questons.
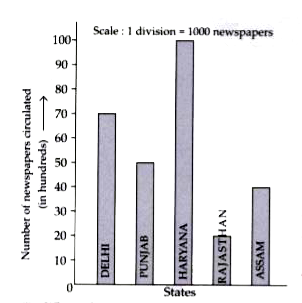
What information is given by graph ?
View SolutionRead the bar graph carefully and answer the following questions.
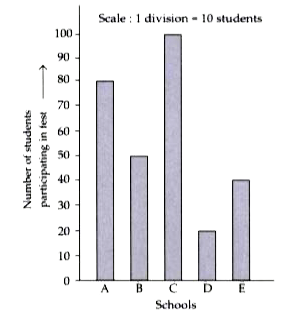 How may students of school B participated in the fest ?
View SolutionStudy the bar graph given below and answer the questions that follow

(a) What information is depicted from the bar graph?
(b) In which subject is the student very good?
(c) Calculate the average marks of the student.
(d) If 75 and above marks denote a distinction, then name the subjects in which the student got distinction.
(e) Calculate the percentage of marks the student got out of 500.
View Solution
