The table below compares the population (in hundreds) of 4 towns over two years:

Study the table and answer the following questions:
(a) Draw a double bar graph using appropriate scale to depict the above information.
(b) In which town was the population growth maximum?
(c) In which town was the population growth least?
Step by step video & image solution for The table below compares the population (in hundreds) of 4 towns over two years: Study the table and answer the following questions: (a) Draw a double bar graph using appropriate scale to depict the above information. (b) In which town was the population growth maximum? (c) In which town was the population growth least? by Maths experts to help you in doubts & scoring excellent marks in Class 7 exams.
Updated on:21/07/2023Topper's Solved these Questions
- DATA HANDLINGBOOK - NCERT EXEMPLARCHAPTER - DATA HANDLINGEXERCISE - THINK AND DISCUSS
3 Videos
- DATA HANDLINGBOOK - NCERT EXEMPLARCHAPTER - DATA HANDLINGEXERCISE - EXERCISE(TRUE OR FALSE)
18 Videos
- COMPARING QUANTITIESBOOK - NCERT EXEMPLARCHAPTER - COMPARING QUANTITIESEXERCISE - THINK AND DISCUSS
24 Videos
- EXPONENTS AND POWERSBOOK - NCERT EXEMPLARCHAPTER - EXPONENTS AND POWERSEXERCISE - EXERCISE
136 Videos
Similar Questions
The data given below shows the production of motor bikes in a factory for some months of two consecutive years.

Study the table given above and answer the following questions:
(a) Draw a double bar graph using appropriate scale to depict the above information and compare them.
(b) In which year was the total output the maximum?
(c) Find the mean production for the year 2007.
(d) For which month was the difference between the production for the two years the maximum?
(e) In which month for the year 2008, the production was the maximum?
(l) In which month for the year 2007, the production was the least?
View SolutionThe table below gives the flavours of ice cream liked by children (boys and girls) of a society.

Study the table and answer the following questions:
(a) Draw a double bar graph using appropriate scale to represent the above information.
(b) Which flavour is liked the most by the boys?
(c) How many girls are there in all?
(d) How many children like chocolate flavour of ice cream?
(e) Find the ratio of children who like strawberry flavour to vanilla flavour of ice cream.
View Solution
Knowledge Check
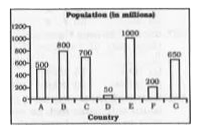
The bar graph shows the population of different countries. Study the diagram and answer the following questions.

Which country has the second highest population?ABBDCEDA
The students of Class VII have to choose one club from Music, Dance, Yoga, Dramatics, Fine arts and Electronics clubs. The data given below shows the choices made by girls and boys of the class. Study the table and answer the questions that follow:

(a) Draw a double bar graph using appropriate scale to depict the above data.
(b) How many students are there in Class VII?
(c) Which is the most preferred club by boys?
(d) Which is the least preferred club by girls?
(e) For which club the difference between boys and girls is the least?
(f) For which club is the difference between boys and girls the maximum?
View SolutionThe table below gives the data of tourists visiting 5 hill stations over two consecutive years. Study the table and answer the questions that follow:

(a) Draw a double bar graph to depict the above information using appropriate scale.
(b) Which hill station was visited by the maximum number of tourists in 2008?
(c) Which hill station was visited by the least number of tourists in 2009?
(d) In which hill stations was there increase in number of tourists in the year 2009?
View SolutionThe table given below shows the population of four towns over two years
Q (i)The table given below shows the population of four towns over two years
(ii) In which town was the population growth maximum
(iii) In which town was the population growth least
Hint Take 1 unit = 1 lakh people

View Solution
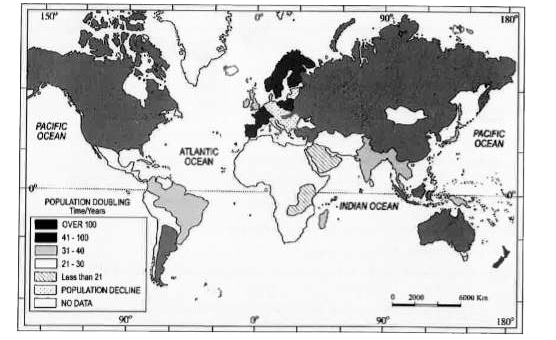
Study the given map and answer the following questions: <
(i) Name the nations that take a very long time to double their population ? Why?
(ii)Which are the nations taking about 31 to 40 years to double their population ? Why ?
View SolutionThe performance of a student in 1st Term and 2nd Term is given.

In which subject is the improvement the least ?
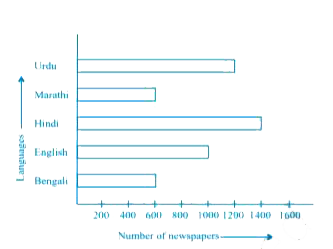
View SolutionThe bar graph given below represents the circulation of newspapers in different languages in a town. Study the bar graph and answer the following questions:

Name the two languages in which circulation of newspaper is the same.
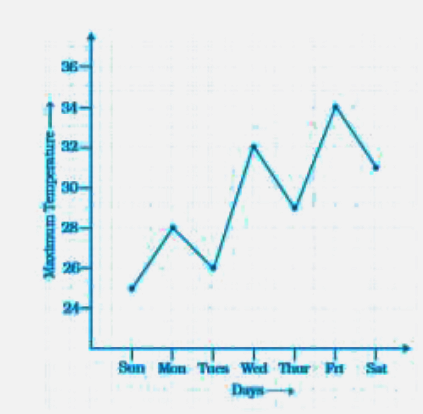
View SolutionStudy the graph and answer the questions that follow.
(a) What information does the graph give?
(b) On which day was the temperature the least?
(c) On which day was the temperature 31∘C?
(d) Which was the hottest day?

View Solution