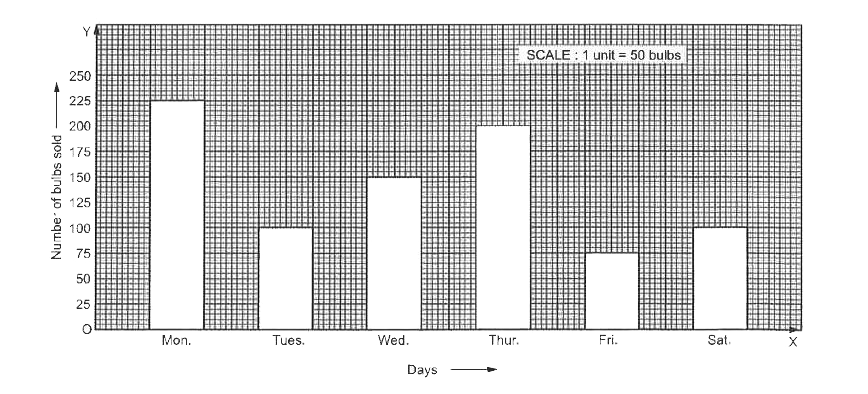
Observe the given data:

(a) Draw a bar graph to represent the above given information.
(b) On which day of the week was the sales maximum?
(c) Find the total sales during the week.
(d) Find the ratio of the minimum sale to the maximum sale.
(e) Calculate the average sale during the week.
(f) On how many days of the week was the sale above the average sales?
Step by step video & image solution for Observe the given data: (a) Draw a bar graph to represent the above given information. (b) On which day of the week was the sales maximum? (c) Find the total sales during the week. (d) Find the ratio of the minimum sale to the maximum sale. (e) Calculate the average sale during the week. (f) On how many days of the week was the sale above the average sales? by Maths experts to help you in doubts & scoring excellent marks in Class 7 exams.
Updated on:21/07/2023Topper's Solved these Questions
- DATA HANDLINGBook:NCERT EXEMPLARChapter:DATA HANDLINGExercise:THINK AND DISCUSS
Explore 3 Videos
- DATA HANDLINGBook:NCERT EXEMPLARChapter:DATA HANDLINGExercise:EXERCISE(TRUE OR FALSE)
Explore 18 Videos
- COMPARING QUANTITIESBook:NCERT EXEMPLARChapter:COMPARING QUANTITIESExercise:THINK AND DISCUSS
Explore 24 Videos
- EXPONENTS AND POWERSBook:NCERT EXEMPLARChapter:EXPONENTS AND POWERSExercise:EXERCISE
Explore 136 Videos
Similar Questions
Given below is a graph showing the number of electric bulbs sold in a shop during a week
Read the bar graph carefully and answer the following questions
(i) On which day of the week was the sale minimum?
(ii) On which day of the week was the sale maximum
(iiI) What was the total sale during the week
(lv) What is the ratio between the minimum sale and the maximum sale
View SolutionThe given bar graph represents the sale of cars in five different states in a month.
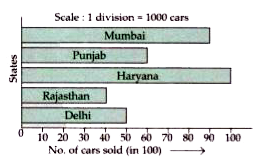
Which state sold maximum number of cars ?
View Solution
Knowledge Check
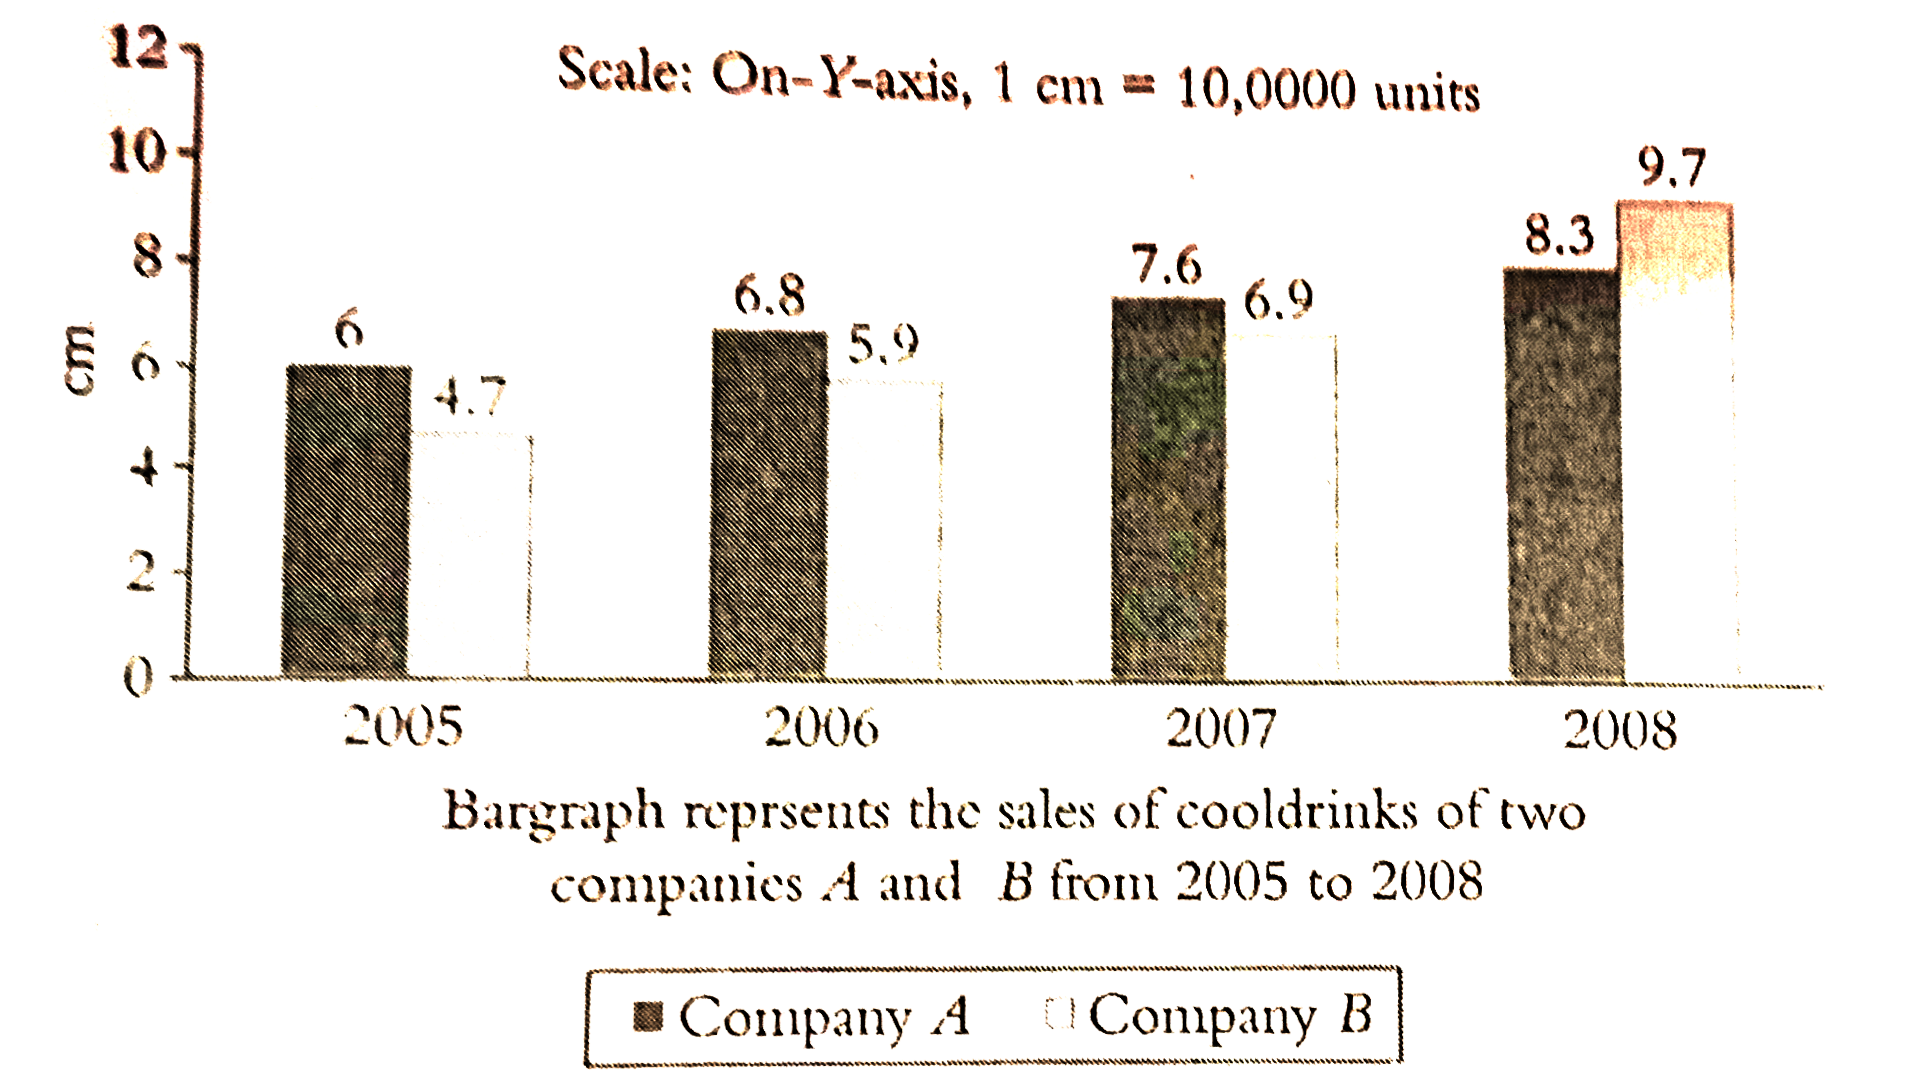
Find the ratio of the total sales in the year 2007 and that in 2008.A107:145B127:145C29:36D107:127Find the ratio of total sales in the two years of Company C2 and the ratio of total sales in both years of Company C4?
A9:8B7:9C7:3D5:6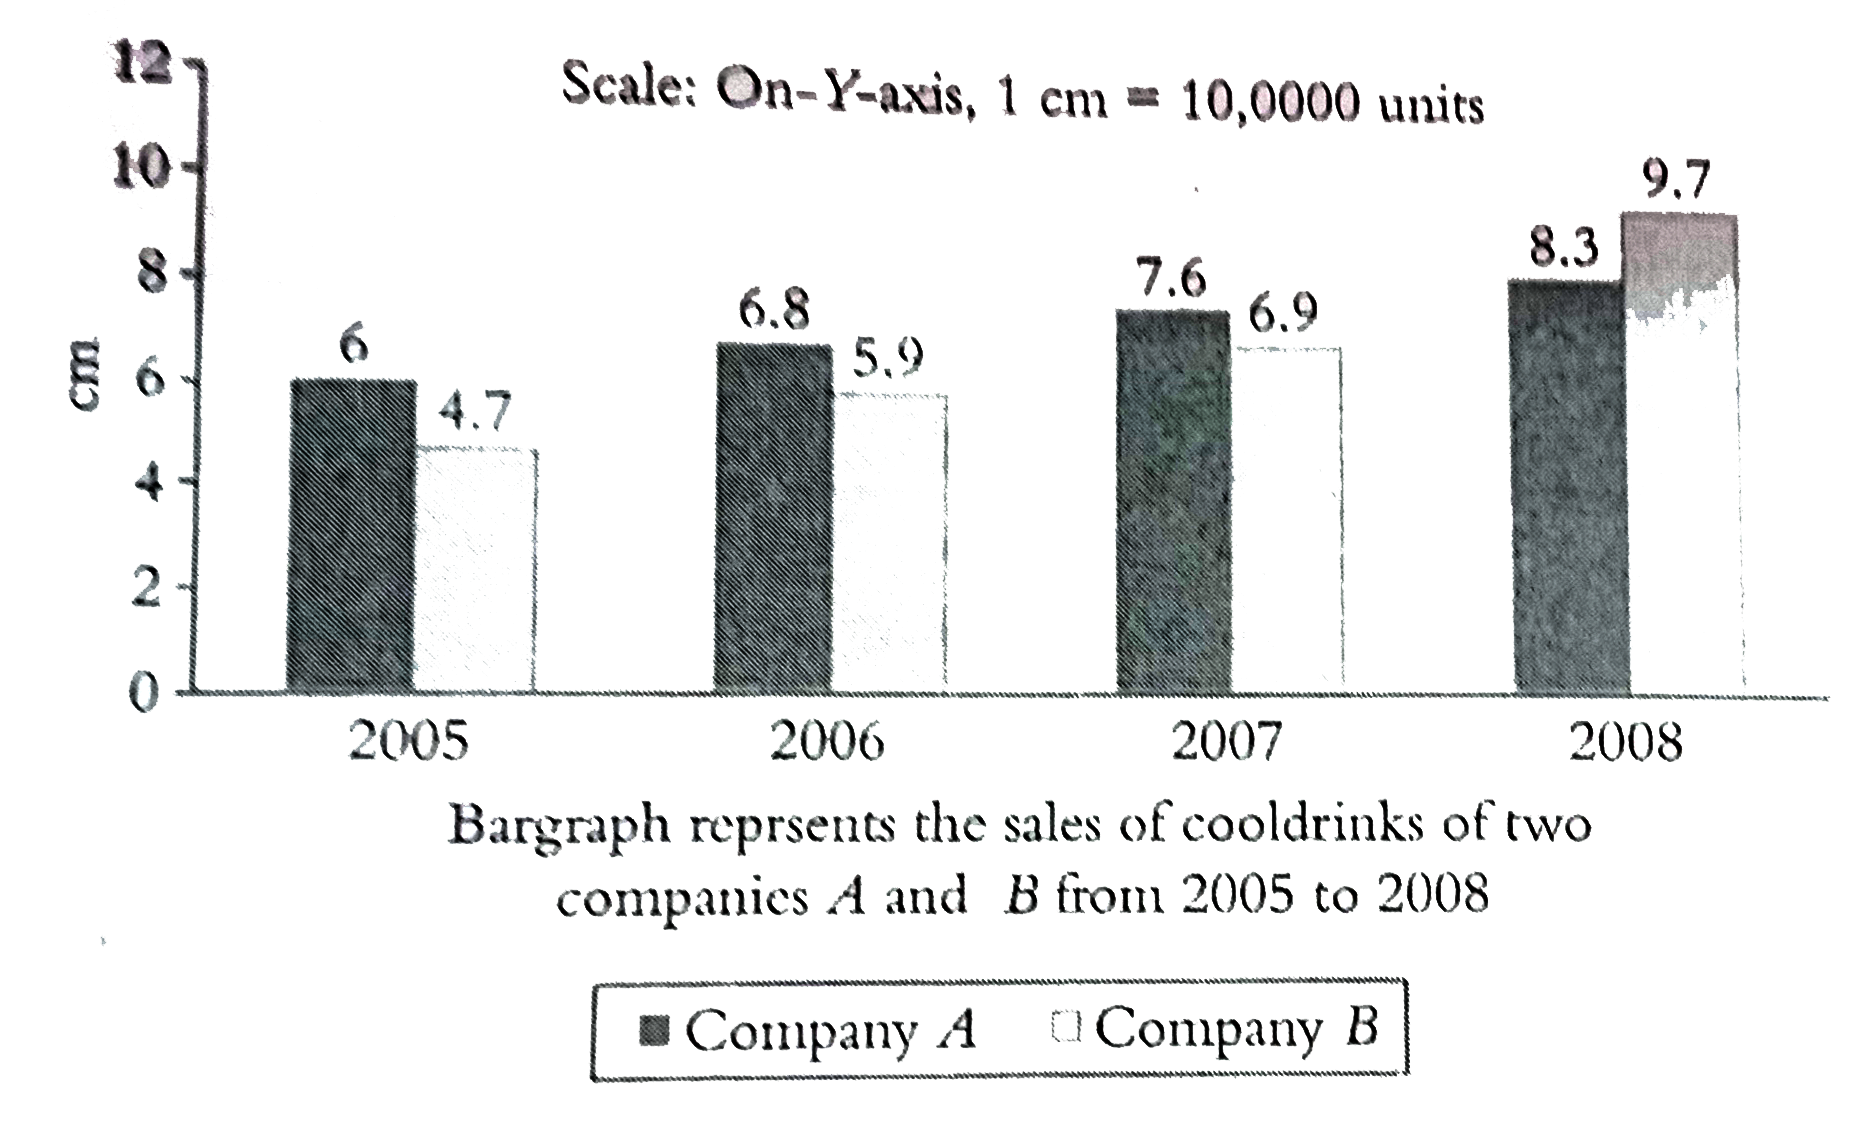
In which year is the sales of B more than the sales of A ?A2005B2006C2007D2008
The ratio of the sale of eggs on a Sunday to that of the whole week of a grocery shop was 2:9. If the total sale of eggs in the same week was Rs. 360, find the sale of eggs on Sunday.
View SolutionRead the following bar graph shown in Figure and answer the following questions: What is the information given by the bar graph? In which month was the sale of the book maximum? In which month was the sale of the book minimum? What is the total sale of the book during these five months?
View SolutionThe graph shows the maximum temperatures recorded for two consecutive weeks of a town. Study the graph and answer the questions that follow.
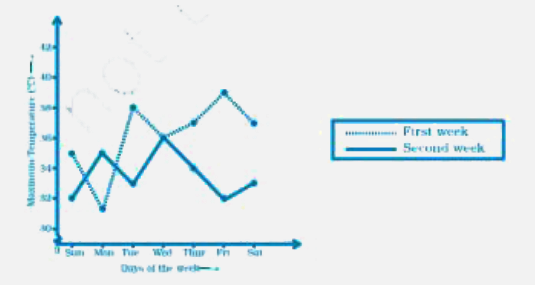
(a) What information is given by the two axes?
(b) In which week was the temperature higher on most of the days?
(c) On which day was the temperature same in both the weeks?
(d) On which day was the difference in temperatures the maximum for both the weeks?
(e) What were the temperatures for both the weeks on Thursday?
(f) On which day was the temperature 35°C for the first week?
(g) On which day was the temperature highest for the second week?
View SolutionStudy the graph and answer the questions.
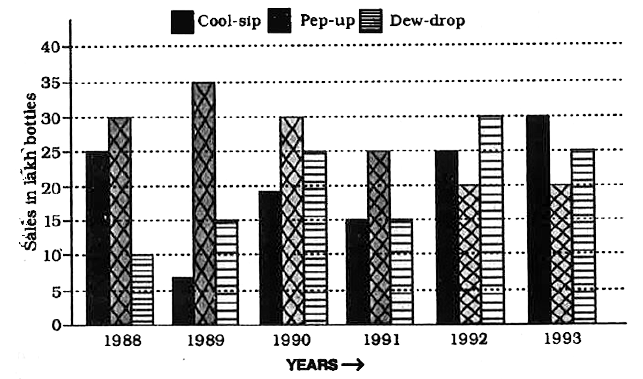
In case of which soft drink was the average annual sale maximum during the period 1988-1993 ?
View SolutionThe line chart given below shows the sales (in crores) of a complany for the years 2009 to 2016
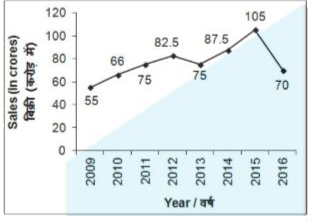
In how many years was the sale of the company more than the sale in 2011?
View Solution
