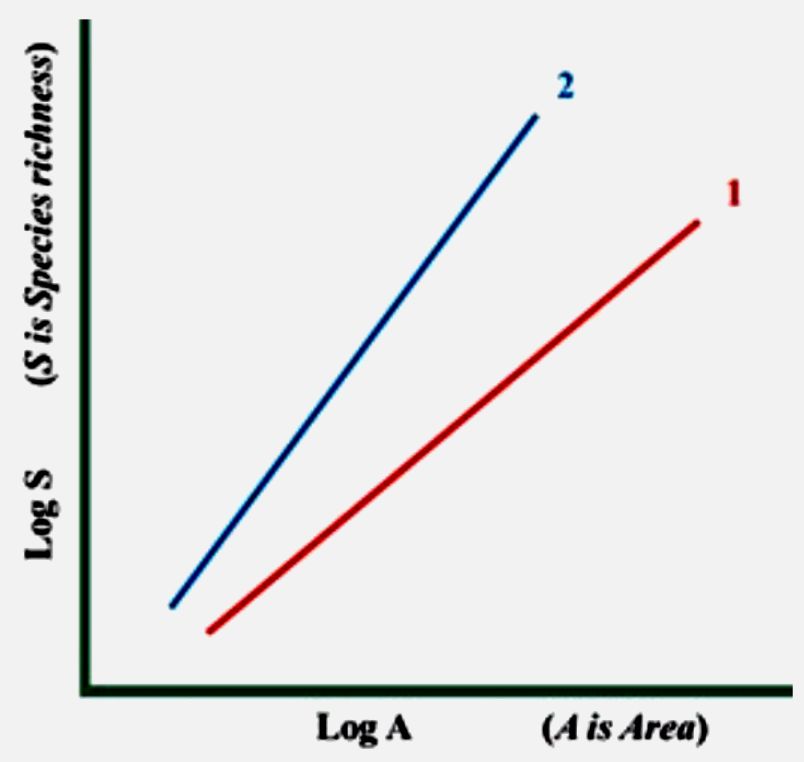
Which of these examples will have the steepest curve when log of species richness and log of area are plotted on a graph?
plants in Britain
birds in California
molluscs in New York State
mammals in the tropical forests of different continents
The correct Answer is:D
Step by step video & image solution for Which of these examples will have the steepest curve when log of species richness and log of area are plotted on a graph? by Biology experts to help you in doubts & scoring excellent marks in Class 12 exams.
Updated on:21/07/2023Similar Questions
In mollusks of New York state, which of these experiences gives you a value between 0.1 to 0.2?
( S = log of species richness, A = log of Area, C = log of Y- intercept in the species richness area curve).
(a) S−CA
(b) S−AC
(c) C−AS
(d) A−SC
View SolutionWhich of the plots of ln K vs (1T) is/are correct?
View SolutionObserve the graph of area versus species richness and select the options that explain lines 1 and 2.

View SolutionSketch the curve y=log|x|
View SolutionSketch the curve y=log|x|
View Solution
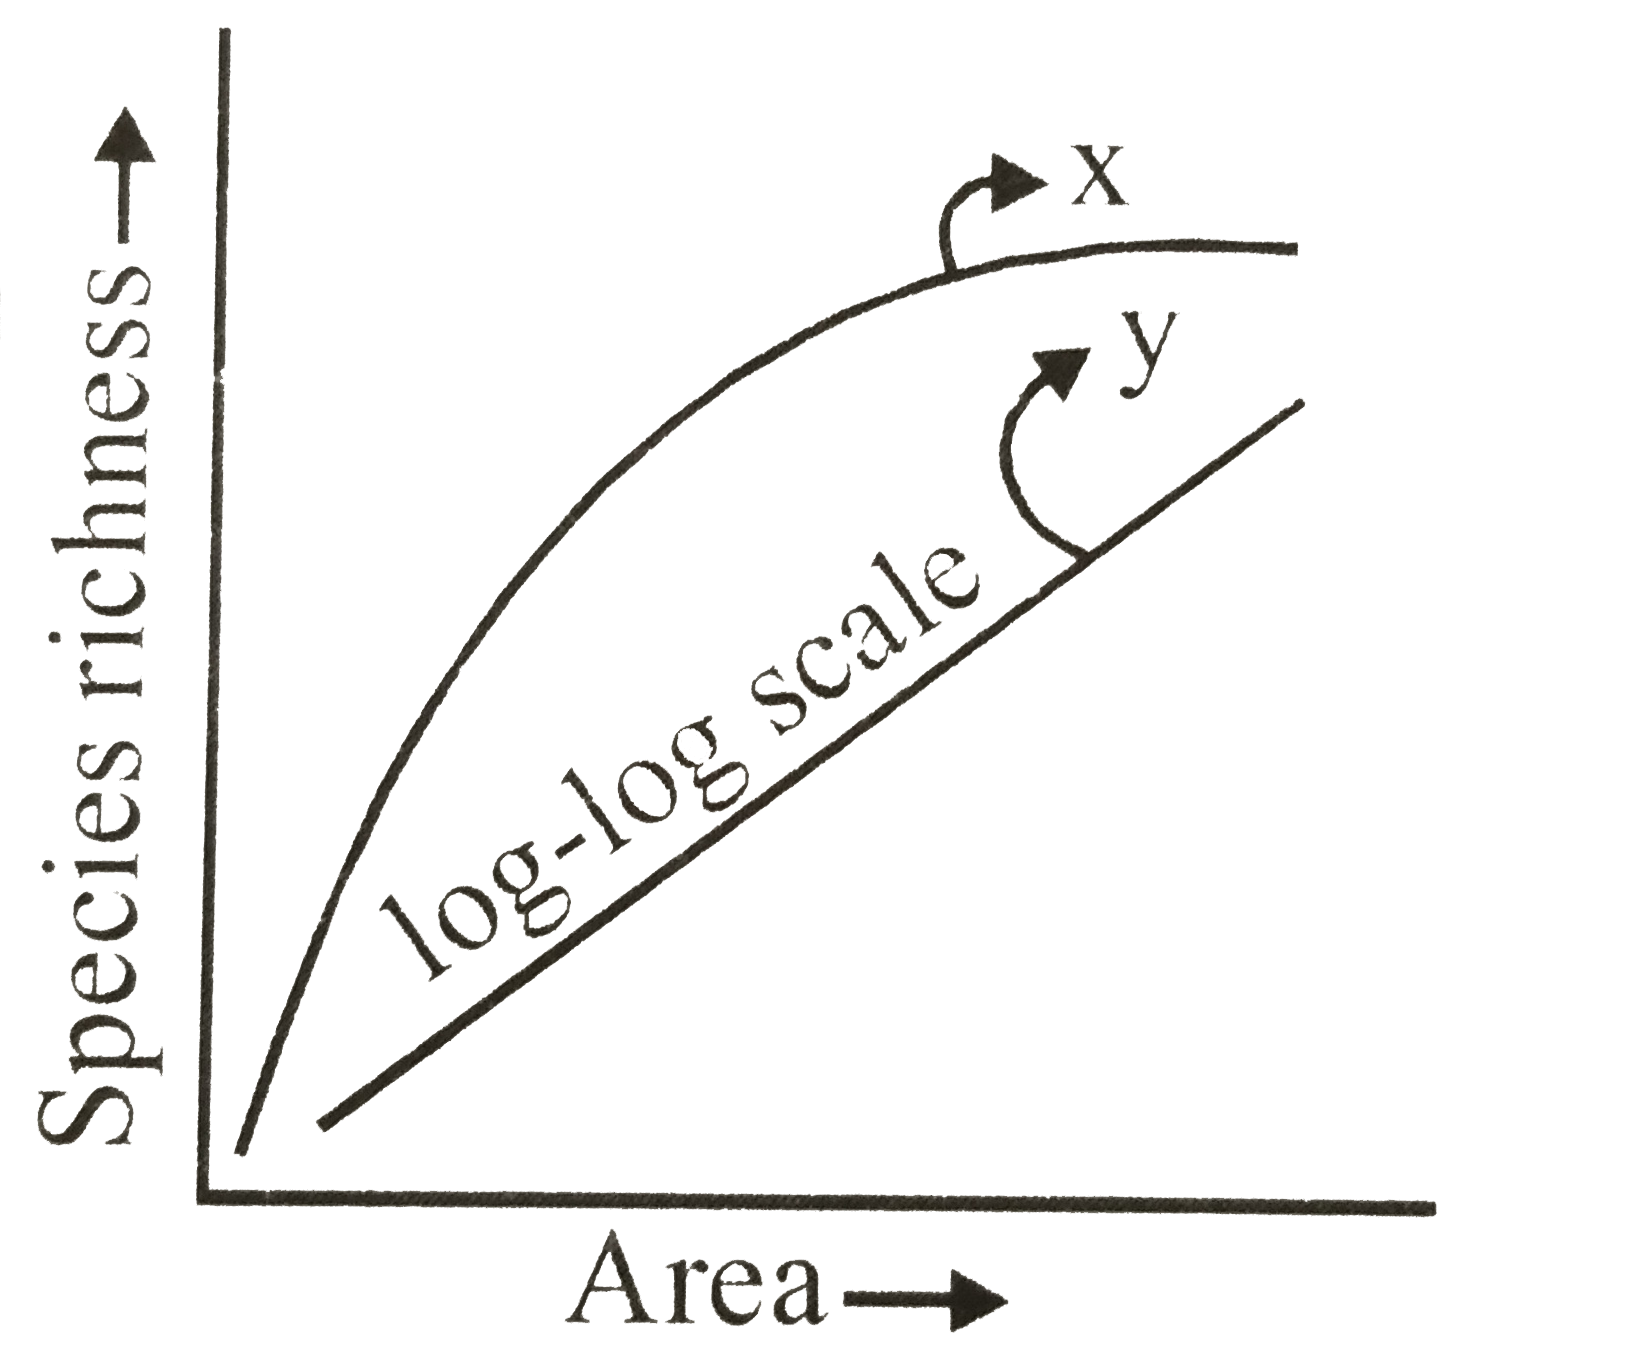
Study the above graph and answer the following questions -
(i) Identify x and y
(ii) The relation between species richness and area can be denoted as generally
(iii) The value of z lies in range of
(iv) On a log scale the relation between species richness and area is
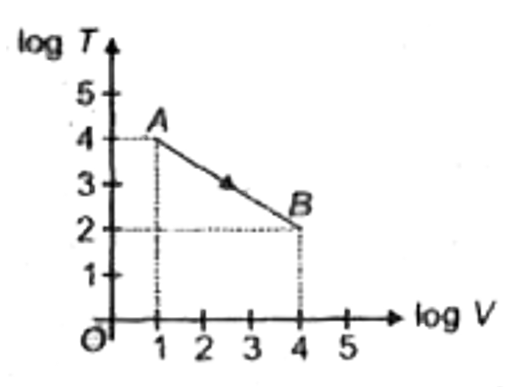
View SolutionFigure shows , the adiabatic curve on log T and log V scale performed on ideal gas . The gas is

View SolutionOn a logarithmic scale, the relation between species richness and area is described by the following equation:
logS=logC+ZLogA
In the above equation 'Z' represents
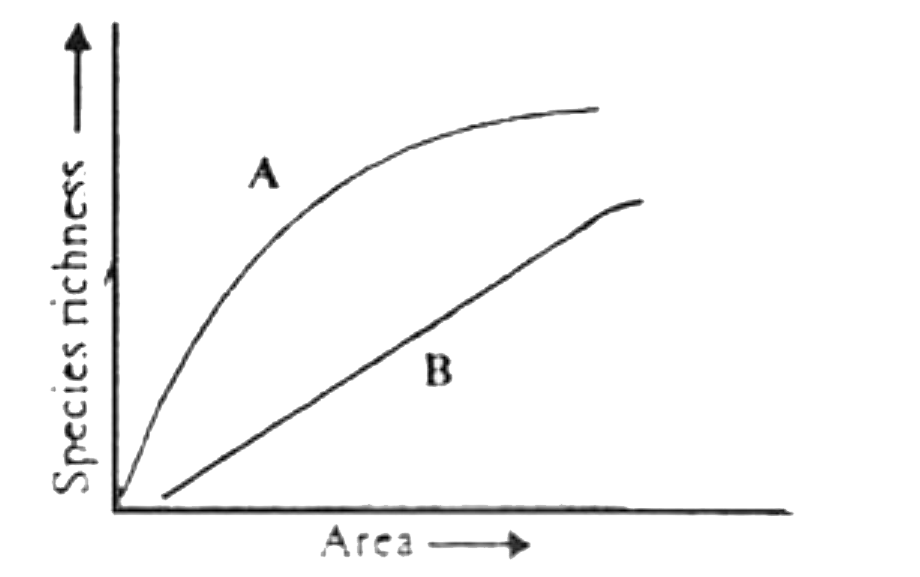
View SolutionWhich option correctly describes the equation for curves A and B, in the given graph of species - area relationship ?

View SolutionWhich option correctly describes the equation for curves A and B, in the given graph of species - area relationship ?

View Solution
