Observe the graph of area versus species richness and select the options that explain lines 1 and 2.
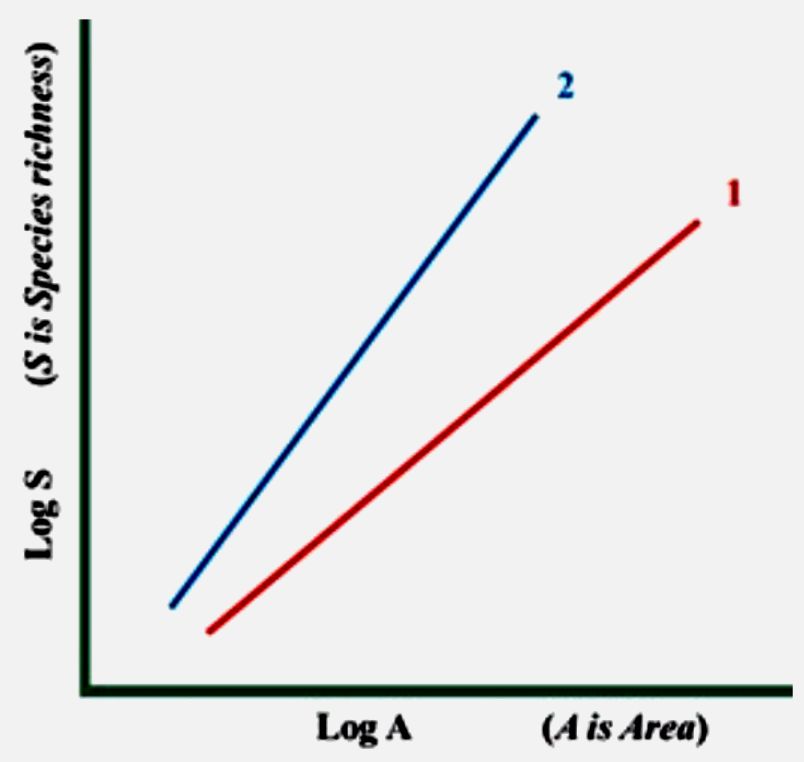
1 - Molluscs in New York State and 2 - plants in Britain
1 - plants in Britain and 2 - birds in California
1 - frugivorous birds and mammals in the tropical forests of different continents and 2 - plants in Britain
1 Molluscs in New York state and 2 frugivorous birds and mammals in the tropical forests of different continents
The correct Answer is:D
Step by step video & image solution for Observe the graph of area versus species richness and select the options that explain lines 1 and 2. by Biology experts to help you in doubts & scoring excellent marks in Class 12 exams.
Updated on:21/07/2023Similar Questions
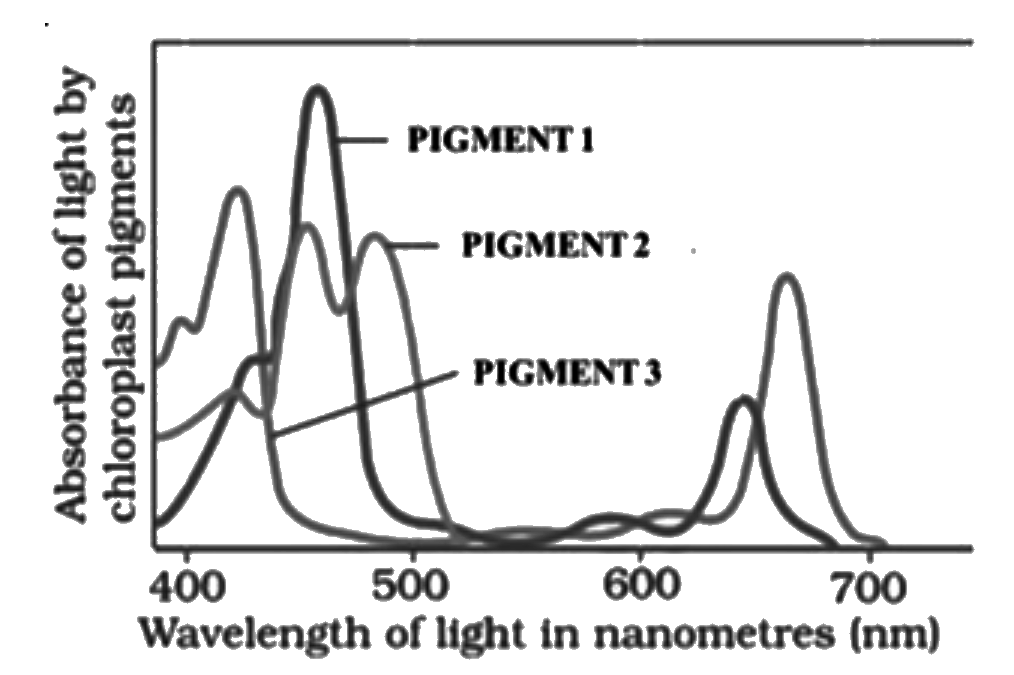
Observe the graphs given below and choose the options correctly describing the color of pigments 1,2,and 3 in a chromatogram .
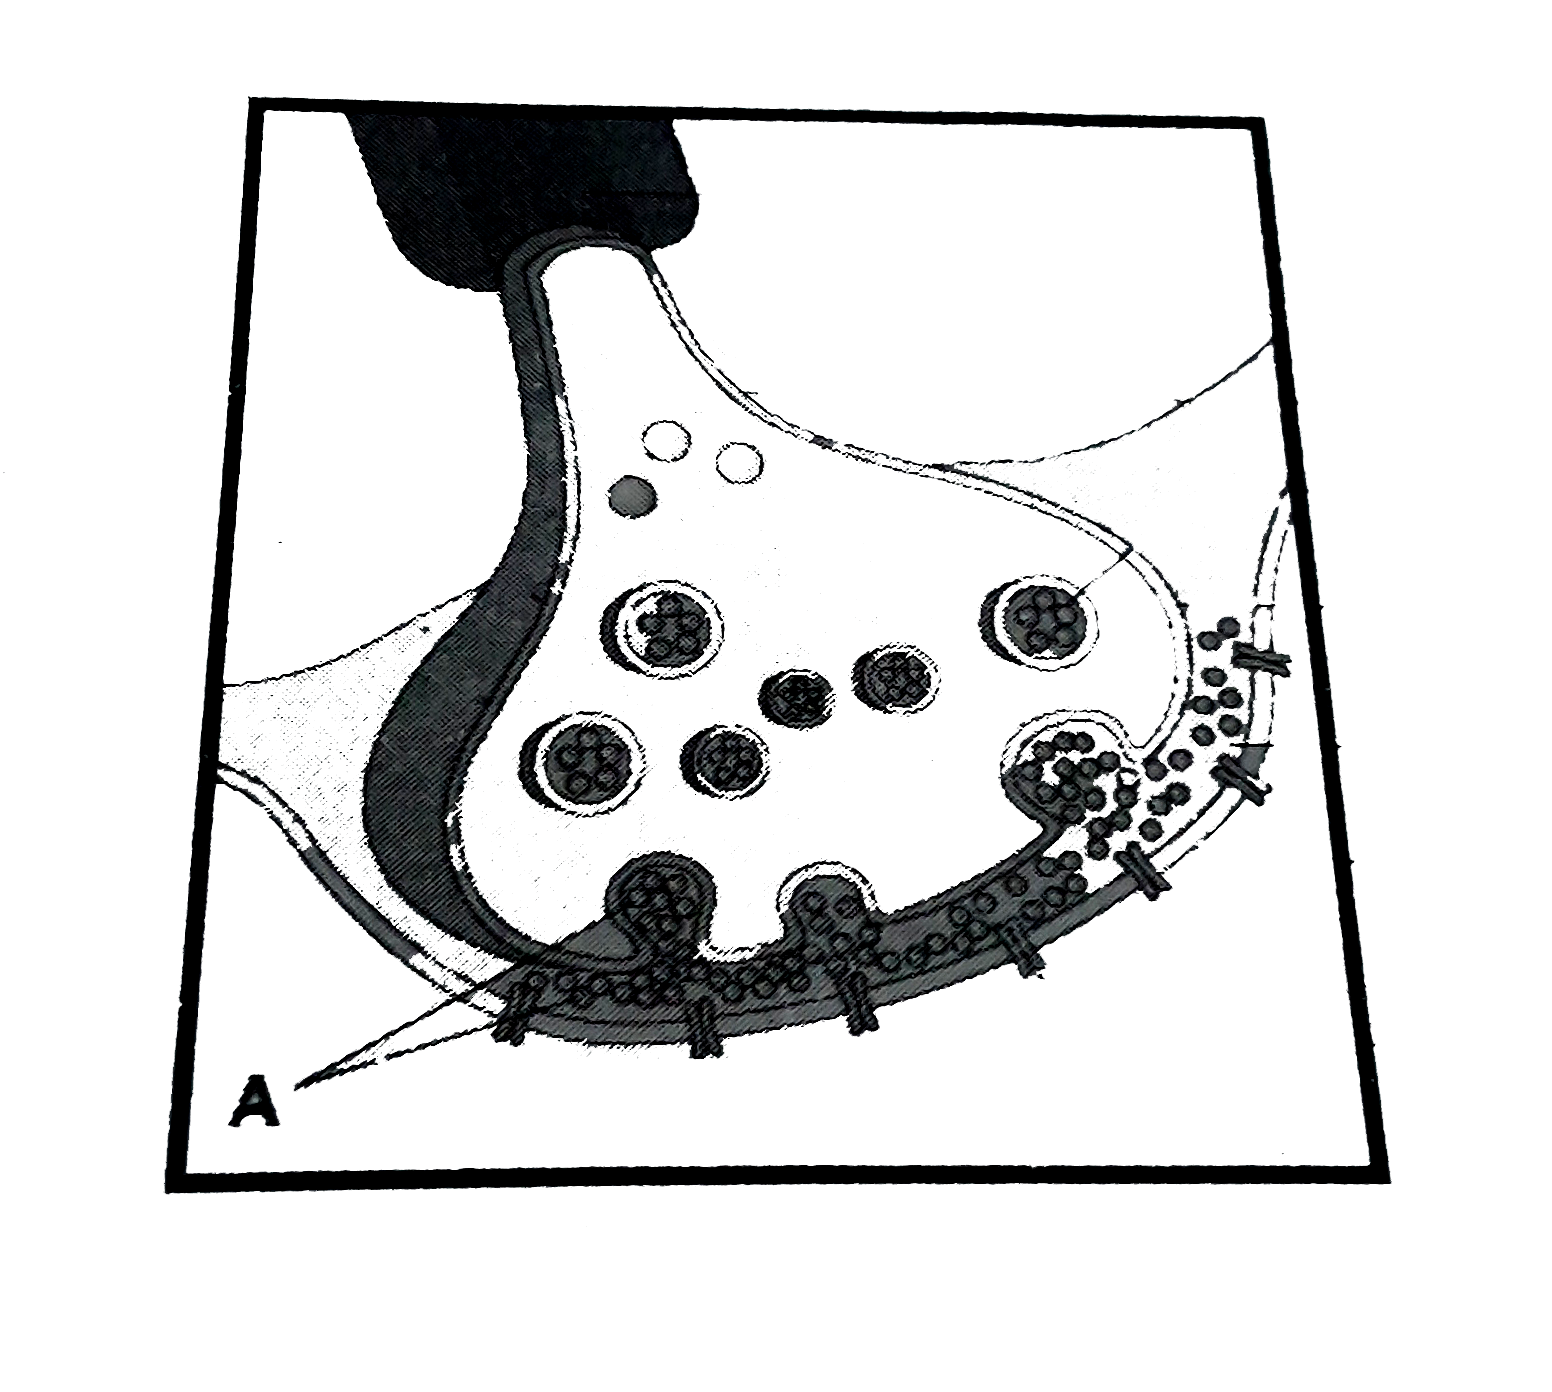
View SolutionObserve the given diagram and select the correct option regarding labeled part A
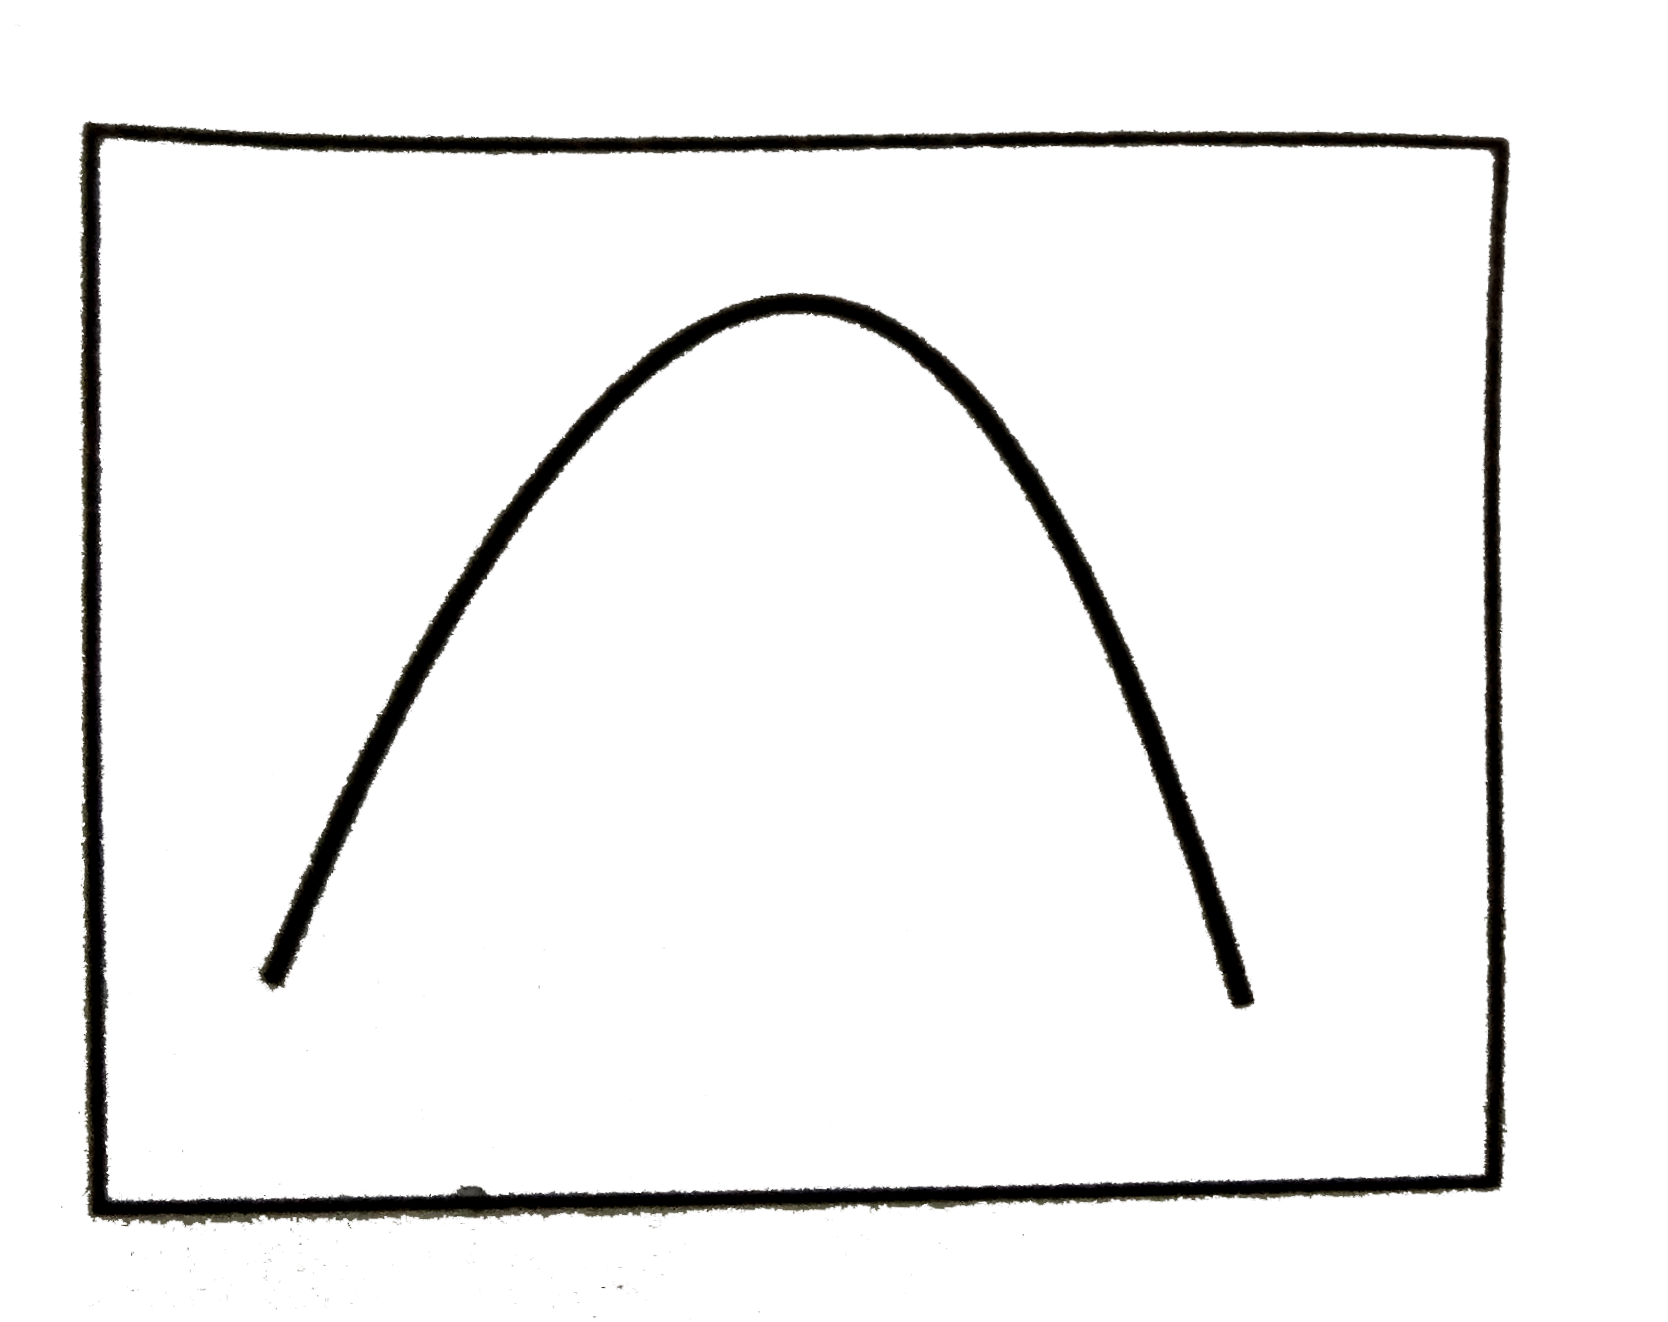
View SolutionSelect the right option regarding the given graph.
View SolutionThe graph between logk versus 1/T is a straight line.
View SolutionVelocity versus time graph of a body is shown in figure. It explains that

View SolutionFigure shows graphs of pressure versus density for an ideal gas at two temperatures T1 and T2 Which is correct ?
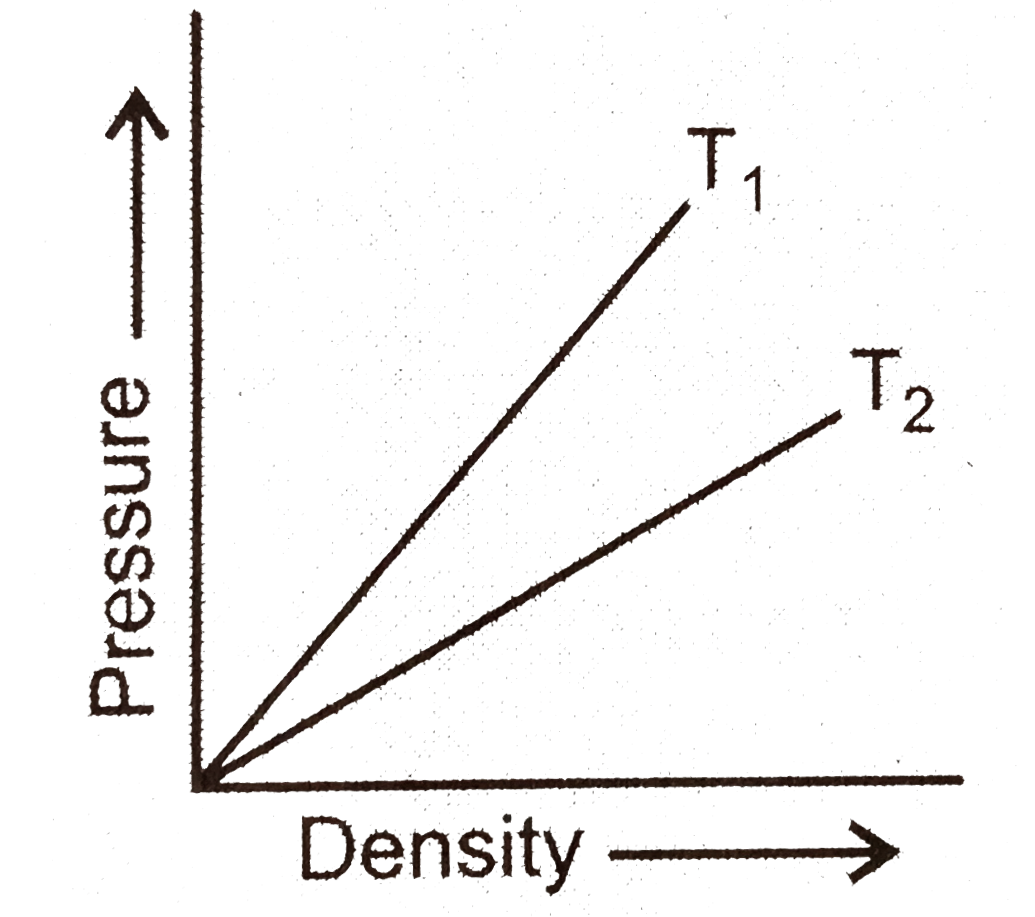 .
.
View SolutionWho observed that 'within a region, species richess increased with increasing explored area but only upto a limit'
View SolutionWhich of these examples will have the steepest curve when log of species richness and log of area are plotted on a graph?
View SolutionObserve the following reaction, and select the correct option

View SolutionThe graph pressure versus temperature (T) at constant volume is a straight line.(T/F)
View Solution
