The pie chart given below shows the expenditure on various items and savings of a family during the year 2009. Study the pie chart and answer these questions.
नीचे दिया गया याई-चार्ट वर्ष २००९ में एक परिवार द्वारा विभिन्न मदों पर व्यय की गई धनराशि तथा बचत को प्रदर्शित करता है। पाईं-चार्ट का अध्ययन कीजिये तथा इस पर आधारित प्रश्नों का उत्तर दीजिये-
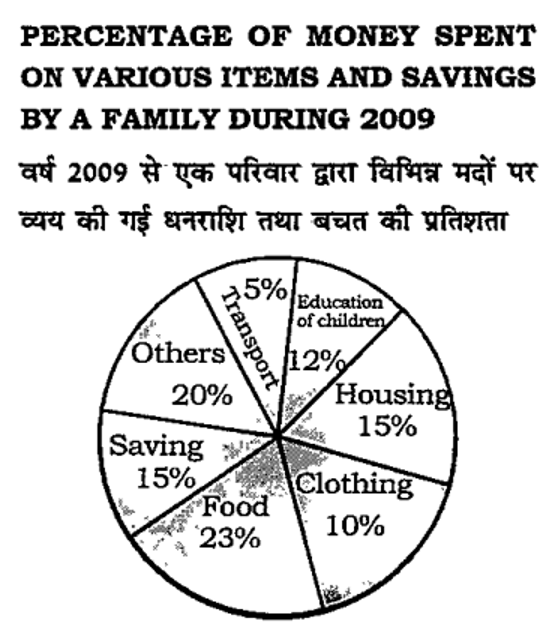
If the total income of the family
for the year 2009 was Rs.1,50,000 then the difference between the expenditures on housing and transport was
यदि वर्ष 2009 में परिवार को कुल आय 1,50,000 रुपये रही हो, तो आवास तथा परिवहन पर किये गये व्ययों का अंतर था?
Rs. 15000
Rs. 10000
Rs. 12000
Rs. 7000
Step by step video & image solution for The pie chart given below shows the expenditure on various items and savings of a family during the year 2009. Study the pie chart and answer these questions. नीचे दिया गया याई-चार्ट वर्ष २००९ में एक परिवार द्वारा विभिन्न मदों पर व्यय की गई धनराशि तथा बचत को प्रदर्शित करता है। पाईं-चार्ट का अध्ययन कीजिये तथा इस पर आधारित प्रश्नों का उत्तर दीजिये- If the total income of the family for the year 2009 was Rs.1,50,000 then the difference between the expenditures on housing and transport was यदि वर्ष 2009 में परिवार को कुल आय 1,50,000 रुपये रही हो, तो आवास तथा परिवहन पर किये गये व्ययों का अंतर था? by Maths experts to help you in doubts & scoring excellent marks in Class 14 exams.
Updated on:21/07/2023Topper's Solved these Questions
Similar Questions
The pie chart given below shows the expenditure on various items and savings of a family during the year 2009. Study the pie chart and answer these questions.
नीचे दिया गया याई-चार्ट वर्ष २००९ में एक परिवार द्वारा विभिन्न मदों पर व्यय की गई धनराशि तथा बचत को प्रदर्शित करता है। पाईं-चार्ट का अध्ययन कीजिये तथा इस पर आधारित प्रश्नों का उत्तर दीजिये-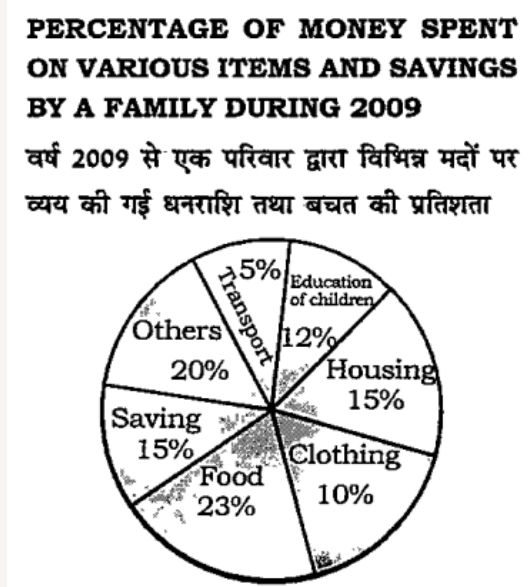 Maximum expenditure of the family other than on food, was on
परिवार द्वारा किसी मद पर भोजन के सिवाय सर्वाधिक व्यय किया गया?
View SolutionThe pie chart given below shows the expenditure on various items and savings of a family during the year 2009. Study the pie chart and answer these questions.
 The percentage of the income which was spent on clothing, education of children and transport together is-
View Solution
Knowledge Check
The pie chart, given here shows monthly expenses on various heads and savings of the family of Mr. Rao. Study the chart and answer the querstions based on it.
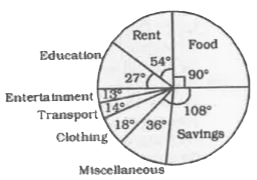
What per cent of his income does Mr. Rao save?A25%B30%C3313%D36%The pie chart given below shows the monthly expenses on various heads of a family . The total expenditure of the family is Rs 30000.
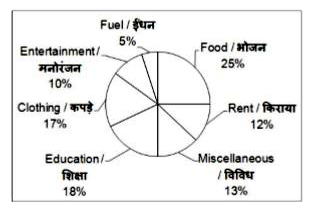
What is the amount (in Rs) spent on food ?A2500B5000C7500D8000The pie chart given below shows the spendings of a family on various heads during a month. Study the graph and answer the questions
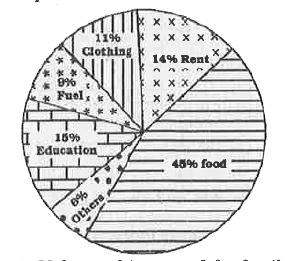
Expenditure on Rent is what percent of expenditure on Fuel?A135%B156%C167%D172%
The pie chart, given here shows monthly expenses on various heads and savings of the family of Mr. Rao. Study the chart and answer the questions based on it.

What per cent of his income does Mr. Rao save?
View SolutionThe following pie chart shows the monthly expenditure incurred by a family on various items, and their savings. Study the chart and answer the question that follows
निम्नलिखित पाई चार्ट विभिन्न मदों पर एक परिवार द्वारा किए गए मासिक खर्च और उनकी बचत को दर्शाता है। चार्ट का अध्ययन करें और फिर पूछे गए प्रश्न का उत्तर दें।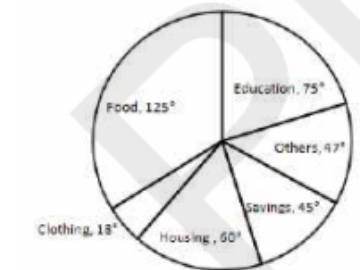 If the monthly income is ₹64,800, then the yearly savings are:
यदि मासिक आय ₹64,800 है, तो वार्षिक बचत होती है:
View SolutionThe following pie-chart shows the monthly expenditure of a family on various items. If the family spends Rs. 825 on clothing, answer the question.
निम्नलिखित पाई-चार्ट में किसी परिवार के विभिन्न मदों पर होने वाले खर्च का दर्शाया गया है। यदि परिवार वस्त्रों पर 825 रू खर्च करे तो प्रश्न का उत्तर दीजिए।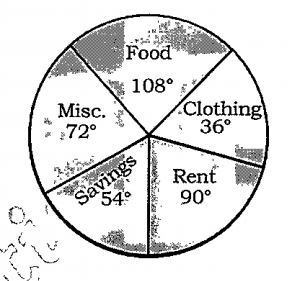 What is the total monthly income of the family?
परिवार की कुल मासिक आय कितनी है?
View SolutionThe following pie chart shows the monthly expenditure incurred by a family on various items, and their savings. Study the chart and answer the question that follows
निम्नलिखित पाई चार्ट विभिन्न मदों पर एक परिवार द्वारा किए गए मासिक खर्च और उनकी बचत को दर्शाता है। चार्ट का अध्ययन करें और फिर पूछे गए प्रश्न का उत्तर दें।
If the expenditure on education is 2,700 more than that on housing, then the total expenditure on food and clothings is:
यदि शिक्षा पर खर्च आवास से ₹2,700 अधिक है, तो भोजन और कपड़े पर कुल खर्च ज्ञात करे।
View SolutionThe pie chart given below shows the spending of a family on various heads during a month. Study the graph and answer the following questions.
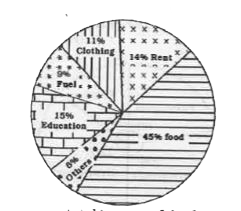
Expenditure on Rent is what percent of expenditure on Fuel?
View Solution
