Study the bar diagram and answer these questions.
नीचे दिये गया बार डायग्राम का अध्ययन कीजिये तथा इस पर आधारित प्रश्नों का उत्तर दीजिये?
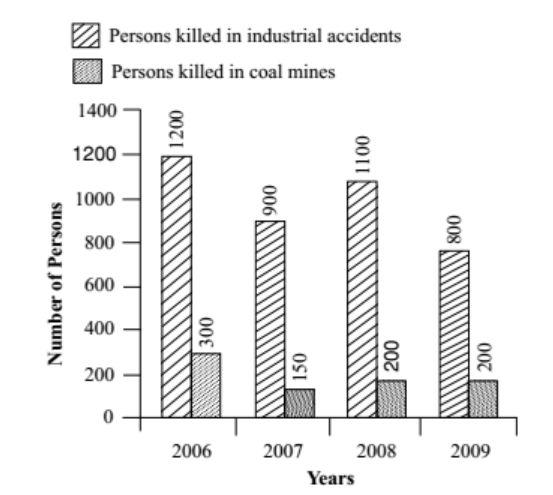
In which years, minimum number of persons were killed in coal mines other than those killed in industrial accidents?
किस वर्ष औद्योगिक दुर्घटनाओं में मरने वाले व्यक्तियों को छोड़कर कोयले की खानों में मरने वाले व्यक्तियों कौ संख्या सबसे कम थी?
2006
2007
2008
2009
Step by step video & image solution for Study the bar diagram and answer these questions. नीचे दिये गया बार डायग्राम का अध्ययन कीजिये तथा इस पर आधारित प्रश्नों का उत्तर दीजिये? In which years, minimum number of persons were killed in coal mines other than those killed in industrial accidents? किस वर्ष औद्योगिक दुर्घटनाओं में मरने वाले व्यक्तियों को छोड़कर कोयले की खानों में मरने वाले व्यक्तियों कौ संख्या सबसे कम थी? by Maths experts to help you in doubts & scoring excellent marks in Class 14 exams.
Updated on:21/07/2023Topper's Solved these Questions
Similar Questions
Study the bar diagram and answer these questions.
नीचे दिये गया बार डायग्राम का अध्ययन कीजिये तथा इस पर आधारित प्रश्नों का उत्तर दीजिये?
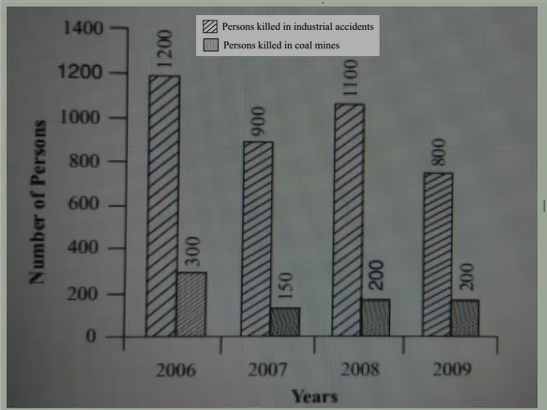
In which year, maximum number of persons were killed in industrial accidents other than those killed in coal mines?
किस वर्ष कोयले की खानों में मरने वालों को छोड़कर औद्योगिक दुर्घटनाओं में मरने वाले व्यक्तियों ,की संख्या सर्वाधिक है?
View SolutionStudy the bar diagram and answer these questions.
नीचे दिये गया बार डायग्राम का अध्ययन कीजिये तथा इस पर आधारित प्रश्नों का उत्तर दीजिये?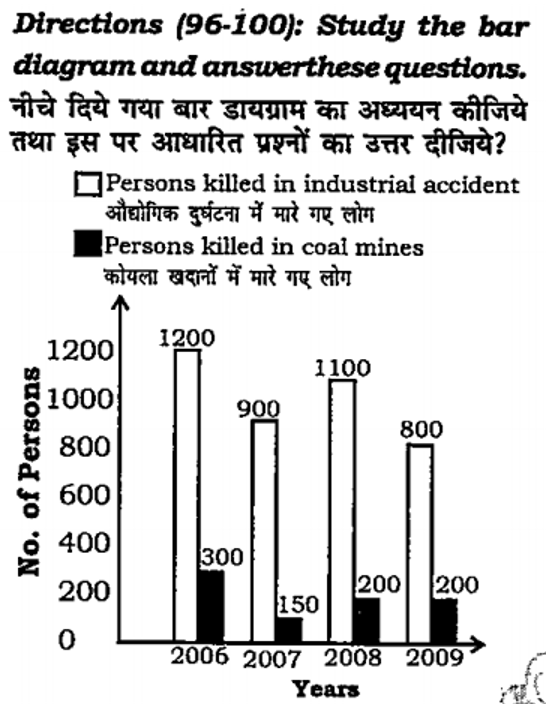
In a year, on average, how many persons. were killed in industrial accidents and coal mines together ?
औसतन, एक वर्ष में कितने व्यक्ति औद्योगिक दुर्घटनाओं तथा कोयले की खानों में कुल मिलाकर मारे गये?
View Solution
Knowledge Check
Study the following bar diagram carefully and answer the following questions :
:
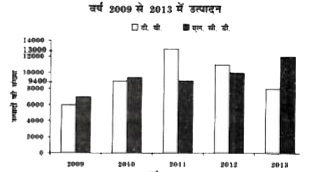
The total number of a products of electronic items is maximum in the year.A(a) 2010B(b) 2009C(c) 2011D(d) 2013
Study the graph and answer the questions.
ग्राफ का अध्ययन कीजिए और दिये गये प्रश्नों के उत्तर दीजिए:
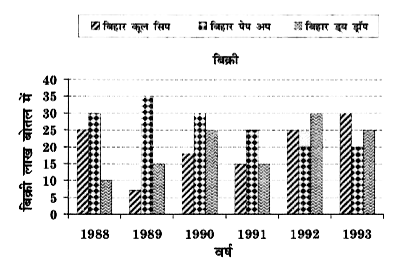
In which year the sale of cool sip is minimum?
कूल-सिप की बिक्री सबसे कम किस वर्ष हुई?
View SolutionThe pie chart given below shows the expenditure on various items and savings of a family during the year 2009. Study the pie chart and answer these questions.
नीचे दिया गया याई-चार्ट वर्ष २००९ में एक परिवार द्वारा विभिन्न मदों पर व्यय की गई धनराशि तथा बचत को प्रदर्शित करता है। पाईं-चार्ट का अध्ययन कीजिये तथा इस पर आधारित प्रश्नों का उत्तर दीजिये-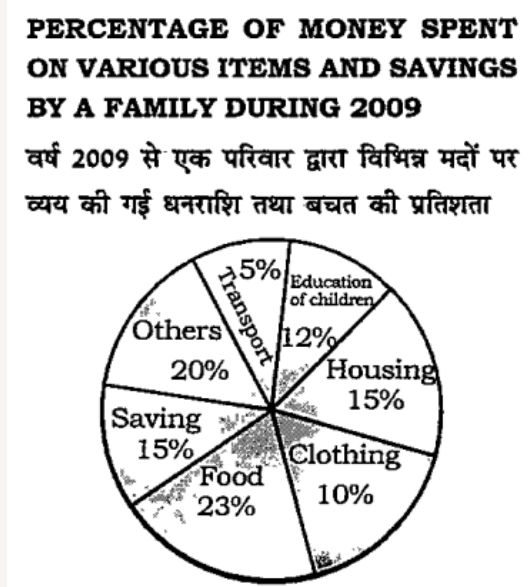 Maximum expenditure of the family other than on food, was on
परिवार द्वारा किसी मद पर भोजन के सिवाय सर्वाधिक व्यय किया गया?
View SolutionStudy the graph and answer the questions.
ग्राफ का अध्ययन कीजिए और दिये गये प्रश्नों के उत्तर दीजिए:
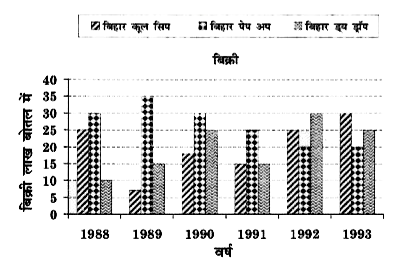
In case of which soft drink was the average annual sale minimum during the period 1988-1993 ?
किस सॉफ्ट ड्रिंक के मामले में 1988-1993 की अवधि में औसत वार्षिक बिक्री सबसे कम रही?
View SolutionThe bar graph provided below represents the production of rice and wheat in different states of a country in the certain year. Answer the questions based on the bar graph.
नीचे दिये गया बार-ग्राफ एक निश्चित वर्ष में विभिन्न प्रदेशों में चावल और गेहूँ की उपज को दर्शाता है। इस ग्राफ पर आधारित प्रश्नों के उत्तर दें।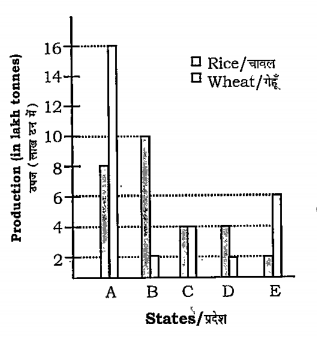 The total production of rice and wheat in all the mentioned states in minimum in the state.
दिये गये सभी प्रदेशों में से किस प्रदेश में चावल व गेहूँ को कुल उपज सबसे कम है?
View SolutionThe given bar graph shows the biscuit exports of India over a period of five years. Study the graph and answer the question that follows.
दिया गया दंड आरेख में पांच साल की अवधि में भारत के बिस्किट निर्यात को दर्शाता है। आरेख का अध्ययन करें और उस प्रश्न का उत्तर दें जो पूछा गया है। In which year, the percentage increase in exports was maximum from its preceding year:
किस वर्ष में निर्यात में प्रतिशत वृद्धि इसके पूर्व वर्ष से अधिकतम थी?
View SolutionStudy the graph and answer the question that follows.
आरेख का अध्ययन करें एवं इसके बाद पूछे गए प्रश्नों के उत्तर दें |
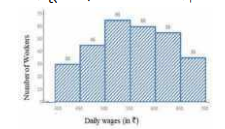 What is the ratio of the total number of workers whose daily wages are less than Rs 500 to the total number of workers whose daily wages are Rs600 and above?
500 रुपये से कम दैनिक मजदूरी वाले श्रमिकों की कुल संख्या और 600 रुपये तथा अधिक की दैनिक मजदूरी वाले श्रमिकों की कुल संख्या में अनुपात ज्ञात करें |
View SolutionThe given pie-chart, shows the percentage distribution of the expenditure incurred in publishing a book. Study the pie-chart and the answer the question based on it. /
दिया गया पाई चार्ट किसी पुस्तक के प्रकाशन में हुए व्ययों के प्रतिशत वितरण को दर्शाता है | इस पाई चार्ट का अध्ययन करें तथा इस पर आधारित प्रश्न का उत्तर दें | In the given pie-chart, by what percentage the Royalty on the book is less than the Printing cost? /
दिए गए पाई चार्ट के अनुसार, इस पुस्तक पर रॉयल्टी प्रकाशन की लागत से कितना प्रतिशत कम है ?
View Solution
