Study the bar diagram and answer these questions.
नीचे दिये गया बार डायग्राम का अध्ययन कीजिये तथा इस पर आधारित प्रश्नों का उत्तर दीजिये?
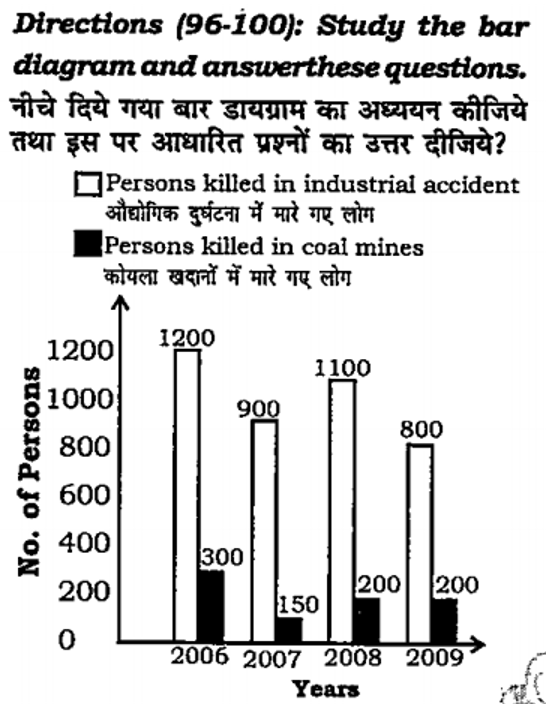
In a year, on average, how many persons. were killed in industrial accidents and coal mines together ?
औसतन, एक वर्ष में कितने व्यक्ति औद्योगिक दुर्घटनाओं तथा कोयले की खानों में कुल मिलाकर मारे गये?
121.25
1212
1212.5
1000
Step by step video & image solution for Study the bar diagram and answer these questions. नीचे दिये गया बार डायग्राम का अध्ययन कीजिये तथा इस पर आधारित प्रश्नों का उत्तर दीजिये? In a year, on average, how many persons. were killed in industrial accidents and coal mines together ? औसतन, एक वर्ष में कितने व्यक्ति औद्योगिक दुर्घटनाओं तथा कोयले की खानों में कुल मिलाकर मारे गये? by Maths experts to help you in doubts & scoring excellent marks in Class 14 exams.
Updated on:21/07/2023Topper's Solved these Questions
Similar Questions
Study the bar diagram and answer these questions.
नीचे दिये गया बार डायग्राम का अध्ययन कीजिये तथा इस पर आधारित प्रश्नों का उत्तर दीजिये?
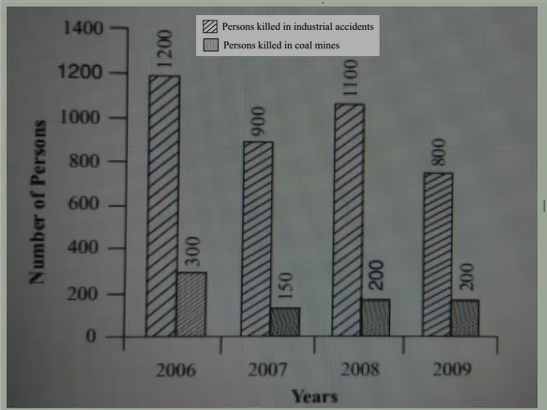
In which year, maximum number of persons were killed in industrial accidents other than those killed in coal mines?
किस वर्ष कोयले की खानों में मरने वालों को छोड़कर औद्योगिक दुर्घटनाओं में मरने वाले व्यक्तियों ,की संख्या सर्वाधिक है?
View SolutionStudy the bar diagram and answer these questions.
नीचे दिये गया बार डायग्राम का अध्ययन कीजिये तथा इस पर आधारित प्रश्नों का उत्तर दीजिये?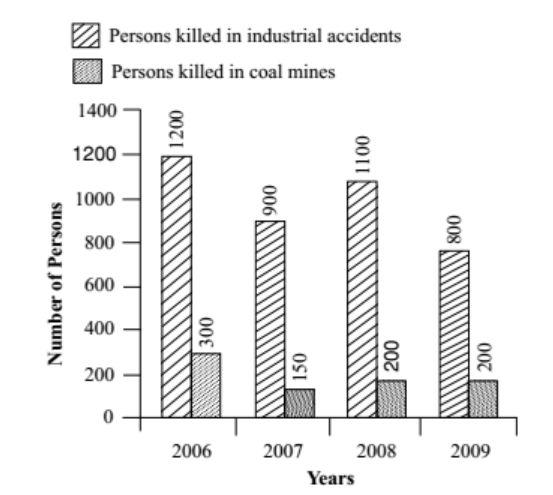
In which years, minimum number of persons were killed in coal mines other than those killed in industrial accidents?
किस वर्ष औद्योगिक दुर्घटनाओं में मरने वाले व्यक्तियों को छोड़कर कोयले की खानों में मरने वाले व्यक्तियों कौ संख्या सबसे कम थी?
View Solution
Knowledge Check
Study the following bar diagram carefully and answer the following questions :
:
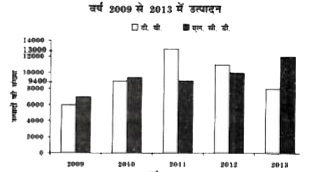
The total number of a products of electronic items is maximum in the year.A(a) 2010B(b) 2009C(c) 2011D(d) 2013
Study the following graph and answer the given questions:
निम्न ग्राफ का अध्ययन कीजिए और दिये गये प्रश्नों के उत्तर दीजिए:
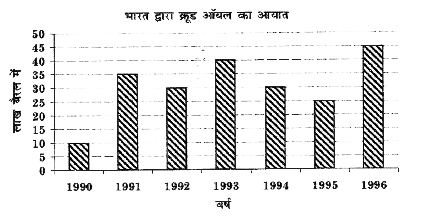
From year 1995 to the year 1996, what was the percentage increase in imports of crude oil?
वर्ष 1995 से वर्ष 1996 तक क्रूड ऑयल के आयात में कितने प्रतिशत वृद्धि हुई?
View SolutionStudy the following graph and answer the questions based on the graph.
आरेख का अध्ययन करें और आरेख के आधार पर प्रश्नों के उत्तर दें: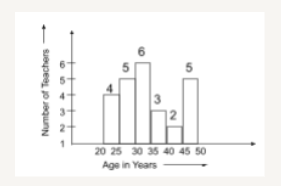 What percentage of the total number of teachers are aged less than 45 years?
कुल शिक्षकों में से कितने प्रतिशत 45 वर्ष से कम आयु के हैं?
View SolutionStudy the following graph and answer the given questions:
निम्न ग्राफ का अध्ययन कीजिए और दिये गये प्रश्नों के उत्तर दीजिए:
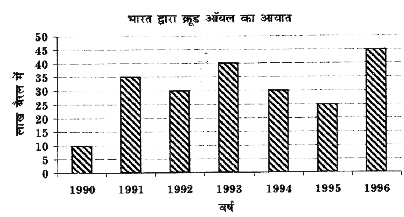
If the rate of one barrel of crude oil was Rs. 25.60 in 1995, then what was the total value of imports in ) in that year?
यदि वर्ष 1995 में क्रूड ऑयल के एक बैरल की दर Rs. 25.60 थी, तो उस वर्ष आयात का कुल मूल्य (Rs. में) कितना था?
View SolutionStudy the following bar graph and answer the question given.
निम्नलिखित दंड-आरेख (बार-ग्राफ) का अध्ययन कीजिए तथा दिए गए प्रश्न का उत्तर दीजिए: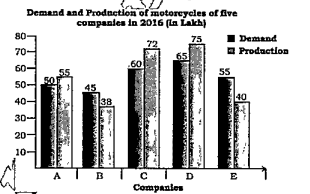 The total production of
motorcycles of companies C, D and E is what per cent less than the total demand of motorcycles of all the companies during five
years?
कंपनी C,D और E के द्वारा मोटरसाइकिलों का कुल उत्पादन, पांच वर्षों के दौरान सभी कंपनियों की मोटरसाइकिलों की कुल मांग से कितने ग्रतिशत कम है?
View SolutionThe pie chart given below shows the expenditure on various items and savings of a family during the year 2009. Study the pie chart and answer these questions.
नीचे दिया गया याई-चार्ट वर्ष २००९ में एक परिवार द्वारा विभिन्न मदों पर व्यय की गई धनराशि तथा बचत को प्रदर्शित करता है। पाईं-चार्ट का अध्ययन कीजिये तथा इस पर आधारित प्रश्नों का उत्तर दीजिये-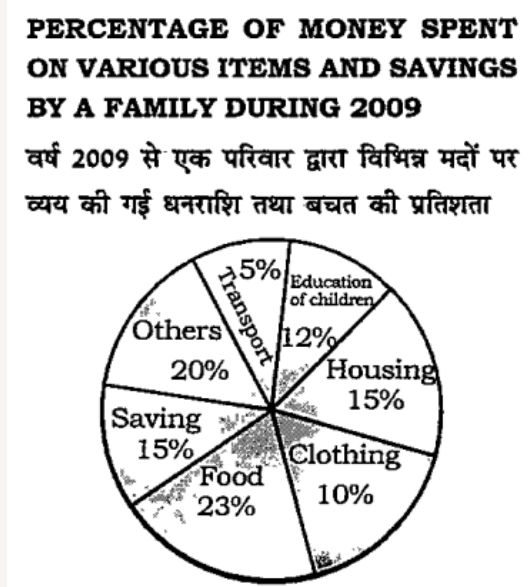 Maximum expenditure of the family other than on food, was on
परिवार द्वारा किसी मद पर भोजन के सिवाय सर्वाधिक व्यय किया गया?
View SolutionThe sub divided bar diagram given below depicts the result of class XII students of a school for three years. Study the diagram and answer the questions given below.
निम्नलिखित दण्ड आरेख तीन वर्षों के लिए एक स्कूल के कक्षा XII के छात्रों का परीक्षा परिणाम दिखाता है। दण्ड आरेख का अध्ययन कीजिए और निम्नलिखित प्रश्नों का उत्तर दीजिए :
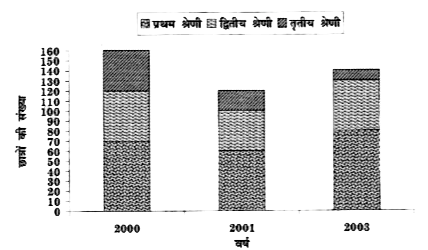
The percentage of students passed with Second class in the year 2000 is
वर्ष 2000 में द्वितीय श्रेणी में उत्तीर्ण हुए छात्रों का प्रतिशत है:
View SolutionThe sub divided bar diagram given below depicts the result of class XII students of a school for three years. Study the diagram and answer the questions given below.
निम्नलिखित दण्ड आरेख तीन वर्षों के लिए एक स्कूल के कक्षा XII के छात्रों का परीक्षा परिणाम दिखाता है। दण्ड आरेख का अध्ययन कीजिए और निम्नलिखित प्रश्नों का उत्तर दीजिए :

The percentage of students passed with Second class in the year 2000 is
वर्ष 2000 में द्वितीय श्रेणी में उत्तीर्ण हुए छात्रों का प्रतिशत है:
View Solution
