Those diagrams in which data are presented in the form of bars or rectangles-
A
Pie diagrams,
B
Scatter diagram
C
Bar diagrams
D
Frequency Curve
Text Solution
The correct Answer is:C
|
Similar Questions
Knowledge Check
18 Bar diagram is
AsingularBmultipleC(1) and (2) both,DNone of these.The process of presenting data in the form of a table in called:
AorganisationBclassificationCpresentationDtabulationThe presentation of data in the form of pictures is called ________ .
ABar graphBPictographCTally marksDNone of these
Multiple bar diagrams are those diagrams which show two or more seta of data simulaneously. (True/False)
View SolutionFollowing tables shows estimates of cost of production of certain commodities. Present the data in the form of sub divided bar diagram:

View Solutionbar graph and their construction
View SolutionBAR GRAPH: Definition
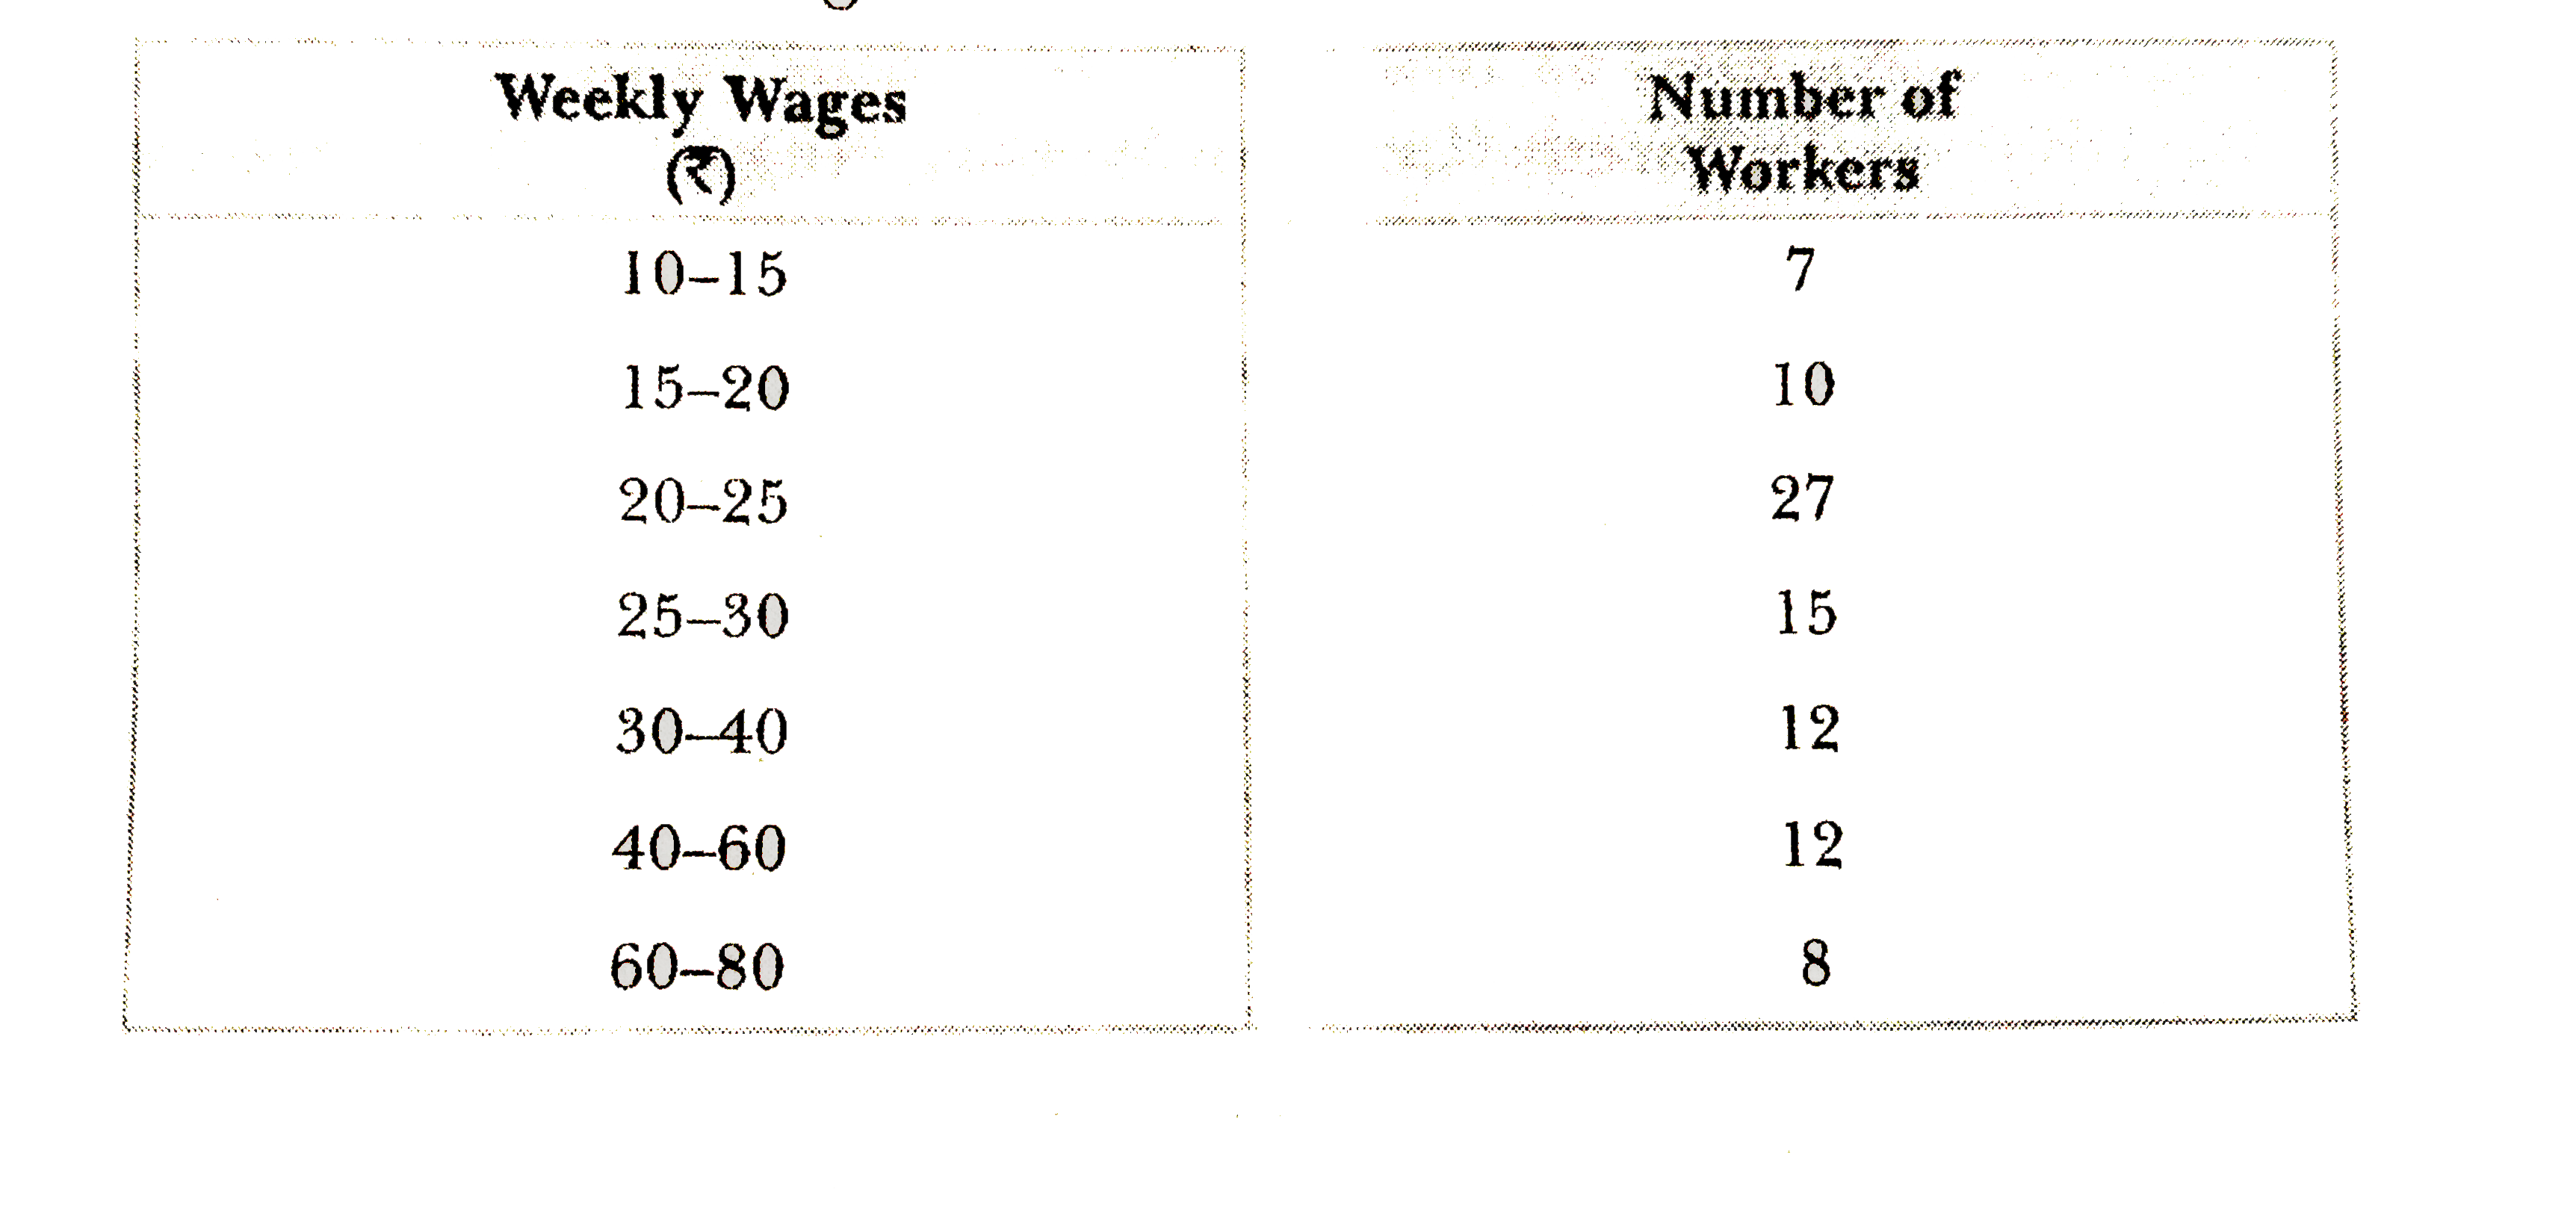
View SolutionPresent the following data in the form of a histogram :

View Solution

