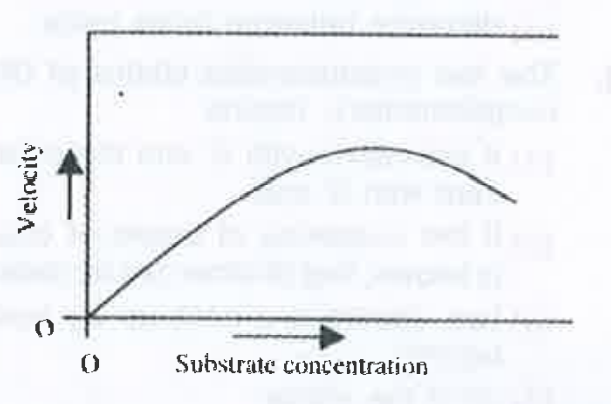
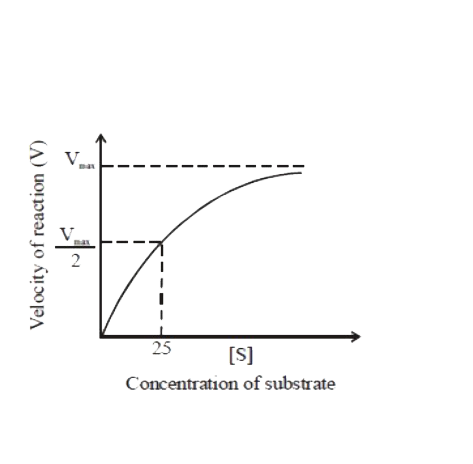
What does the graph indicate ?
The graph given below shows the effect of substrate concentration on the rate of reaction of the enzyme green- gram-phosphatase.
 Solution in Kannada
The rate of enzyme reaction is directly proportional to the substrate concentration.
Presence of an enzyme inhibitor in the reaction mixture
Formation of an enzyme-substrate complex
At higher substrate concentration the ph increase
The correct Answer is:B
Step by step video & image solution for What does the graph indicate ? The graph given below shows the effect of substrate concentration on the rate of reaction of the enzyme green- gram-phosphatase. by Biology experts to help you in doubts & scoring excellent marks in Class 11 exams.
Topper's Solved these Questions
- BOOK - TRUEMAN BIOLOGYCHAPTER - ANIMAL TISSUES EXERCISE - MULTIPLE CHOICE QUESTIONS194videos
ANIMAL TISSUES
- BOOK - TRUEMAN BIOLOGYCHAPTER - CELL- THE BASIC UNIT OF LIFE ( CELL AND ITS STRUCTURAL ORGANISATION )EXERCISE - MULTIPLE CHOICE ANSWER TYPE311videos
CELL- THE BASIC UNIT OF LIFE ( CELL AND ITS STRUCTURAL ORGANISATION )
Similar Questions
Who established Histology as a separate
branch of Zoology ?03:51View SolutionAn example of enucleated living plant cell is
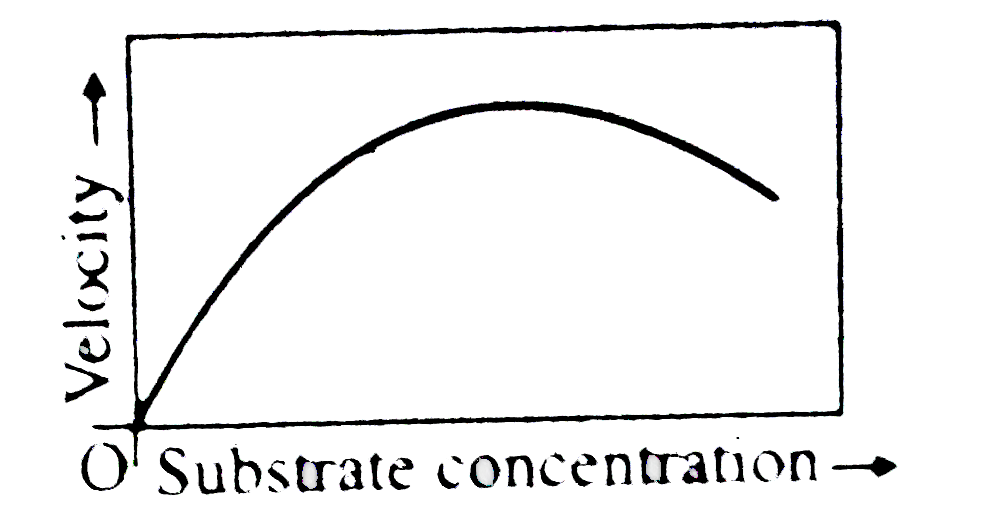
04:33View SolutionThe given graph shows the effect of substrate concentration on the rate of reaction of the enzyme green gram-phosphatase

What dose the graph indicateView SolutionThe given graph shows the effect of substrate concentration on the rate of reaction of the enzymes green gram-phosphatase. What does the graph indicate ?
 View Solution
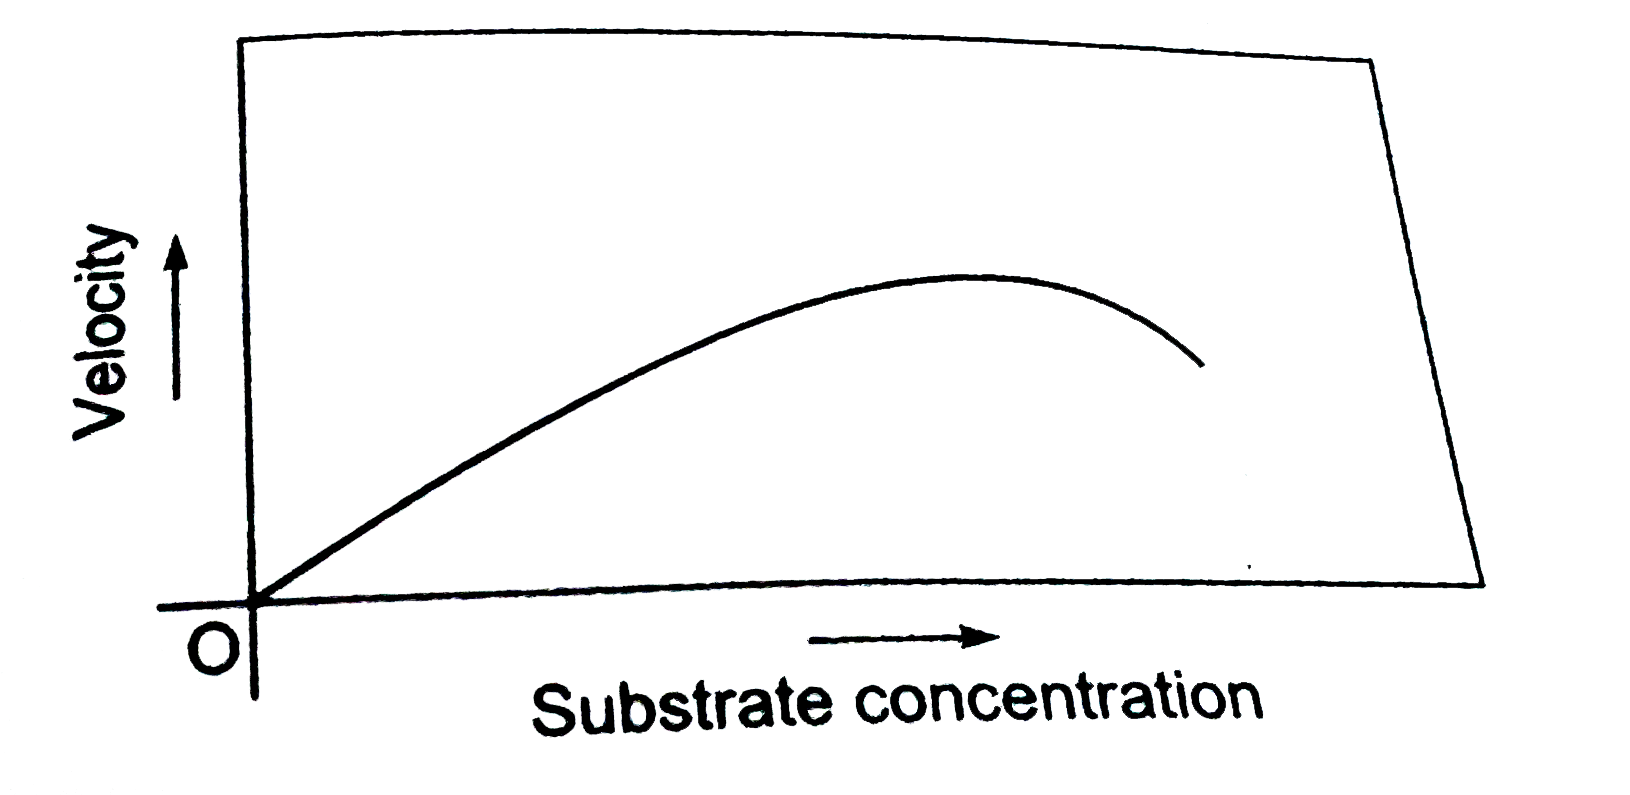
the graph given in Fig.9.36 shows the effect of substrate concentration on the rate of reaction of the enzyme green-gram -phosphatase . What does the graph indicates ?
 03:17View Solution
The given graph shows the effect of substrate concentration on the rate of reaction of the enzyme green-gram-phosphatase What does the graph indicate?
02:31View SolutionThe graph given below shows the effect of substrate concentration on the rate of reaction of the enzyme green-gram-phosphatase What does the graph indicates?
04:47View SolutionFollowing graphs show the effect of change in concentration of substrate on enzyme activity:
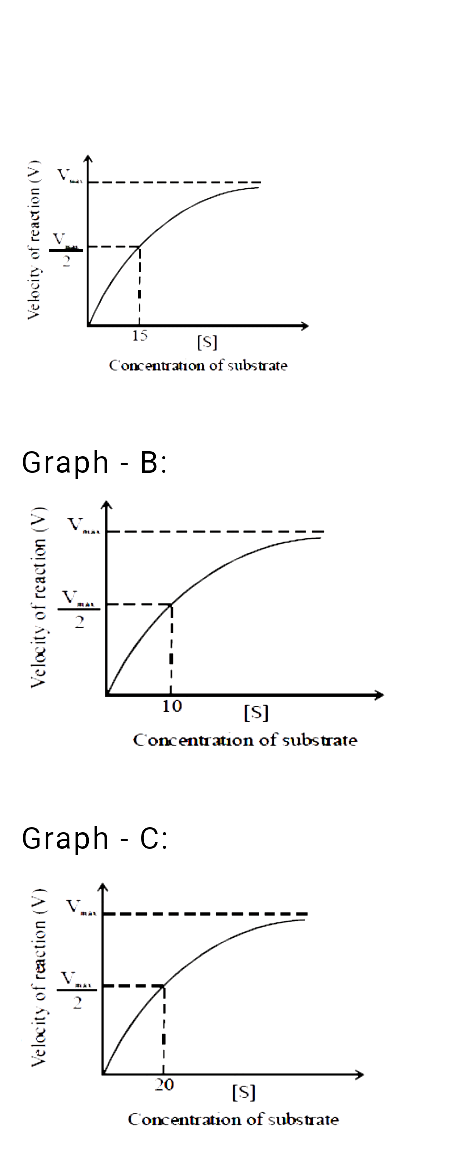
In which of the above curve,the enzyme shows maximum substrate affinity01:52View SolutionWhat is denoted by X and Y in the given graph?
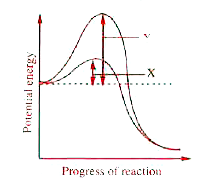
XY1) Activation energy without enzymeActivation energy with enzyme2) Activation energy with enzyme Activation energy without enzyme3) Substrate concentration with enzymeSubstrate concentration without enzyme4) Substrate concentration without enzymeSubstrate concentration with enzyme02:02View Solutionटिटेनस रोग का कारक कौन है ?
05:48View SolutionBased on the graph given below, explain the effect of concentration of substrate on enzyme activity.
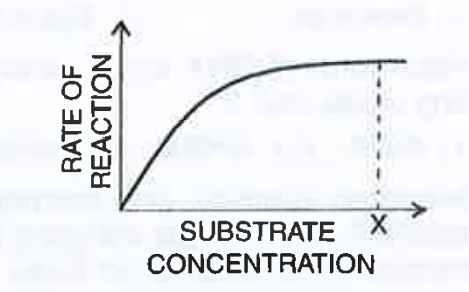
04:35View SolutionThe given graph is showing the relationship between the rate of enzyme reaction and concentration of substrate. At concentration of substrate greater than X, the
02:15View SolutionWhat does the graph indicate ?
The graph given below shows the effect of substrate concentration on the rate of reaction of the enzyme green- gram-phos-phatase.
 03:43View Solution
Following graphs show the effect of change in concentration of substrate on enzyme activity: In which of the above curve,the enzyme shows maximum substrate affinity
06:01View SolutionThe given graph is showing the relationship between the rate of enzyme reaction and concentration of substrate. At concentration of substrate greater than X, the
 02:24View Solution

