The following graph shows the data of five companies A, B,C, D, E with respect to the male
and female ratio of employees above, or below the average salary.
निम्नलिखित आरेख औसत वेतन से अधिक या कम प्राप्त करने वाले कर्मचारियों में पुरुष और महिलाओं के अनुपात के संबंध में पांच कंपनियों A, B, C, D, E के आंकड़ों को
दर्शाता है।
 If in the company D, the percentage of employee above the average salary is 16% which is equal to 80, then the number of employees below average salary are:
यदि कंपनी D में, औसत वेतन से ऊपर के कर्मचारियों का प्रतिशत 16% है जो कि 80 के बराबर है, तो औसत वेतन से कम पाने वाले कर्मचारियों की संख्या है:
300
420
520
470
The correct Answer is:B
Step by step video & image solution for The following graph shows the data of five companies A, B,C, D, E with respect to the male and female ratio of employees above, or below the average salary. निम्नलिखित आरेख औसत वेतन से अधिक या कम प्राप्त करने वाले कर्मचारियों में पुरुष और महिलाओं के अनुपात के संबंध में पांच कंपनियों A, B, C, D, E के आंकड़ों को दर्शाता है। If in the company D, the percentage of employee above the average salary is 16% which is equal to 80, then the number of employees below average salary are: यदि कंपनी D में, औसत वेतन से ऊपर के कर्मचारियों का प्रतिशत 16% है जो कि 80 के बराबर है, तो औसत वेतन से कम पाने वाले कर्मचारियों की संख्या है: by Maths experts to help you in doubts & scoring excellent marks in Class 14 exams.
Updated on:21/07/2023Topper's Solved these Questions
Similar Questions
The graphs of the equations 3x+y-5=0 and 2x-y-5=0 intersect at the point P(α,β). What is the value of (3α+β) ?
समीकरण 3x+y-5=0 तथा 2x-y-5=0 के आरेख एक बिंदु P(α,β) पर एक-दूसरे को काटते है (3α+β) का मान क्या है ?
View SolutionAfter giving two successive discounts, each of x%, on the marked price of an article, total discount is Rs. 259.20. If the marked price of the article is Rs. 720, then the value of x is :
View SolutionMatch the following Column A to Column B

View SolutionMatch the following Column A to Column B

View SolutionThe inequation represented by the graph given below is :
View SolutionThe inequation that best describes the graph given below is _________
View SolutionThe inequation that best describes the following graph is _________
View SolutionStudy the given graph and answer the question that follows:
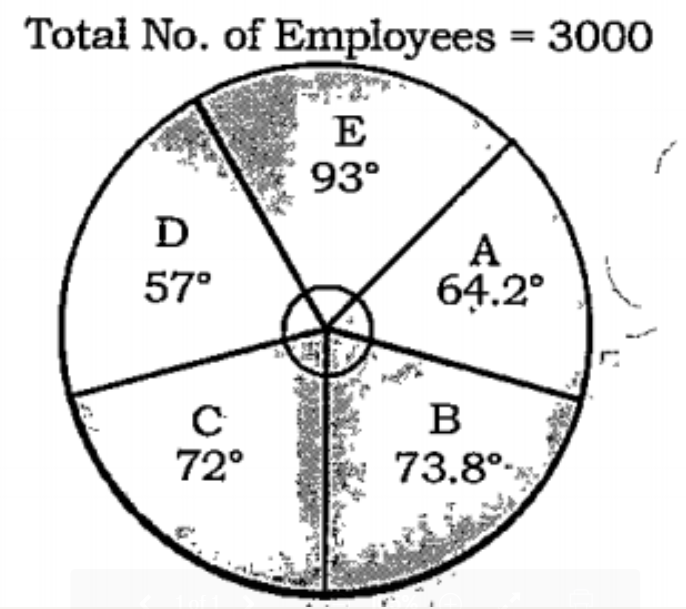 Break up for distribution (degree wise) of the employees working in five departments (A,B,C,D, and E) in a company. If 20% of the employees working in department E are transferred to department A, then the difference between eh number of employees in A and 124% of the employees working in department C is:
दिए गए ग्राफ का अध्ययन करें और नीचे दिए गए प्रश्न का उत्त्तर दें। कंपनी के पांच विभागों (A,B,C,D, और E) में काम कर रहे कर्मचारियों का वितरण
(डिग्री में) यदि विभाग E में कार्य करने वाले 20% कर्मचारियों को विभाग A में स्थानांतरित कर दिया जाता है, तो विभाग A में कर्मचारियों की संख्या और विभाग C में कार्यरत 124% कार्मचारियों के बीच अंतर ज्ञात कीजिए।
View SolutionThe given Bar graph presents the Demand and Production of motorcycles of five companies (in lakhs) दिया गया दंड आरेख पांच कंपनियों के संबंध में मोटरसाइकिलों की मांग और उत्पादन ( लाख में ) को दर्शाता है| The average Production of motorcycles of companies B, C and E taken together is what percent less than the Demand of motorcycles of D? कंपनी B, C और E को मिलाकर मोटरसाइकिलों का औसत उत्पादन D की मोटरसाइकिलों की मांग से कितना प्रतिशत कम है ?
View SolutionThe given Bar graph presents the Demand and Production of motorcycles of five companies (in lakhs) दिया गया दंड आरेख पांच कंपनियों के संबंध में मोटरसाइकिलों की मांग और उत्पादन ( लाख में ) को दर्शाता है| What is the ratio of the total Demand of motorcycles of companies A and D taken together to the Production of motorcycles of company C? कंपनी A और D को मिलाकर मोटरसाइकिलों की कुल मांग का कंपनी C की मोटरसाइकिलों के उत्पादन के साथ अनुपात ज्ञात करें |
View SolutionThe bar graph given below shows the number of men and women working in the five different companies.
नीचे दिया गया दंड आरेख पाँच विभिन्न कंपनियों में कार्य करने वाले पुरुषों तथा महिलाओं की संख्या को दर्शाता है |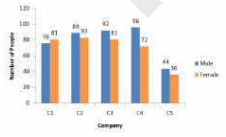 The total number of men working in the five companies is approximately what percent more than that of women working in these companies?
इन पांच कंपनियों में कार्य करने वाले पुरुषों की कुल संख्या, इन पांच कंपनियों में कार्य करने वाली महिलाओं की कुल संख्या से (लगभग) कितना प्रतिशत अधिक है ?
View SolutionThe given bar graph shows the production and sale of mobile handsets of six different companies A, B, C, D, E, & F during the period of one month. With respect to production, the sale percentage of which company is highest ? दंड आरेख विभिन्न कंपनियों A, B, C, D, E & F की एक माह में मोबाइल हैंडसेट के उत्पादन और बिक्री को दर्शाता है | किस कंपनी की बिक्री का प्रतिशत, उसके उत्पादन के संदर्भ में, सबसे अधिक है ?
View SolutionThe following table shows the income (in rupees) for a particular month, together with their source, in respect of 5 employees(A,B,C,D and E).
निम्नलिखित तालिका 5 कर्मचारियों ( A.B, C, D तथा E) के संबंध में एक विशेष माह की आय तथा उसके स्रोत को दर्शाती है।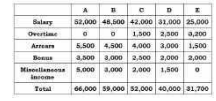 How many employees got more arrears than the average arrears received by all the employees?
कितने. कर्मचारियों को. सभी कर्मचारियों को मिलने वाले औसत बकाया से अधिक बकाया राशि मिली है ?
View SolutionThe following table shows the income (in ₹) for a particular month, together with their source, in respect of 5 employees(A,B,C,D and E).
निम्नलिखित तालिका 5 कर्मचारियों (A, B, C, D तथा E ) के संबंध में एक विशेष माह की आय ( रुपये में ) तथा उसके स्रोत को दर्शाती है |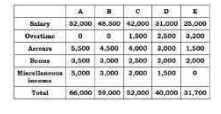 How many employees got more than a total of ₹ 10,000 as income other than salary?
कितने कर्मचारियों को वेतन के अतिरिक्त कुल 10,000 रुपये से अधिक की आय हुई है ?
View Solution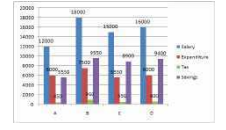
The graph represents the salary, expenditure, tax and savings (in rupees) per month of the persons A, B, C and D. Study the graph and answer the question. The expenditure as a percentage of salary is the least for:
उपरोक्त आरेख व्यक्ति A, B, C और D के प्रतिमाह वेतन, व्यय, कर तथा बचत ( रुपये में) को दर्शाता है। इस आरेख का अध्ययन करें तथा प्रश्न का उत्तर दें। वेतन(Salary) के प्रतिशत के रूप में सबसे कम व्यय(Expenditure) किसका है?
View Solution
The above graph represents the salary, expenditure, tax and savings (in rupees) per month of the persons A, B, C and D. Study the graph and answer the question. The expenditure as a percentage of salary is the least for:
उपरोक्त आरेख व्यक्ति A, B, C और D के प्रतिमाह वेतन, व्यय, कर तथा बचत ( रुपये में) को दर्शाता है। इस आरेख का अध्ययन करें तथा प्रश्न का उत्तर दें। वेतन(Salary) के प्रतिशत के रूप में सबसे कम कर(Tax) किसका है?
View Solution
