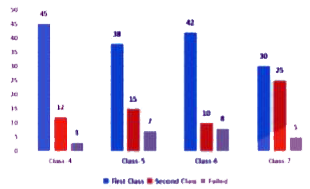
The given chart shows the number of students in Class 4, Class 5, Class 6 and Class 7 who got first class, second class and failed in the final examinations.
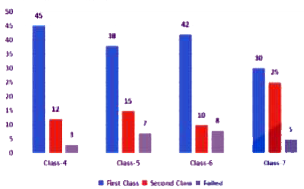
What is the pass percentage of Class 6?
0.8783
0.9012
0.8666
0.8996
Step by step video & image solution for The given chart shows the number of students in Class 4, Class 5, Class 6 and Class 7 who got first class, second class and failed in the final examinations. What is the pass percentage of Class 6? by Maths experts to help you in doubts & scoring excellent marks in Class 14 exams.
Topper's Solved these Questions
Similar Questions
The given chart shows the number of students in Class 4, Class 5, Class 6 and Class 7 who got first class, second class and failed in the final examination.
दिए गए आरेख कक्षा 4, कक्षा 5, कक्षा 6 और कक्षा 7 में उन छात्रों की संख्या को दशशाते हैं, जिन्होंने अंतिम परीक्षा में प्रथम श्रेणी, द्वितीय श्रेणी प्राप्त किया और जो असफल रहे। Which class has the least number of students who passed?
किस कक्षा में सबसे कम छात्र उत्तीर्ण हुए हैं?View SolutionThe given chart shows the number of students in Class 4, Class 5, Class 6 and Class 7 who got first class, second class and failed in the final examination.
दिए गए आरेख कक्षा 4, कक्षा 5, कक्षा 6 और कक्षा 7 में उन छात्रों की संख्या को दशशाते हैं, जिन्होंने अंतिम परीक्षा में प्रथम श्रेणी, द्वितीय श्रेणी प्राप्त किया और जो असफल रहे।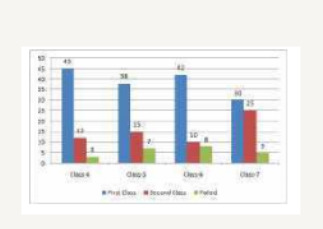 Which class has the highest number of students who passed?
किस कक्षा में उत्तीर्ण होने वाले छात्रों की संख्या सबसे अधिक है?View Solution
Knowledge Check
- Question 1 - Select One
The given chart shows the number of students in Class 4, Class 5, Class 6 and Class 7 who got first class, second class andfailed in the final examinations. What is the pass percentage of Class 4?
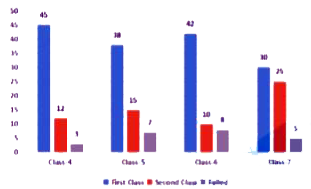
A94.66B91.23C98.28D95.87 - Question 2 - Select One
The given chart shows the number of students in Class 4, Class 5, Class 6 and Class 7 who got first class, second class and failed in the final examinations.
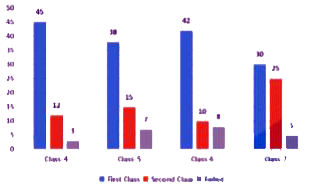
Which class has the highest number of students who passed?AClass 4BClass 7CClass 6DClass 5 - Question 3 - Select One
The given chart shows the number of students in Class 4, Class 5, Class 6 and Class 7 who got first class, second class andfailed in the final examinations.
Which class has the least number of students who passed?AClass 4BClass 6CClass 5DClass 7
The following graph shows the number of boys and girls in Class V, Class VI, Class VII and Class VIII. Study the graph and answer the question.
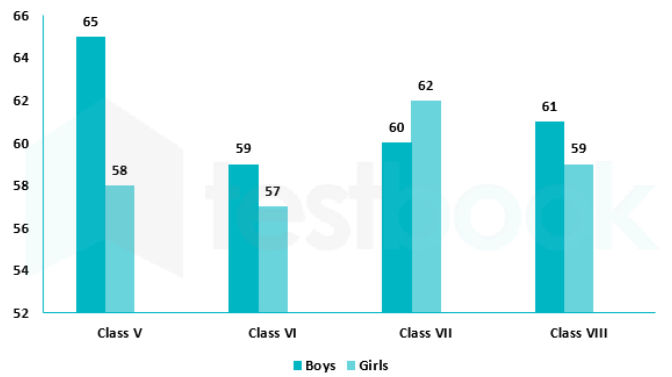
What is the average number of girls in all the classes?View SolutionThe following graph shows the number of boys and girls in Class V, Class VI, Class VII and Class VIII. Study the graph and answer the question.
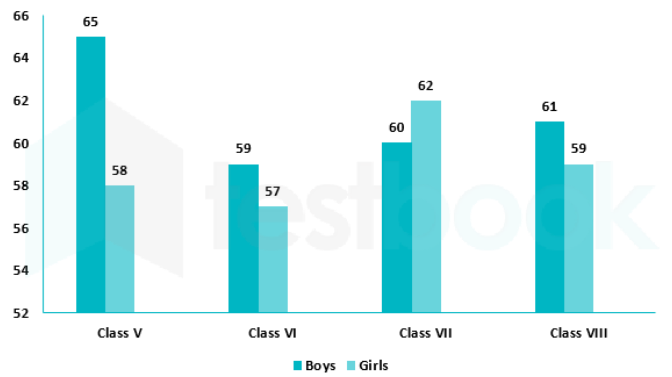
What class has the maximum number of students?View SolutionThe following graph shows the number of boys and girls in Class V, Class VI, Class VII and Class VIII. Study the graph and answer the question.
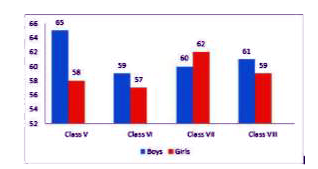
In which class, the percentage increase in the number of boys as compared to its previous class is least?View SolutionThe given bar graph, shows the number of students in different classes.
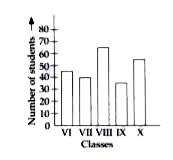
How many more students are there in class VIII than in class IX?View SolutionThe given bar graph, shows the number of students in different classes.
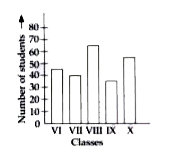
Find the total number of students in the classes VIII to X.View Solution

